Marc Chandler
My articles My offerMy siteAbout meMy videosMy books
Follow on:LinkedINTwitterSeeking AlphaAmazon
Swiss FrancThe Euro has risen by 0.17% to 1.1534 CHF. |
EUR/CHF and USD/CHF, March 01(see more posts on EUR/CHF, USD/CHF, )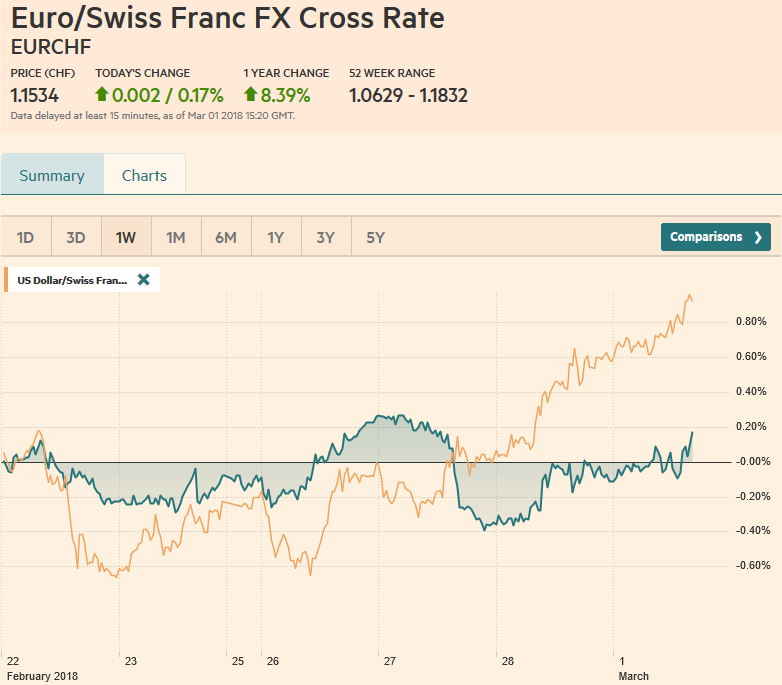 Source: markets.ft.com - Click to enlarge |
FX RatesThe US dollar rebounded last September and October before the downtrend resumed in November, and lasted through January. The dollar gained broadly last month, except against the yen, which rose almost 2.4% in February. This pattern is evident today, the first trading day of March. The dollar is extending its gains against most currencies but is only managing to consolidate in a narrow range against the yen. The euro is testing the 38.2% retracement of the leg up that began in last November. It is found near $1.2175. A break of it would likely encourage more liquidation ahead of the weekend’s political events (SPD in Germany and Italian elections). As the euro moves to levels not seen in over a month, and given the political risk, it is not unexpected that short-dated volatility continues to increase. |
FX Daily Rates, March 01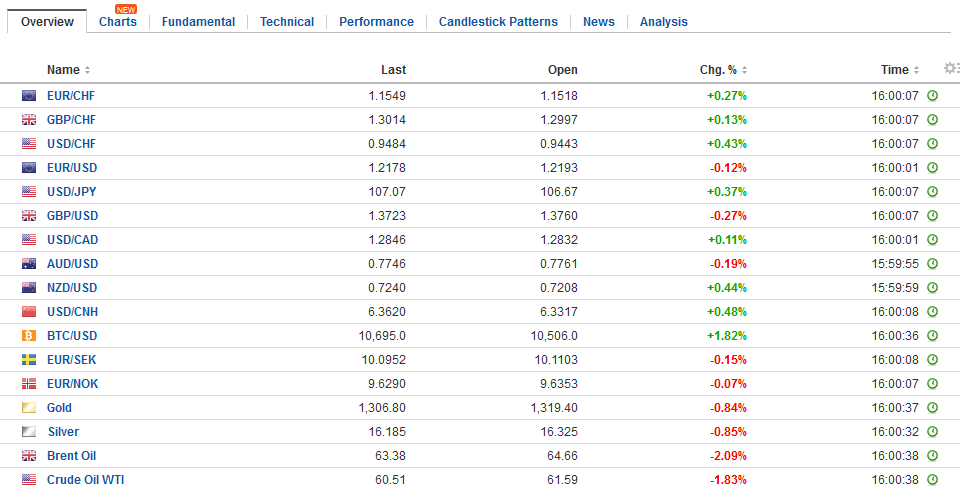 - Click to enlarge |
| One-week implied vol that that was a little below 7.3% at the end of last week is near 10.8% now. The premium for one-week euro puts over calls remains in the range seen earlier this week, which is the most since last May. There are two big option strikes that are maturing today. There is 1.2 bln euros struck at $1.2150 and 2.0 bln euros at $1.22.
Sterling closed below a trend line from the mid-November lows, and below the 50-day moving average for the first in three months. It has not been able to resurface above the trend line today (~$1.3175). Note that the $1.3700 area houses the 50% retracement of sterling’s gains since those mid-November lows. A break of this area could target $1.3550-$1.3600. The dollar is flat against the yen in narrow ranges, unable to distance itself much from the JPY10.650 area. The dollar has not closed above its 20-day moving average against the yen in nearly two months. It is found a little above JPY10.770 today. There is a $508 mln option at JPY106.50 that expires today. |
FX Performance, March 01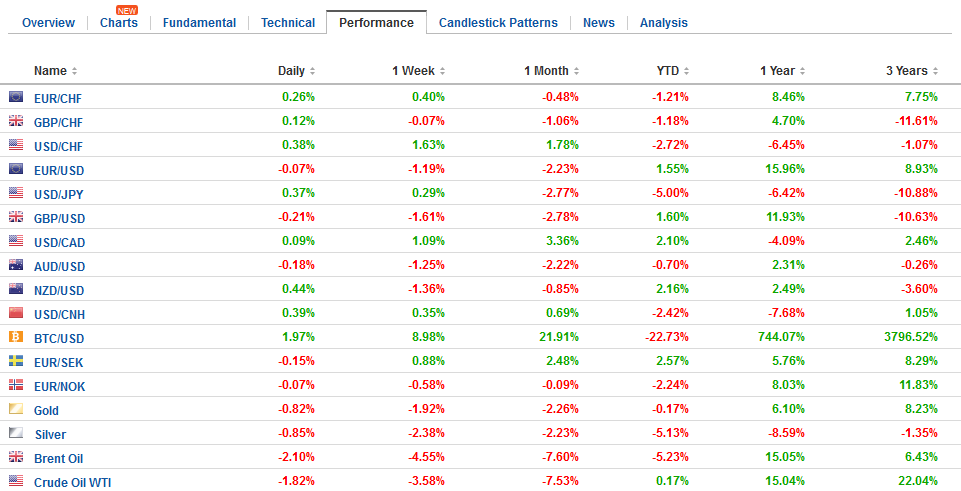 - Click to enlarge |
EurozoneThe small uptick in the final EMU February manufacturing PMI to 58.6 from 58.5 did practically nothing to help the euro, and dispel ideas that economic momentum may have peaked at the end of last year. The manufacturing PMI is a full index point below the January reading, and is the second consecutive decline. |
Eurozone Manufacturing Purchasing Managers Index (PMI), March 2013 - 2018(see more posts on Eurozone Manufacturing PMI, )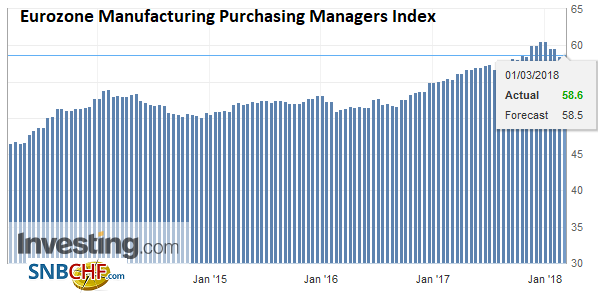 Source: Investing.com - Click to enlarge |
| The ECB meets next week and Draghi often refers to the sentiment indicators and seems to use them as leading indicators. The softer PMI readings may temper changes in the forward guidance, which is the focus. |
Eurozone Unemployment Rate, Apr 2013 - Mar 2018(see more posts on Eurozone Unemployment Rate, )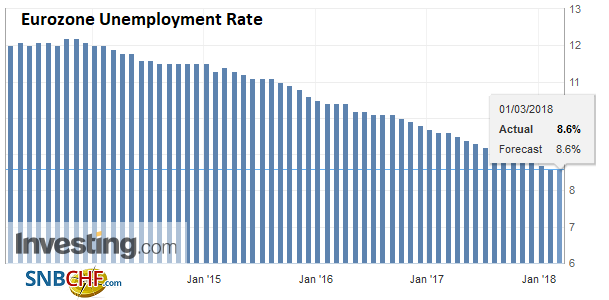 Source: Investing.com - Click to enlarge |
ItalyAhead of the election the Italian data will not make good headlines. Its manufacturing PMI fell to 56.8 from 59.0 and the January unemployment rate ticked up to 11.1% from a revised 10.9% (from 10.8%) in December. |
Italy Manufacturing Purchasing Managers Index (PMI), Apr 2013 - Mar 2018(see more posts on Italy Manufacturing PMI, )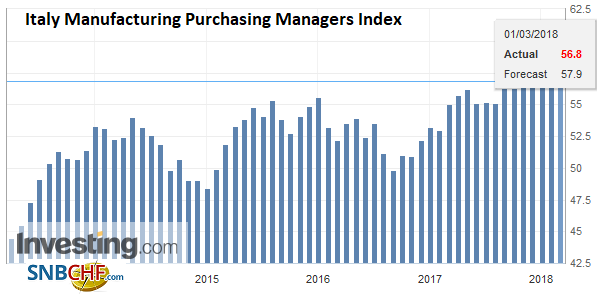 Source: Investing.com - Click to enlarge |
SpainIn contrast, Spain’s manufacturing PMI unexpectedly rose to 56.0 from 55.2. This is just off the 56.1 peak last November. |
Spain Gross Domestic Product (GDP) YoY, Oct 2013 - Mar 2018(see more posts on Spain Gross Domestic Product, )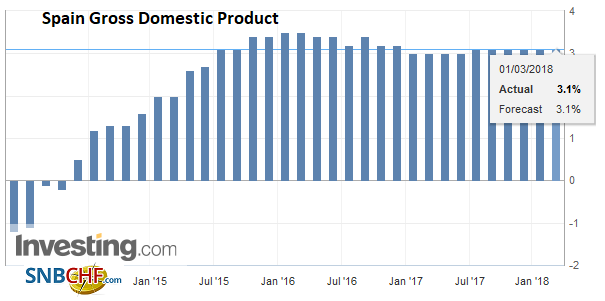 Source: Investing.com - Click to enlarge |
Spain Manufacturing Purchasing Managers Index (PMI), Apr 2013 - Mar 2018(see more posts on Spain Manufacturing PMI, )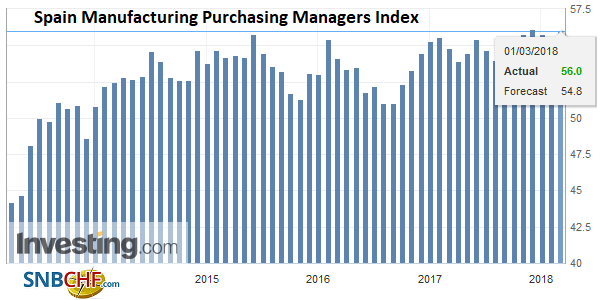 Source: Investing.com - Click to enlarge |
|
GermanyGerman manufacturing PMI was revised to 60.6 from the 60.3 flash reading. It was 61.1 in January and averaged 62.1 in Q4 17. |
Germany Manufacturing Purchasing Managers Index (PMI), Mar 2013 - 2018(see more posts on Germany Manufacturing PMI, ) Source: Investing.com - Click to enlarge |
FranceThe French manufacturing PMI was revised to 55.9 from 56.1. It was 58.4 in January and averaged 57.5 in Q4 17. |
France Manufacturing Purchasing Managers Index (PMI), Mar 2013 - 2018(see more posts on France Manufacturing PMI, )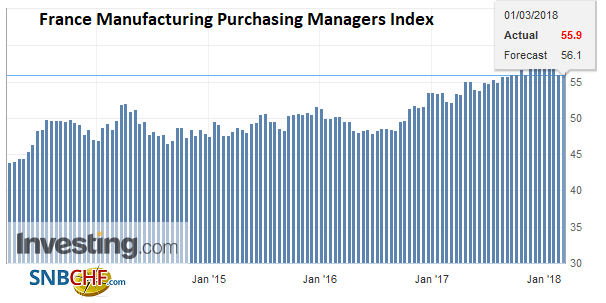 Source: Investing.com - Click to enlarge |
United KingdomAfter Nationwide reported that UK house prices rose 2.2% in February from a year ago, down from 1 3.2% pace in January, the Markit PMI for manufacturing held a pleasant surprise. It did not rise but it held in better than expected at 55.2 down from 55.3. Still, it is the third consecutive decline and compares with the 56.9 average in Q4 17 and 55.9 average for all last year. The December 2018 short-sterling futures implies a 1.3% yield. This is an eight basis point decline from the peak at the start of the week, but sterling’s chief challenge stems from the US dollar’s recovery and Brexit. |
U.K. Manufacturing Purchasing Managers Index (PMI), Apr 2013 - Mar 2018(see more posts on U.K. Manufacturing PMI, )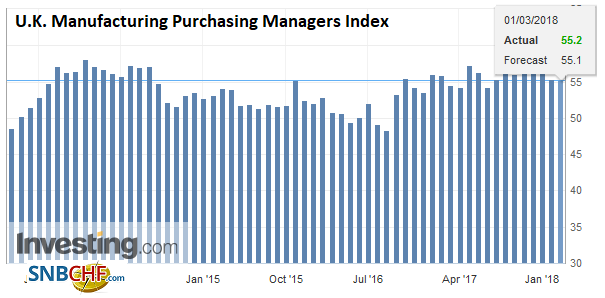 Source: Investing.com - Click to enlarge |
Japan |
Japan Manufacturing Purchasing Managers Index (PMI), Mar 2013 - 2018(see more posts on Japan Manufacturing PMI, )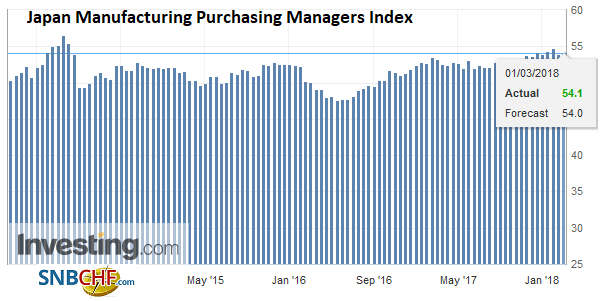 Source: Investing.com - Click to enlarge |
Japan Household Confidence, Mar 2013 - 2018 Source: Investing.com - Click to enlarge |
|
China |
China Caixin Manufacturing Purchasing Managers Index (PMI), Mar 2013 - 2018(see more posts on China Caixin Manufacturing PMI, )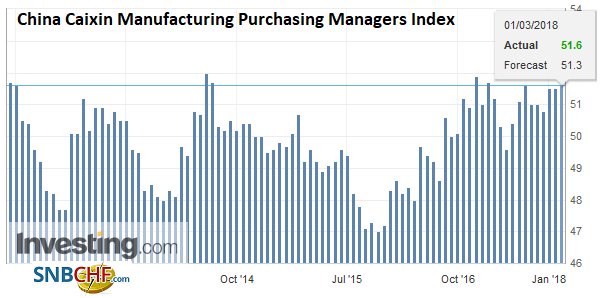 Source: Investing.com - Click to enlarge |
United Stattes |
U.S. Initial Jobless Claims, Mar 2013 - 2018(see more posts on U.S. Initial Jobless Claims, )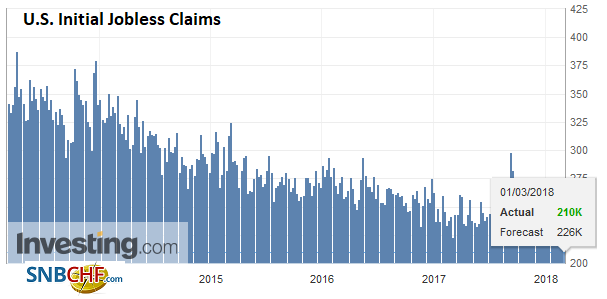 Source: Investing.com - Click to enlarge |
U.S. Personal Income, Mar 2013 - 2018(see more posts on U.S. Personal Income, )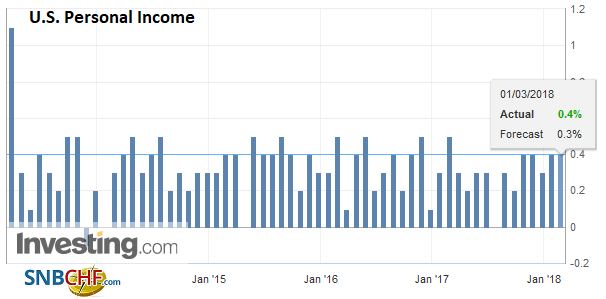 Source: Investing.com - Click to enlarge |
|
U.S. ISM Manufacturing Purchasing Managers Index (PMI), Apr 2013 - Mar 2018(see more posts on U.S. ISM Manufacturing PMI, )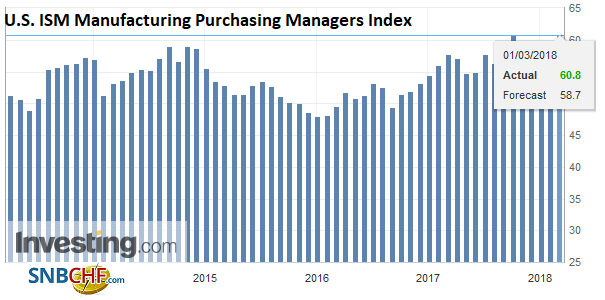 Source: Investing.com - Click to enlarge |
|
U.S. Manufacturing Purchasing Managers Index (PMI), Mar 2013 - 2018(see more posts on U.S. Manufacturing PMI, ) Source: Investing.com - Click to enlarge |
|
U.S. ISM Manufacturing Employment, Apr 2013 - Mar 2018(see more posts on U.S. ISM Manufacturing Employment, )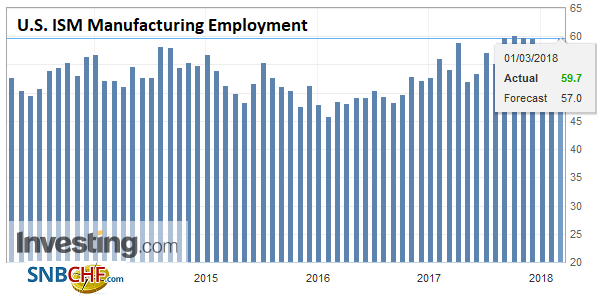 Source: Investing.com - Click to enlarge |
May speech tomorrow may have lost some of its thunder after ten Tory MPs reportedly will support an opposition amendment to a trade bill requiring the UK to stay in a customs union with the EU. This is the exact opposite of what the UK’s cabinet has supported. The EU’s draft treaty was really a worse case agreement, seemingly purposeful to provide additional pressure. As we have written about previously, the significance of the Irish border issue should not be underestimated in the negotiations.
Soft Australian data in the form of the manufacturing PMI (57.5 vs 58.7), soft house prices, and most importantly disappointing Q4 17 capex, sent the Australian dollar lower. Private capex fell 0.2%. The market had been looking an increase of around 1%. Mining was especially weak and not completely offset. We noted yesterday that the Aussie was one of three major currencies (CAD and SEK being the other two) there were below their 200-day moving averages. With today’s drop, the Australian dollar has punched through the 61.8% retracement of the rally that began in early December. That retracement is near $0.7745 and that may offer resistance now.
The focus in the US is four-fold. US stocks sold off hard late yesterday and the S&P 500 may gap lower today. We identified the 2690-2700 area is an important test. A break of it could see 2630-2660. The US personal income and consumption data are important data points for the economy in their own right, and especially given the big announcement of pay increases and bonus payments following the tax cuts. However, we are less sanguine and look for softer incomes and consumption in January after 0.4% increase in both in December. The Fed’s preferred inflation measure, core PCE deflator, is expected to be unchanged at 1.5%.
The third focus in Fed Chair Powell’s second leg of his testimony. The prepared remarks are the same. The questions are different. Many understood Powell to be more concerned about “overheating” economy and have now priced in three hikes. The odds of a fourth hike have increased. Investors will be keen to see if Powell says anything to give the impression that he was misunderstood.
Fourth, the US will reported announce the imposition of the tariffs on steel and aluminum on national security grounds that have been discussed over the past several months. While the aluminum foil and solar panel actions and pending intellectual property defense, are arguable aimed at China, the steel and aluminum are more broadly aimed. The WTO does allow protection of industries on national security grounds, but the area has not been robustly tested. There is little doubt the US action will see a WTO challenge. When the Commerce Department’s recommendation for tariffs was formally issued, the relevant industries saw equity price appreciation. Note, however, that whatever higher prices result will be a transfer from the consumers of steel and aluminum to the producers. Tariffs can also add to the upward pressure on prices.
Graphs and additional information on Swiss Franc by the snbchf team.
Are you the author?Tags: #GBP,#USD,$AUD,$EUR,$JPY,China Caixin Manufacturing PMI,EUR/CHF,Eurozone Manufacturing PMI,Eurozone Unemployment Rate,France Manufacturing PMI,Germany Manufacturing PMI,Italy Manufacturing PMI,Japan Manufacturing PMI,newslettersent,Spain Gross Domestic Product,Spain Manufacturing PMI,SPY,U.K. Manufacturing PMI,U.S. Initial Jobless Claims,U.S. ISM Manufacturing Employment,U.S. ISM Manufacturing PMI,U.S. Manufacturing PMI,U.S. Personal Income,USD/CHF