


George Dorgan
My articles My siteAbout meMy videosMy books
Follow on:LinkedINTwitterSeeking Alpha
CFA SocietyEconomicBlogs
Investors and ordinary people follow certain rational expectations – in its excessive form they are called “animal spirits”. During the sub-prime bubble the “animal” thinking was that real estate prices must always appreciate and that it is possible to spend based on this “artificial value”.
Joseph cycles – or “credit cycles” also recently called “financial cycles” – are closely connected with the behaviour of private investors and their rational expectations. The monetary theory of the business cycle in the tradition of Austrian economics holds that trade cycles result from excessive growth of circulating credit, which affects the real economy, leading to unsustainable investment projects that get corrected in a recession when credit contraction occurs.
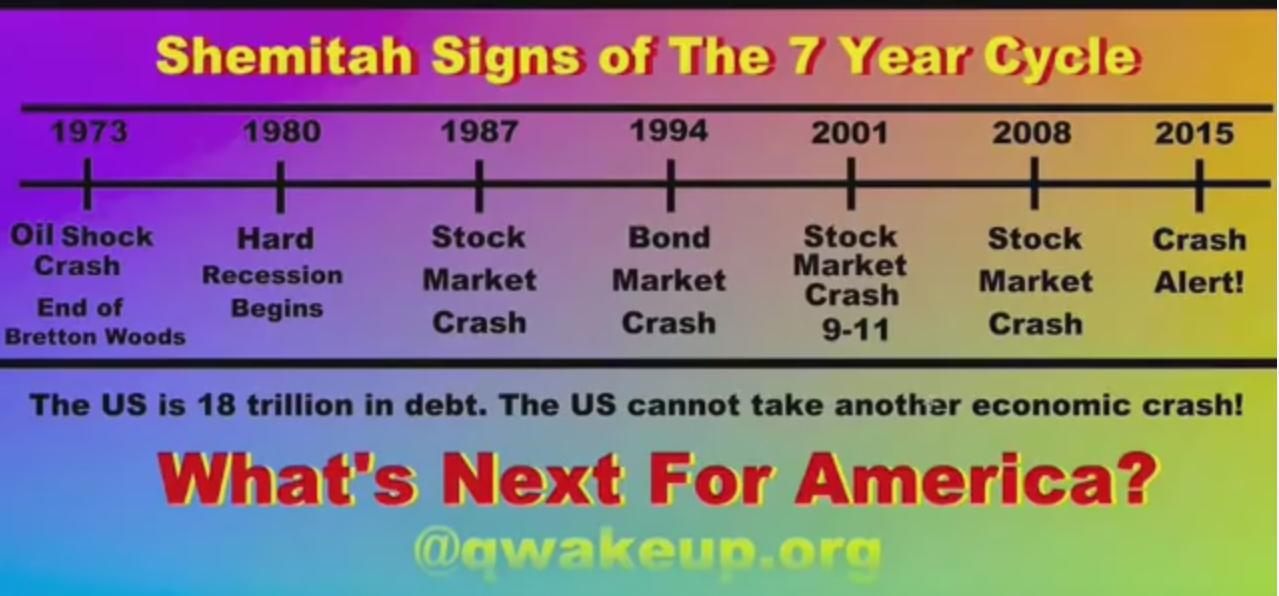
We describe the main Joseph/credit or financial cycles, that typically take around “biblical” 14 years:
- 7 good or “boom” years, when credit is easily available and the economy expands
- 7 bad or “bust” years, when credit is difficult to obtain (supply side) or there is less demand. The economy often contracts or slows considerably.
There is also the view that Joseph cycles correspond to a recession cycle that repeats every seven years.
Looking at the details of this definition of Joseph cycles, we see the following:
- The period after 1973 was driven by growth in Europe and Southern America and higher commodity prices, details here
—> It were seven boom years in Europe and Emerging Markets. While stagflation in the U.S. prevailed. - The period after 1980 was driven by high rates and strong growth in the U.S.
–> Seven boom years in the United States. While Emerging Markets, in particular Southern America, but also Germany had a crisis. - From a global perspective, the events in 1991/1992 – end of communism and the Japanese bust – were far more important than the 1994 bond market crash.
Financial Cycles
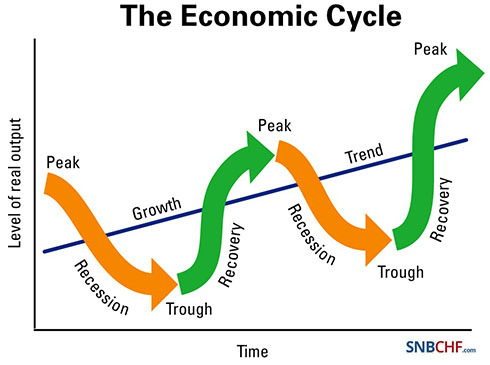
Financial cycles are often longer than a typical business cycle that relate more to the stock market and Fed tightening or easing.
Financial cycles are often concentrated on certain countries. Financial cycles often end with severe stress in the local banking system. Moreover, financial cycles are caused by the savings behaviour of the private sector. Some years of higher savings lead to a boom and strong private investments, often visible in real estate or stock market prices. Rapidly rising wages and spending, however, start the bust phase, even if it is initially hailed by markets.
Sometimes central banks may artificially cause a boom, in particular in a rich country that does not depend much on new private savings. One example is the housing boom phase in the United States.
The study of “financial cycles” is a mixture of classical economic theory and the reading of historical economic data on old financial cycles. The main aim is to avoid wrong investments; it is useful for both private investors, for political/economic leaders and in particular for FX trading.
The main protagonist of the study of “financial cycles” is Claudio Borio of the Bank of International Settlement (BIS) in Basel, Switzerland. We do not copy his texts here but we develop our own thinking and descriptions of the historic financial cycles that are still closely connected to his ideas.
Our chapters are:
Business Cycles, cycles often associated with stock markets that are typically shorter than financial cycles
The Background: Financial Cycles, Credit Cycles, Joseph Cycles
A bit theoretical background: Rational Expectations, Boom-Bust cycles and FX Rates
Financial Crises in Comparison, This Time is Different
According to our view, the financial cycles since 1945 were:
1945-1964: The Bretton Woods Boom and strong growth in Europe
We do not further break down this period; in most periods it was a boom phase in the U.S. and in Europe. The economic gap against the so-called “Third World” widened. We judge that fixed exchange rates under the lead of the United States were able to reduce effects of financial cycles.
1964-1971 Triffin Dilemma, high inflation expectations and the End of Bretton Woods
1971-1978 The U.S. Wage-Price-Spiral
1978-1985: The Oil Glut, the Strong Dollar and the starting “Lost Decade” in Latin America
1985-1992: The European and Japanese Asset Price Boom till the End of Communism
1997-2002: The Dotcom Boom and Bust and the Euro Creation Austerity as its Enabler
2002-2011: Boom of Emerging Markets and Commodities …. Once Again Enabled by US Trade Deficits and Easy Fed Money
The period can be subdivided into
2002-2007: Emerging Markets and Commodities Boom based on US and Southern European Trade Deficits
2008-2009: The short-lived so-called “Great Recession”
2009-2011: Emerging Markets Boom Continued, transforming in a Bubble thanks to Fed Easy Money
Thanks to cheap money from the Federal Reserve and heavy fiscal spending in China, the boom in the emerging markets continued, while spending in the U.S. and in Southern Europe significantly slowed.
2011-~2017: The Cycle of Global Debt Reduction and the Bust of Emerging Markets Growth
The following two chapters give more background about the maybe most interesting period, the 1970s:
1970s: “Cost-Push Inflation” Myth and the 1970s Stagflation


