



 by
by Lance Roberts
My articles My offerMy siteAbout meMy videosMy books
Follow on:TwitterSeeking AlphaFacebookAmazon

After three decades of watching market cycles play out from both sides of the trade, I've come to a simple conclusion: Wall Street's love of simple rules is one of the most dangerous aspects of investing. When stocks fall 10%, it's just a "correction." However, if they decline 20%, it's a "bear market." Simple, clean, repeatable, and printed on every financial media graphic from here to Tokyo. The problem is that the definitions of a correction and bear market have not been updated since Alan Shaw developed them at Smith Barney in the 1960s. Moreover, the market those definitions were designed to describe no longer exists.
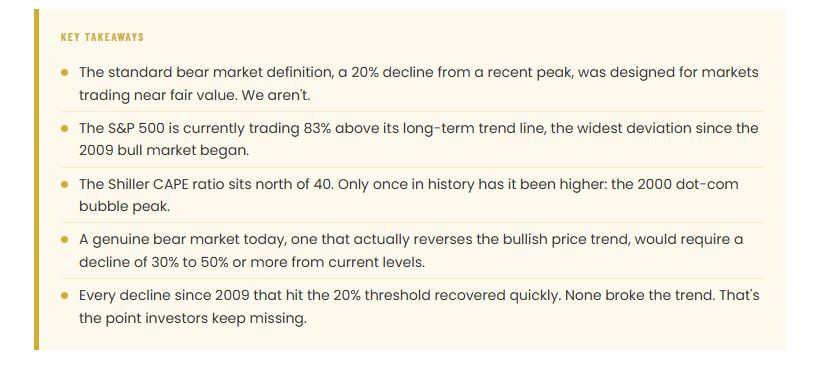
Currently, the S&P 500 index is roughly 83% above its long-term trend line, with the Shiller CAPE (cyclically adjusted price-to-earnings ratio) hovering near 40. That valuation level was only exceeded once in the history of American financial markets. The Fed's balance sheet, still at $6.7 trillion, is more than eight times its pre-2008 level. Under these conditions, the old bear-market definition no longer measures what it was built to measure. A 20% decline from here doesn't signal either a regime or price trend change. In other words, it would be only a "correction" within an ongoing bullish trend. That understanding is key to today's discussion.

The Current Bear Market Definition Is Arbitrary
As noted, the "20% rule" traces to Alan Shaw, a technical analyst at Smith Barney in the mid-20th century. His framework was simple. Anything up to 10% was noise. A decline of 10% to 20% was a correction. Anything beyond 20% was a bear market. Shaw's colleague Louise Yamada, who took over Smith Barney's technical analysis practice in 2000, later described its staying power with characteristic directness: "It's just so easy and simple to remember."
Shaw's framework made sense in its time. Markets in those decades lived much closer to a gravitational center of fair value. When prices fell by 20%, they often broke the market's longer-term trend. A decline of that magnitude carried real information. It told you that selling pressure had overwhelmed buying, the market's price trend had reversed, and the market's direction of travel had changed from up to down. That's precisely what the bear market definition was supposed to capture. A change in regime, not just a number.
The question is: after a 17-year-long bull market that stretched prices well beyond long-term trends, is Mr. Shaw's measure still valid?
To answer that question, let’s clarify the premise.
- A bull market is when the market price is trending higher over a long-term period.
- A bear market is when the previous advance breaks, and prices begin to trend lower.
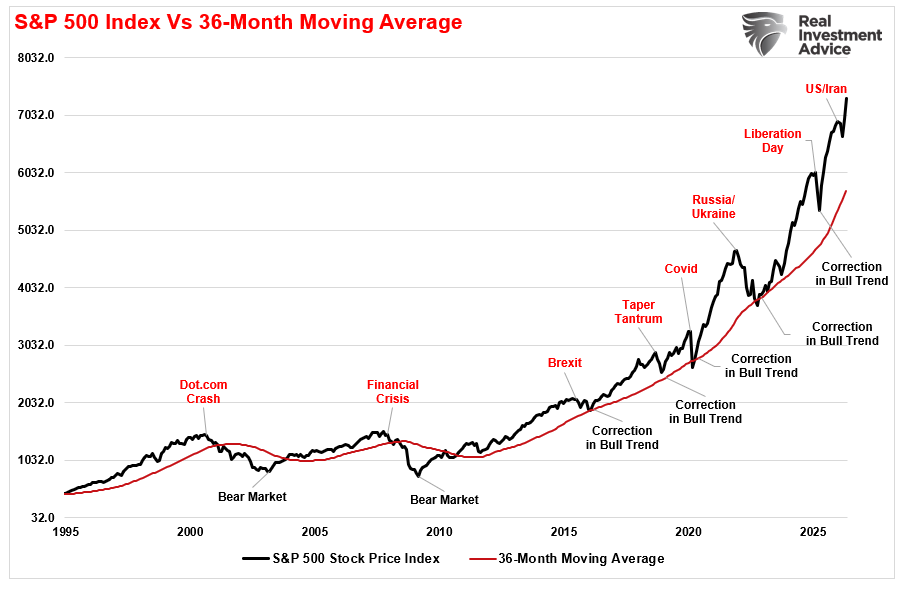
The chart below provides a visual of the distinction. When you look at price “trends,” the difference becomes both apparent and useful.
The distinction is essential.
- “Corrections” generally occur over short time frames, do not break the prevailing trend in prices, and are quickly resolved by markets reversing to new highs.
- “Bear Markets” tend to be longer-term affairs in which prices grind sideways or lower over several months as valuations revert.
What a Real Bear Market Actually Looks Like
The two genuine bear markets of this century make the definition's original intent clear. Between March 2000 and October 2002, the S&P 500 lost nearly 49% of its value. It didn't recover to its prior peak until 2007. Seven years lost. The bullish trend didn't pause; it broke, and investors who sat through it got years of negative real returns with no policy rescue from Washington or the Fed.
The 2008 crisis was worse. From October 2007 to March 2009, the S&P fell about 57%. It didn't return to its prior highs until early 2013. The price structure didn't just dip below an arbitrary threshold. It collapsed, stayed down for years, and required one of the most aggressive monetary policy responses in the Fed's history to eventually stabilize. That's a bear market in the original sense of the word. A sustained, structural reversal of the prior bullish trend.
Now compare that to 2022. The S&P peaked on January 3 of that year, fell 25.4% to its October trough, and technically satisfied every condition of a bear market under the standard definition. By July 2023, every point of that decline had been recovered. By early 2024, the index was making new all-time highs. The 2022 decline was painful, but it did not reverse the underlying trend. Yes, prices fell, but found support well above any reasonable measure of long-term fair value, and resumed their climb. Putting the 2022 episode in the same category as 2000 or 2008 doesn't just mislead investors; it tells the story exactly backward.


How the Fed Rewired the Market
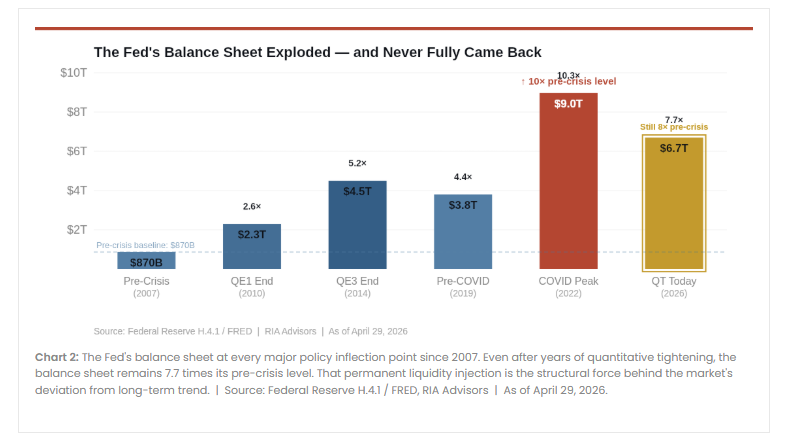
To understand why the bear market definition needs to be revised, you have to reckon honestly with what the Federal Reserve has done to the market's structural foundation. Before the 2008 financial crisis, the Fed's balance sheet sat at roughly $800 billion. Modest. Stable. Largely inconsequential to equity prices on any given day.
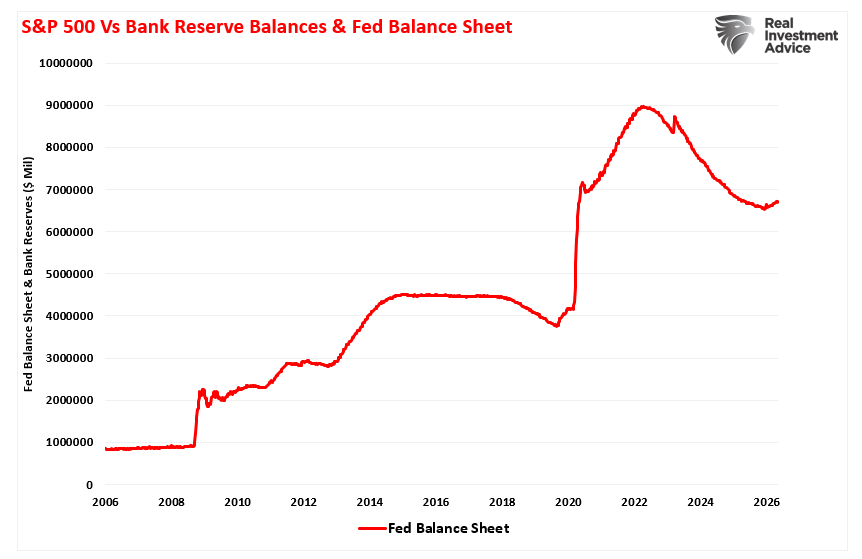
Then came the crisis. The Fed launched three rounds of quantitative easing between 2009 and 2014, pushing its balance sheet to roughly $4.5 trillion. It tried to normalize beginning in 2018, then COVID hit. In two years, the balance sheet more than doubled again, from $4.3 trillion to nearly $9 trillion. As of April, 2026, it still sits at $6.7 trillion, even after years of several years of quantitative tightening.
That liquidity didn't evaporate. It repriced every financial asset upward. It suppressed yields, starved investors of income alternatives, and effectively forced capital into equities regardless of underlying valuation. The market didn't reach these levels because corporate America suddenly became dramatically more profitable. It reached them because the price of money was artificially held low for over a decade, which changed the math in every valuation model investors use. The result is a market structure with no historical precedent for its distance from the long-term trend.
What the P/Es Actually Tell You
The more bearish crowd consistently points to the Shiller CAPE ratio as a measure of impending doom. However, investors should understand that the CAPE ratio measures the market's current price relative to 10 years of inflation-adjusted earnings. At 40, investors are currently paying 40 times that earnings figure for every dollar of S&P 500 exposure. That's a lot by any historical measure, considering the historical median is 16x. The bear's argument, and rightly so, is that the market has traded above 40 on the CAPE ratio only once before in its history, and that was at the dot-com peak. We know how that ended.
But this is important, as we have discussed many times, the problem is that valuation measures are just that – a measure of current valuation. More importantly, when valuations are excessive, it is a better measure of “investor psychology” and the manifestation of the “greater fool theory.”
Notably, valuation models are not, and were never meant to be, “market timing indicators.” There are many articles penned suggesting that if a measure of valuation (P/E, P/S, P/B, etc.) reaches some specific level, it means that:
- The market is about to crash, and
- Investors should be in 100% cash.
Such is incorrect.
What valuations provide is a reasonable estimate of long-term investment returns. It is logical that if you overpay for a stream of future cash flows today, your future return will be low. We can see this evidence by comparing the 10-year total return of a $1000 investment in the stock market to Shiller’s CAPE ratio, as noted above.

However, here's where it gets interesting. Even if you don't use the long-term median as your target, the math of mean reversion is sobering at any reasonable level. At the time of this writing, we can map each scenario from the S&P close of 7,399 (May 10, 2026), and the picture becomes clear.
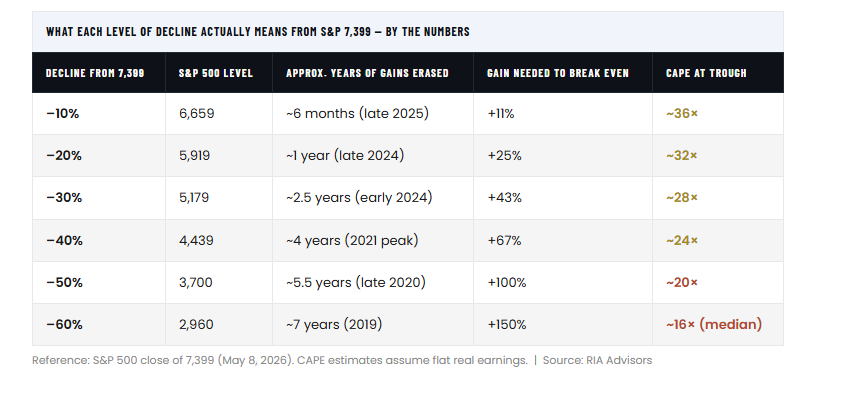
Notice what that table shows. A 20% decline from current levels leaves the market at roughly 32x cyclically adjusted earnings. That's twice the historical median. The market doesn't even begin to approach a valuation floor that has historically supported the start of a new secular bull market until you're down 50% to 60% from here.
That's not a prediction; that's arithmetic, and the difference between a correction and a bear market in today's financial markets.
The recovery math compounds the problem. A 30% loss requires a 43% gain just to break even, before accounting for the time lost while recovering. A 50% loss demands a full 100% return to get back to where you started. For investors in or near retirement, that's not a temporary setback. That's a structural threat to financial security.
"A 20% decline from a market that's 83% above trend doesn't reach trend. It barely dents the excess. The old bear market definition was built for a different world, and that world no longer exists."

Two Halves To A Full Cycle
I wrote about this in August 2020, right after the COVID crash had recovered, and everyone was declaring it the shortest bear market in history. My argument then was the same one I'm making now: March 2020 was a correction, not a bear market, because it never broke the long-term bullish price trend that started in 2009. The same is true of 2022. And of the Iran-related correction we saw in early 2026. Those were all pressure releases within an ongoing bull market. None of them completed the cycle.
Because that's the part Wall Street glosses over. Every bull market is only half of a full market cycle. The second half, the bear, is when the excesses accumulated during the upswing, the overvaluation, the leverage, the speculative positioning, get wrung out through a sustained decline that resets prices back toward fundamental value. That process has played out after every major bull market in the historical record. From the 1929 collapse to the 1970s grind, the dot-com bust, and the financial crisis. None of them was optional; they were just the structural corrections of prior excesses.
The bull market that started at S&P 683 in March 2009 is now 17 years old. It's the longest on record and has been sustained by:
- Three rounds of QE,
- A zero-interest rate policy for most of a decade,
- $5 trillion in pandemic stimulus, and
- A generational AI investment cycle that's still in its early innings.
All of that is real. But none of it changes the underlying valuation math, and eventually, prices will reflect fundamentals. They always do. The problem for investors, however, isn't whether a real bear market will happen; it's when, and more practically, whether your portfolio is built to survive the transition.
As noted, the 2020 and 2022 declines share one critical feature: both recovered before prices touched the long-term trend line shown above. They were corrections in an ongoing bullish trend, and both required a significant Fed or fiscal response to stabilize. A genuine bear market, one that resets valuations toward historical norms, would require neither a quick recovery nor a policy rescue. It would require a decline large enough to reach that trend line.
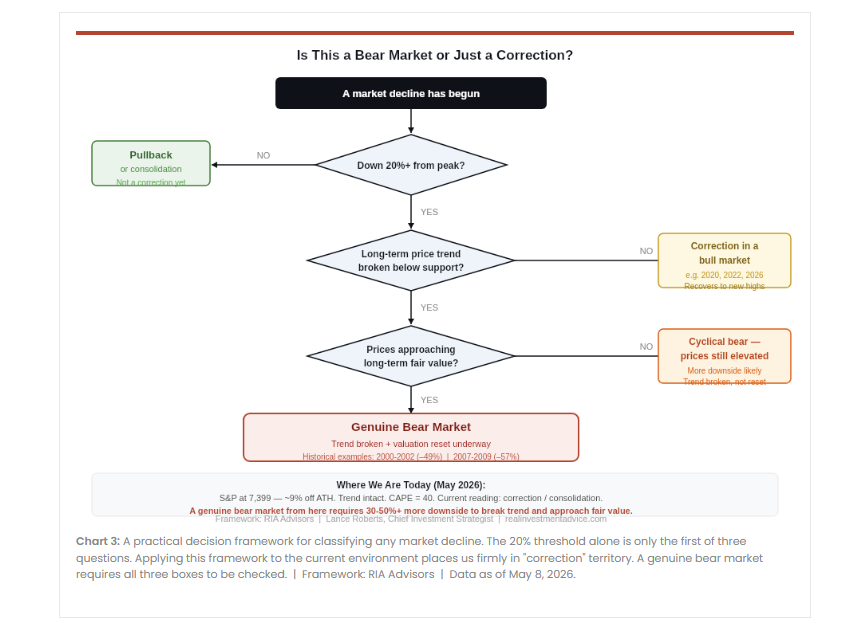
The bottom line is that the 20% threshold isn't wrong. It's just not calibrated for a market that's trading 83% above its long-term trend. In a world where markets lived near fair value, a 20% decline carried information about the trend. Today, it carries sentiment information. That's a meaningful difference, and it changes how you should think about both potential corrections and portfolio risk.
Stop anchoring your risk budget to the 20% number.
The relevant question isn't "how far has this fallen?" It's "how far is this from where prices would need to be for the bull market trend to genuinely reverse?"
Right now, that gap is enormous. A real bear market, in the structural sense, would likely need to be a 30% to 50% decline, and possibly deeper, before prices would reach the kind of valuation support that has historically ended bear markets and started new secular bulls.
That doesn't mean panic. It means position sizing, risk management, and stop-loss disciplines need to account for a potential drawdown far larger than the 20% threshold Wall Street treats as the danger zone.
We continue to suggest that investors maintain appropriate hedges, keep risk allocations proportional to their time horizon and income needs, and resist the "buy the dip" impulse when the dip doesn't actually bring you closer to value.
Make no mistake, the trend is still up. The AI investment cycle is real, earnings are growing, and the tape remains technically constructive at current levels. But the distance between current prices and genuine long-term fair value is wider today than at any point outside the dot-com peak. That's not a reason to be out of the market. It is a reason to know exactly what you own, why you own it, and what your exit plan looks like if the second half of this cycle finally arrives.
The post Corrections vs. Bear Markets: Why 20% Declines Are Obsolete appeared first on RIA.
Full story here Are you the author?You Might Also Like
 Buffett Cash Hoard: Why $397 Billion Sits On The Sidelines
2026-05-18
$397 billion. That’s how much “Buffett cash” now sits on Berkshire Hathaway’s balance sheet after Greg Abel’s first quarter as CEO. Warren Buffett left $373 billion behind when he stepped down at the end of 2025. Three months later, after Abel’s debut earnings report on Saturday, the hoard had grown by another $24 billion. The figure …
 Market Correction Risk: Why Summer 2026 Looks Risky
2026-05-04
Collapsing breadth. Stretched positioning. The worst seasonal window of the year. The worst year of the political cycle. And a war that won’t end. Market correction risk is stacking up. The S&P 500 hit a fresh record high last week. The median stock in the index is sitting 13% below its 52-week peak. That divergence is …
 S&P 500 Outlook: The 8.2% Rally & What Comes Next.
2026-04-13
Over the last few weeks, we have published real-time market commentary as the correction proceeded. The goal was to help investors navigate the more dire outcomes promoted on social media. A largely unexpected outcome was that the S&P 500 outlook changed dramatically in a matter of days. After five consecutive weeks of decline driven by …
 Treasury Bond Yields Don’t Lie: But Wars Don’t Drive Them
2026-03-16
This past weekend, Adam Taggart and I discussed what happens to Treasury bond yields when the United States enters a military conflict. The conventional wisdom is reflexive and tidy. A conflict triggers a flight to safety, money floods into U.S. government bonds, and yields fall. It’s a clean narrative. Unfortunately, it is wrong more than …
 SaaS: Is There Opportunity In The Destruction?
2026-03-02
A specter is haunting Wall Street—the specter of the “SaaSpocalypse.” Since the iShares Expanded Tech-Software Sector ETF (IGV) peaked on September 19, 2025, it has fallen roughly 30%. For context, the broad technology indexes like XLK and QQQ are essentially flat over the same period, and the semiconductor ETF (SMH) is up 30%. Between mid-January …
 Speculative Narrative Unwinds
2026-02-09
For nearly two years, markets were driven by the same speculative narrative that “this time is different.” Bitcoin, precious metals, and AI-linked equities rose not only because of robust fundamentals, but also because investors clung to powerful narratives about inflation, disruption, and monetary collapse. Those speculative narratives are not only seductive but also contribute to …
 The South Park Market Of 2026
2026-01-23
I have been a “South Park” fan for as long as I can remember, and while the show isn’t a market guidebook, its brutal satire cuts through nonsense better than many Wall Street commentaries. Just like on the show, characters make absurd decisions and face absurd consequences, which is familiar to investors today. For example, …
Tags: Bear Market,Featured,Investing,Lance Roberts,newsletter,recession,S&P 500,Technical Analysis