Marc Chandler
My articles My offerMy siteAbout meMy videosMy books
Follow on:LinkedINTwitterSeeking AlphaAmazon
Swiss FrancThe Euro has fallen by 0.19% to 1.1504 CHF. |
EUR/CHF and USD/CHF, February 28(see more posts on EUR/CHF, USD/CHF, ) Source: markets.ft.com - Click to enlarge |
FX RatesMany market participants think they heard Fed Chair Powell give a fairly strong signal that he favored a more aggressive course. The implied yield on the December Eurodollar futures rose five basis points to 1.535%. The December Fed funds futures contract rose three basis points. The market moved not to pricing in a fourth hike this year, but to fully price in the third hike, which the December dot plots implied. A third hike would bring the effective Fed funds rate to 2.17% and the implied yield of the January 2019 Fed funds futures contract is 2.155%. It took Powell’s apparent comfort with a more aggressive path to convince the market of something the Fed’s dot plot indicated more than two months ago. We do not think that Powell will be pleased with the market’s reaction. It seemed to misconstrue. He prefaced his comment by saying he did not want to prejudge the FOMC, but that his personal outlook for the economy had strengthened. This is important. What strengthened? Powell’s outlook. What does that mean? We think it means that he is more confident that the Fed is on course to reach its mandated objectives. We continue to believe that the superior strategy here is not to change the dot plot to four hikes this year. The anti-inflation credibility of the Powell Fed will already be bolstered by a hike at his first meeting as Chair. The Fed need not signal its intention to hike more aggressively. By the June FOMC meeting, the trajectory of prices and the economy will be clearer. Ironically, a couple of hours before Powell testified, data were reported that prompted economists to revise down Q1 18 GDP forecasts. Taking the recent softness in housing starts into account as well, the Atlanta Fed GDP Now tracker lowered its estimate to 2.6% down from 3.2% on February 16. It began the month near 5.4%. It is the lowest estimate in four months. |
FX Daily Rates, February 28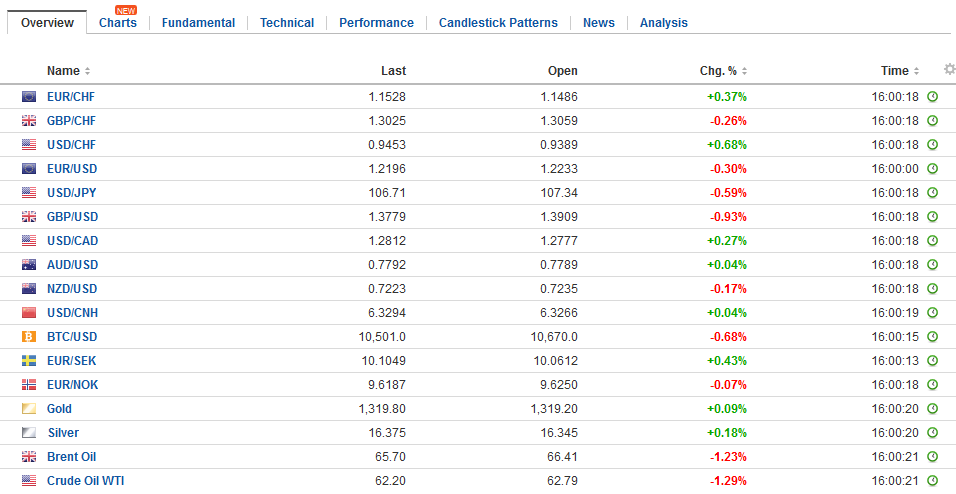 - Click to enlarge |
| The US dollar is mostly steady to firmer. The Canadian and Australian dollars join the yen in resisting the dollar’s pull. Of note, the Australian dollar, which has lost its interest rate advantage over the US, has found support at its 200-day moving average (~$0.7785). The Aussie has only marred this moving average since moving back above it a little before Christmas. The US dollar closed decisively above its 200-day moving average against the Canadian dollar yesterday for the first time since last June.
Today, for the first time since mid-December, the US dollar is also rising above its 200-day moving average against the Swedish krona. That average today is found a just below SEK8.25. Softer than expected inflation data earlier this month go the ball rolling. Today’s data showed softer than expected, though still solid Q4 17 GDP (0.9% rather than 1.0%) and softer January retail sales (0.1% vs. 0.4% expected). Sterling is at the lower end of yesterday’s ranges. The market is awaiting political theater later today when the EC releases its draft Brexit proposal, which apparently ignores some of UK’s positions, which May be expected to reject in a much-anticipated speech on Friday. The euro extended yesterday’s losses. A convincing break of $1.2200 is needed to signal the next leg down for the euro. If it holds, short-term participants may conclude it is the bottom end of the new range. |
FX Performance, February 28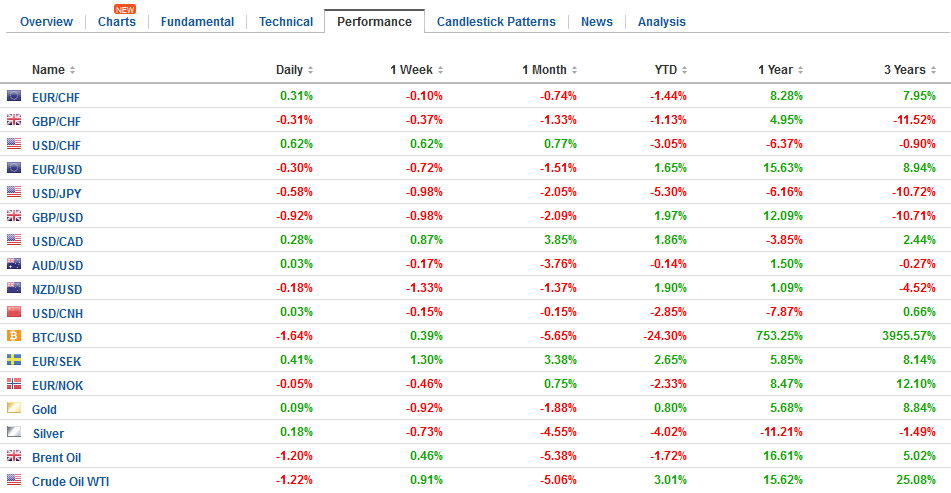 - Click to enlarge |
EurozonePrice pressures remain steady. Today the preliminary estimate of February CPI was reported at 1.2%, in line with expectations, down from 1.3% in January. Last February headline eurozone inflation reached 2.0%. |
Eurozone Consumer Price Index (CPI) YoY, Mar 2013 - Feb 2018(see more posts on Eurozone Consumer Price Index, )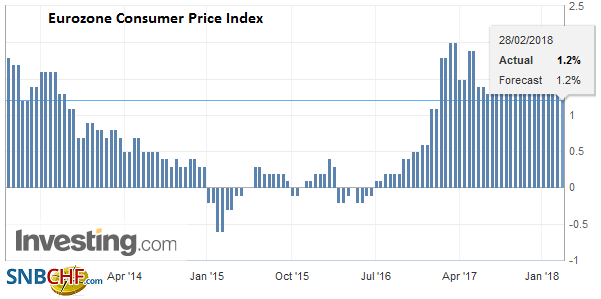 Source: Investing.com - Click to enlarge |
| The core rate was steady at 1.0%. It was steady at 0.9% throughout Q4 17, which is also where it was in February 2017. Progress? |
Eurozone Core Consumer Price Index (CPI) YoY, Mar 2013 - Feb 2018(see more posts on Eurozone Core Consumer Price Index, )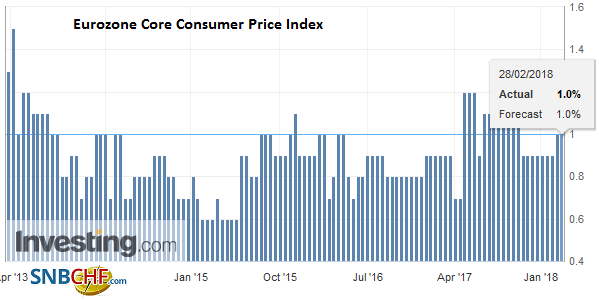 Source: Investing.com - Click to enlarge |
GermanyTo be sure, it is not just in the US that the synchronized global recovery has met the New Year. Surveys and sentiment indicators in the euro area warn that economic momentum may have peaked. One exception to a string of mostly softer than expected reports was the February German employment data released today. Unemployment fell more than expected, with the unemployment queues shrinking by 22k instead of the 22k the median in the Bloomberg survey expected. Unemployment fell by an average of almost 16k a month in 2017. The three-month average now stands at a -25.3k, the most since April 2011. |
Germany Unemployment Rate, Mar 2013 - Feb 2018(see more posts on Germany Unemployment Rate, )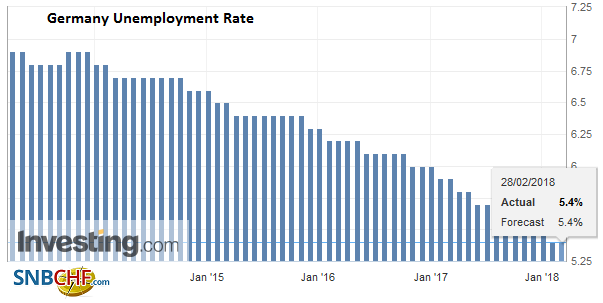 Source: Investing.com - Click to enlarge |
JapanThe Japanese economy practically stagnated in the last three months of 2017. It has begun the new year on weak footing. Consider January retail sales. The 1.8% drop in the month was three-times more than expected and is worth six-month of sales at the average monthly gain in 2017 (0.3%). Industrial output slumped 6.6% in January. It is the largest decline since 2011. The market had expected around a 4% fall after December’s 2.9% gain. |
Japan Retail Sales YoY, Mar 2013 - Feb 2018(see more posts on Japan Retail Sales, )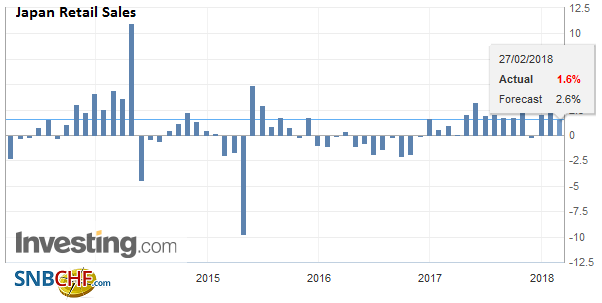 Source: Investing.com - Click to enlarge |
ChinaChina disappointed as well. The official February PMI readings were weaker than expected. The manufacturing PMI eased to 50.3 from 51.3 and new export orders fell for the second month in a row. Factory employment declined for a fourth month (48.1). |
China Manufacturing PMI, Mar 2013 - Feb 2018(see more posts on China Manufacturing PMI, )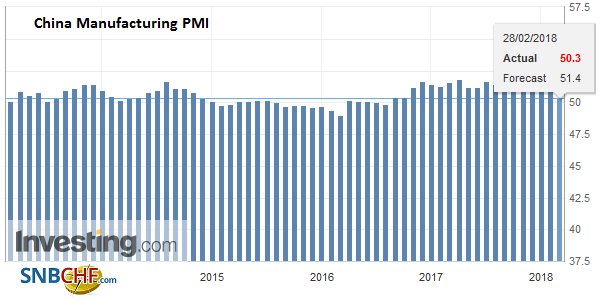 Source: Investing.com - Click to enlarge |
| The non-manufacturing PMI slipped to 54.4 from 55.3. The result is a composite reading of 52.9 (from 54.6) which is below last year’s lows. Small businesses were especially weak and this warns of downside risk to the Caixin PMI due out on Thursday in China. While it is tempting to dismiss the weakness due to the Lunar New Year, we suggest the holiday exaggerated some trends that are already in place.
Just as China announced it was sending a high placed economic adviser for President Xi to the United States, the US Commerce Department charged Chinese aluminum foil makers with getting unfair subsidies and dumping their product in the US. This is separate from the pending decision on aluminum and steel on national security grounds. The Commerce Department wants to charge duties for both the dumping and to offset the unfair subsidies. The US imported about $390 mln of aluminum foil in 2016 from China, according to reports. In an unusual step, it was the government that reportedly led this charge rather than industry, though domestic producers have complained about Chinese competition. |
China Non-Manufacturing PMI, Mar 2013 - Feb 2018(see more posts on China Non-Manufacturing PMI, )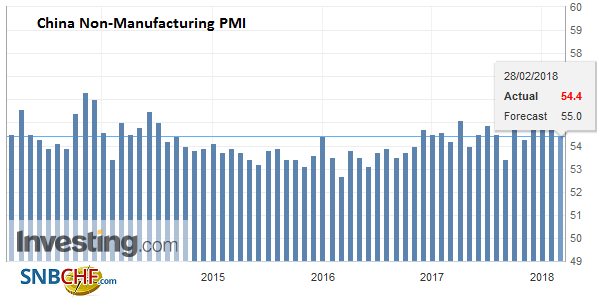 Source: Investing.com - Click to enlarge |
United StatesThe US will likely report a small downward revision in Q4 17 GDP (2.5% from 2.6%), largely because consumption was slower than initially reported. Still, the report is too historical to matter much. The S&P 500 recorded an outside day yesterday, trading on both sides of the previous day’s range, and finishing below the low recorded then. In addition, it closed below the gap created by Monday’s higher opening. It held the 50% retracement (~2743.45) of the gains from last week’s highs. Below there is the five-day moving average near 2735.3 and the next retracement target is near 2732.7. A break of these levels suggests a test on more important support in the 2697-2700 area. A slightly higher opening is currently expected. |
U.S. Gross Domestic Product (GDP) Q4 2017, Mar 2013 - Feb 2018(see more posts on U.S. Gross Domestic Product, )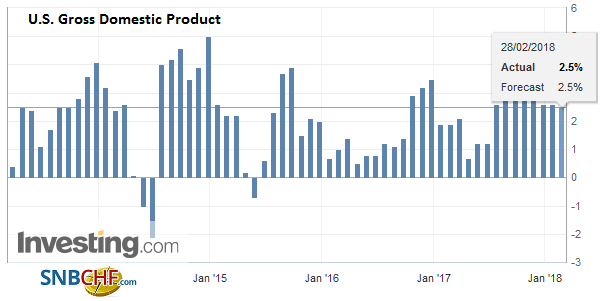 Source: Investing.com - Click to enlarge |
| The Chicago PMI for February is expected to be consistent with the early February data of an economy steady at elevated levels. However, given the losses in the US stock market yesterday, it may be the main focus today for other markets. |
U.S. Chicago PMI, Mar 2013 - Feb 2018(see more posts on U.S. Chicago PMI, )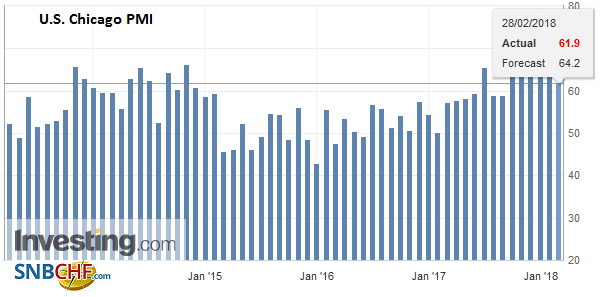 Source: Investing.com - Click to enlarge |
While Asian shares took the US slide hard, European bourses are only marginally lower. The MSCI Asia Pacific Index was off 1%. It is the biggest decline in three weeks. Europe’s Dow Jones Stoxx 600 is off 0.2%, a sliver more than yesterday.
Ten-year benchmark yields are around a single basis point lower today, while US 10-year yields are stead just below 2.9%. Japan’s 10-year yield settle a basis point higher, though very long-end of the curve held in better after the BOJ reduced the amount of bonds 25-years and longer than it would but to JPY70 bln from JPY80 bln. The BOJ has cautioned against reading policy signals in the fewer bonds being purchased. The Yield Curve Control policy and the smaller float means the BOJ can buy few bonds to implement its strategy. Nevertheless, the yen strengthened on the news.
Graphs and additional information on Swiss Franc by the snbchf team.
Full story here Are you the author?Tags: #GBP,#USD,$AUD,$CAD,$EUR,$JPY,$TLT,China Manufacturing PMI,China Non-Manufacturing PMI,EUR/CHF,Eurozone Consumer Price Index,Eurozone Core Consumer Price Index,Germany Unemployment Rate,Japan Retail Sales,newslettersent,SEK,U.S. Chicago PMI,U.S. Gross Domestic Product,USD/CHF