Swiss FrancThe Euro has fallen by 0.19% to 1.0755 |
EUR/CHF and USD/CHF, September 15(see more posts on EUR/CHF, USD/CHF, )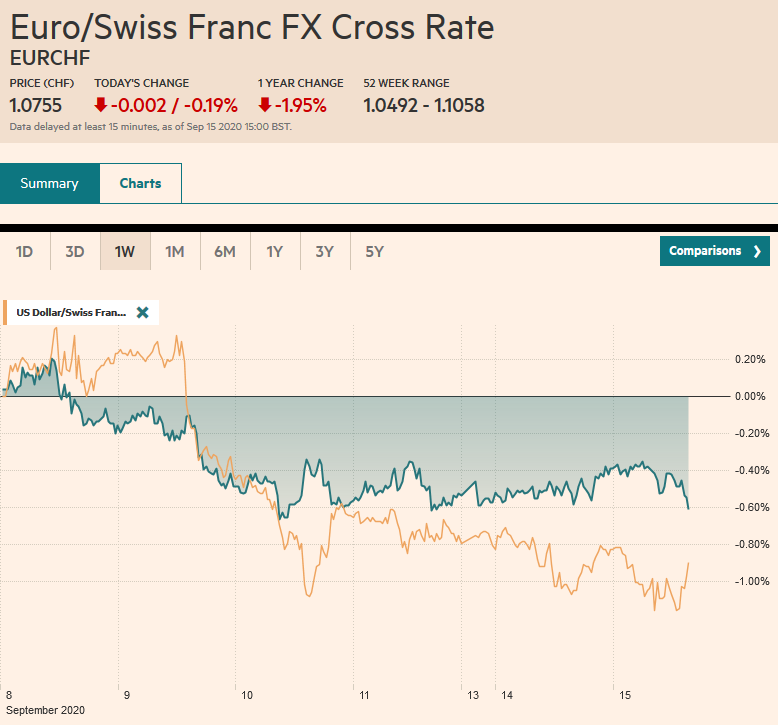 Source: markets.ft.com - Click to enlarge |
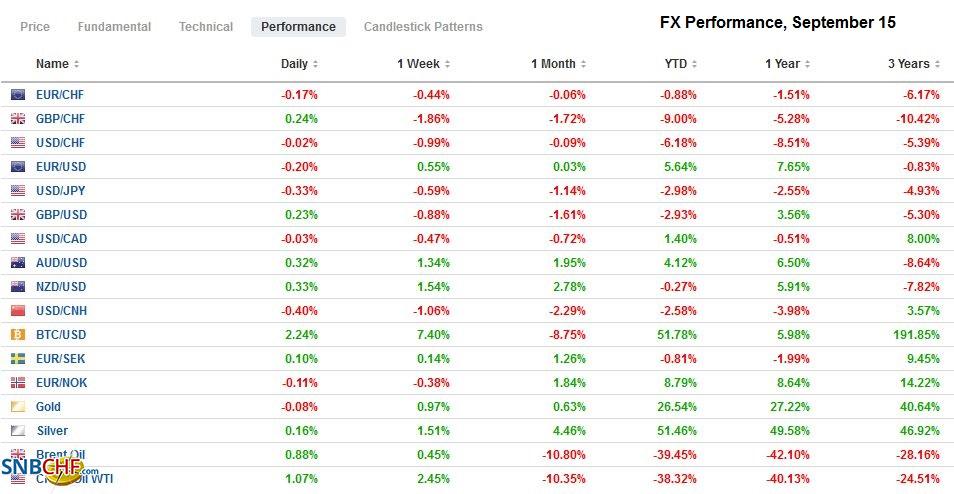
FX RatesOverview: The capital markets are relatively quiet so far today as the FOMC meeting gets underway. Equity markets in the Asia Pacific region, but Japan and Australia advanced, and the regional benchmark rose for the fourth consecutive session. European stocks are a little firmer. The three-day advance has lifted the Dow Jones Stoxx 600 by about 1.0%. US shares are trading higher, and the S&P 500 is poised to gap higher. Benchmark 10-year yields 1-2 bp higher in Europe, and the US 10-year is little changed near 68 bp. The dollar is heavy. The euro traded at $1.19, and the dollar has been unable to resurface above JPY106. The greenback is also slipping against most of the emerging market currencies. Gold is extended yesterday’s recovery but is just above the middle of the $1900-$2000 range for the better part of the past month. Oil is firm, but the October WTI contract remains within the range established a week ago (~$36.15-$38.45). |
FX Performance, September 15 |
Asia PacificChina reported better than expected industrial production and retail sales data. August industrial output rose 5.6% from a year ago. The median forecast in the Bloomberg survey was for a 5.2% increase following the 4.8% advance in July. Of note, crude steel output rose 8.4% year-over-year, while aluminum production increased by 5.5%. |
China Industrial Production YoY, August 2020(see more posts on China Industrial Production, )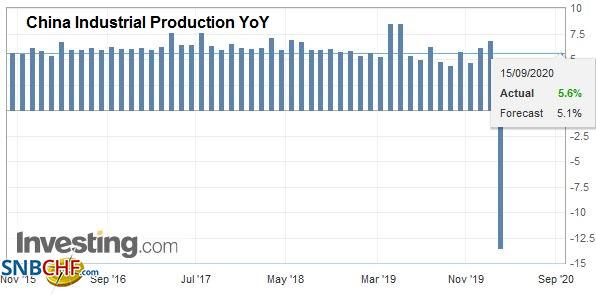 Source: investing.com - Click to enlarge |
| Retail sales were expected to be flat after falling for the past several months. Instead, it rose by 0.5%, year-over-year. While this is a step in the direction of more balanced growth, Beijing’s policies still seem to favor supply over demand. |
China Retail Sales YoY, August 2020(see more posts on China Retail Sales, )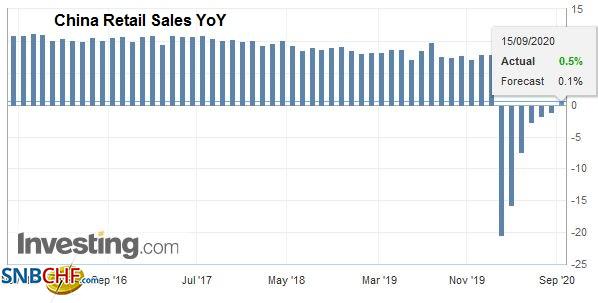 Source: investing.com - Click to enlarge |
| Lastly, China reported fixed asset investment, and at -0.4%, it was in line with forecasts and shows sequential improvement. The takeaway is that the world’s second-largest economy is continuing to recover. |
China Fixed Asset Investment YoY, August 2020(see more posts on China Fixed Asset Investment, )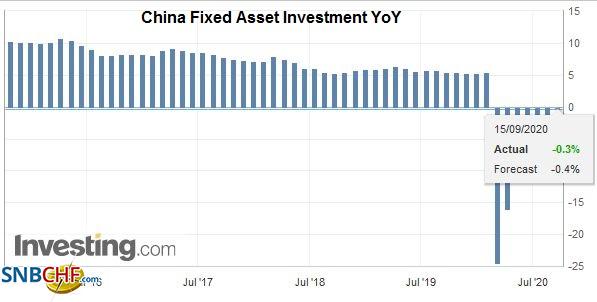 Source: investing.com - Click to enlarge |
Japan joined South Korea and China to ban German pork entirely. Germany is trying to persuade them to replace the total ban with a regional one. Japan’s ban makes China’s move not necessarily as political or impolitic as it may have appeared. China and the EU paid lip service to ideas that the seven-year-old investment pact negotiations can be successfully concluded this year. However, relations are at a low ebb, and China’s recent effort to bolster the role of State-Owned-Enterprises goes in the opposite direction that the EU is pushing. That said, the US-China Phase 1 trade agreement, including a few dozen specific market-opening measures, and China appears to be implementing these.
The dollar is in a narrow 20-tick range against the Japanese yen through the European morning (~JPY105.60-JPY105.80). Expiring options suggests the greenback may struggle to resurface above JPY106 today with $1.6 bln in options struck between JPY105.95 and JPY106.00. On the downside, JPY105 seems too far away, and it is protected today by a $1.1 bln option that will roll-off today. The Australian dollar is firm, near its best levels in two weeks, and trying to re-establish a foothold above $0.7300 and was perhaps encouraged by the reiteration of the RBA’s assessment that the Aussie is fairly valued. It has frayed resistance near $0.7330, and a close above it could signal another try at the $0.7400 level seen on September 1. Meanwhile, the greenback continues to fall against the Chinese yuan. Today’s 0.5% decline is the most in six-months. The dollar gapped lower and fell to about CNY6.7730, making the yuan the strongest in the emerging market universe today. It is at its best level since May 2019. The PBOC also appeared generous in its money market operations, injecting CNY600 bln via the one-year MLF.
Europe
The Internal Market bill passed the first reading yesterday handily (340-263) despite the lambasting by several high profile Conservatives. Only two Tories voted against the bill and several abstained. There may be further rebellions in the next two readings. If it passes the next two readings, which seems likely, it will go to the House of Lords. The unelected upper chamber can stall and delay, but it is next to impossible for it to stop a bill that is approved by the House of Commons.
| The EU is striking back. In retaliation for the move to renege on the Withdrawal Agreement, the EU has postponed a decision that had been expected tomorrow on allowing UK institutions to continue to clear euro transactions for EU-based clients. It was generally assumed that Brussels was going to let some transition period so as not to disrupt the markets. Still, over time, there is little doubt that it wanted a premier capital center on the Continent. A decision is needed by the end of the month as the largest clearer LCH reportedly must notify its clients if the swap book is to move from the UK. |
Eurozone ZEW Economic Sentiment, August 2020(see more posts on Eurozone ZEW Economic Sentiment, ) Source: investing.com - Click to enlarge |
| There were two economic reports of note today in Europe. The first was the UK. The unemployment rate ticked up to 4.1% in July from 3.9% in June. The claimant count rose by 73.7k in August after a revised 69.9k increase in July (initially 94.4k). |
U.K. Unemployment Rate, July 2020(see more posts on U.K. Unemployment Rate, ) Source: investing.com - Click to enlarge |
| Average weekly earnings, excluding bonuses, rose by 0.2%. It is the first sequential increase in over a year. The furlough program that is to end next month continues to disguise the extent of the weakness of the labor market. The second report was the German ZEW investor survey for September. It was better than expected. The expectations component had been expected to fall, but instead, it rose to 77.4 from 71.5. The assessment of the current condition came in at -66.2 from -81.3. The median in the Bloomberg survey forecast a -72.0 reading. |
U.K. Average Earnings ex Bonus, July 2020(see more posts on U.K. Average Earnings ex Bonus, )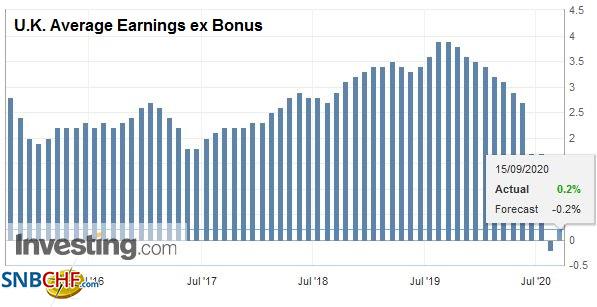 Source: investing.com - Click to enlarge |
The euro saw $1.19 in Asia and found support in Europe near $1.1860. It looks set to challenge the highs in the North American session. There is an option for about 635 mln euros at $1.1910. Recall that the high last week, on the ECB meeting, was just shy of $1.1920. On the downside, there are options for 3.2 bln euro struck between $1.1830 and $1.1850, with the lion’s share at the higher end of the range. Sterling rose by almost 0.4% yesterday, its biggest gain this month. It is trading inside yesterday’s range (~$1.2775-$1.2920). This seemed to mostly reflect short-covering in the face of the US dollar’s weakness. Today, sterling appears to be helped by some unwinding long euro short sterling cross positions. A break of GBP0.9200 could spur a move toward GBP0.9150 initially.
AmericaAs the FOMC meeting begins, the US reports August industrial production and September’s Empire State manufacturing survey. Industrial output is expected to have increased by 1% after a 3% increase in July and a 5.7% rise in June. The eurozone reported its aggregate industrial output yesterday for July. It rose 4.1% after a 9.5% increase in June. In the US, manufacturing output is expected to have slowed to 1.3% after increasing by 3.4% in July. |
U.S. Industrial Production YoY, August 2020(see more posts on U.S. Industrial Production, ) Source: investing.com - Click to enlarge |
| Capacity utilization is forecast to have edged up to 71.4% from 70.6%. The Empire State survey slowed from 17.2 in July to 3.7 in August, which disappointed forecasts, but was an outlier compared with other manufacturing surveys. In September, it is expected to have increased to 6.8. |
U.S. Capacity Utilization Rate, August 2020(see more posts on U.S. Capacity Utilization Rate, )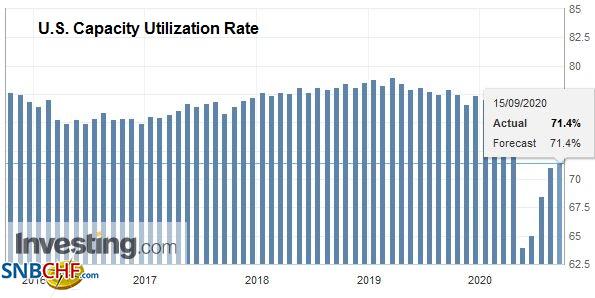 Source: investing.com - Click to enlarge |
Canada reports July manufacturing sales and existing home sales for August. Housing in Canada, like in the US, has been a leading sector in the recovery. However, it is expected to begin moderating. Separately, Canadian banks cautioned the government to reintroduce fiscal discipline even though the country has among the lowest debt burdens among the G7 (~65%). They pressed for productivity-enhancing investment, like childcare (Canada has one of the lowest women participation in the labor force among major countries) rather than focus merely on demand. Note that tomorrow Canada reports August CPI.
OPEC downgraded its forecast for demand by a million barrels a day. It also boosted the outlook for non-OPEC output by almost 400k barrels a day, mostly due to upward revisions in projections of US output. The fact that producers in the Middle East and elsewhere, including the US, have cut prices for Asian shipments appears to reflect weakening demand and rising inventories, including products like diesel. Brent and WTI are near three-month lows. The US crude inventories are expected to have increased last week by a couple million barrels. It would be the second consecutive weekly gain after a six-week roughly 34 mln barrel drawdown. A small draw is expected in gasoline and distillates. On a separate but related issue, the price of Brent is off more than 40% year-to-date. The euro has risen by about 5.8% against the dollar.
The US dollar is in the middle of a CAD1.3100-CAD1.3200 range. It is lagging behind the other dollar-bloc currencies. The consolidative phase is likely to end soon, and we favor another leg lower for the greenback. The low for the year was set in January near CAD1.2960. Meanwhile, the greenback is pushing lower against the Mexican peso for the third session and is drawing near MXN21.0, which has not been seen in six months. On a break, the next technical objective is near MXN20.75. The nearly 4.5% yield on Mexican bills (cetes) is a key driving force behind the peso’s recovery. With the lastest gains, the peso is still off more than 10% against the dollar this year.
Graphs and additional information on Swiss Franc by the snbchf team.
Full story here Are you the author? Previous post See more for Next postTags: #USD,$CNY,Brexit,Canada,China,Currency Movement,Featured,newsletter,U.K.


