Swiss FrancThe Euro has risen by 0.18% to 1.0791 |
EUR/CHF and USD/CHF, July 16(see more posts on EUR/CHF, USD/CHF, )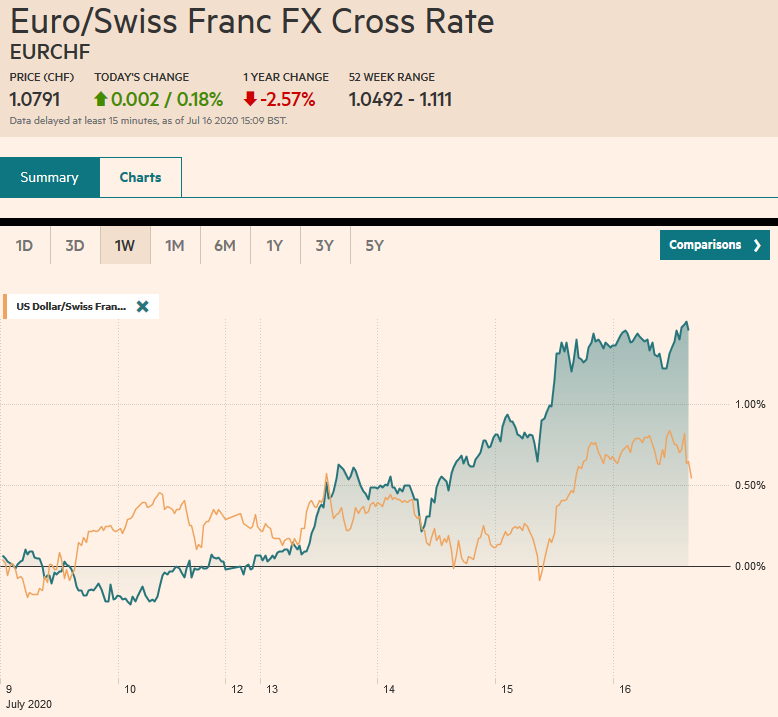 Source: markets.ft.com - Click to enlarge |
FX RatesOverview: Profit-taking, perhaps spurred by disappointing retail sales figures, sent Chinese equity markets down by 4.5%-5.2% today, the most since early February. It appears to be triggering a broader setback in equities today. The Hang Seng fell 2%, and most other markets in the region were off less than 1%. India was bucking the trend in late turnover. Europe’s Dow Jones Stoxx 600 was off around 0.75%, and the 200-day moving average that stymied it last month had been approached yesterday. US shares are trading heavily as well. The S&P 500 gapped down in early February as the swoon began. The bottom of that gap, near 3260 is the next significant technical hurdle. Bond markets are little changed in the face of the equity drop. The US 10-year is hovering around 62 bp. The dollar’s downside momentum has stalled, and the greenback is trading higher against nearly all the world’s currencies today. Among the majors, the Scandis and Australian dollar are the heaviest, but the Canadian dollar, yen, and Swiss franc, less than 0.2% lower, near midday in Europe. Gold continues to gravitate around $1800 an ounce, and September WTI is straddling $41 a barrel. |
FX Performance, July 16 |
Asia PacificChina’s Q2 GDP was stronger than expected. It expanded by 11.5% quarter-over-quarter after a revised 10% decline in Q1 (initially -9.8%). |
China Gross Domestic Product (GDP) YoY, Q2 2020(see more posts on China Gross Domestic Product, )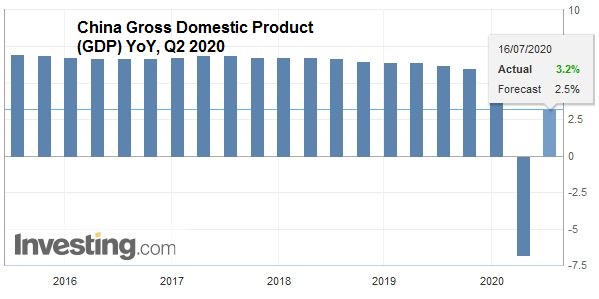 Source: investing.com - Click to enlarge |
| The median forecast in the Bloomberg survey was for 9.6% growth. |
China Retail Sales YoY, June 2020(see more posts on China Retail Sales, )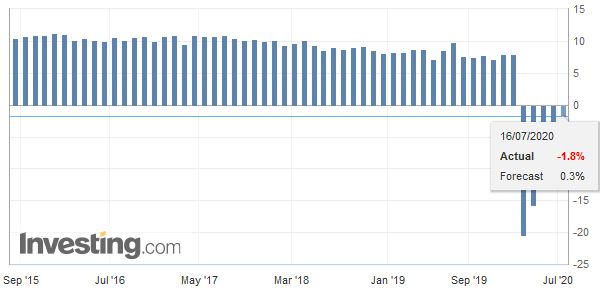 Source: investing.com - Click to enlarge |
| That translates into 3.2% growth from a year ago, though output in H1 was still 1.6% lower than a year ago. While the June industrial output and investment figures were in line with expectations, the June retail sales disappointed. |
China Fixed Asset Investment YoY, June 2020(see more posts on China Fixed Asset Investment, )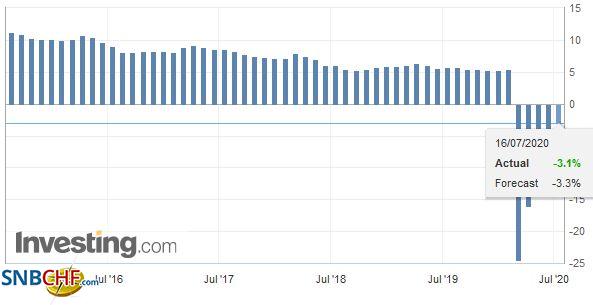 Source: investing.com - Click to enlarge |
| It fell 1.8% from a year ago. While better than the 2.8% decline reported in May, it defied expectations for an increase. The initial takeaway is that the infrastructure spending and fiscal stimulus are helping industry, it is not bolstering consumption. |
China Industrial Production YoY, June 2020(see more posts on China Industrial Production, )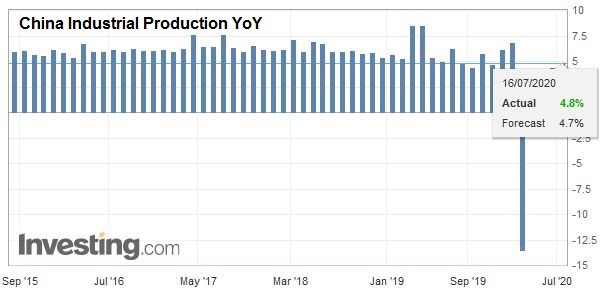 Source: investing.com - Click to enlarge |
Australia created 210k jobs last month, more than twice what economists projected. However, there was disappointment that all the jobs were part-time, as some 38k full-time positions were lost. The unemployment rate ticked up to 7.4% from 7.1%, which is was a bit more than expected and reflects a stronger than anticipated rise in the participation rate (64% vs. 62.9% in May).
Japanese weekly portfolio flows grabbed attention. Japanese investors were steady buyers of foreign bonds in June after selling in May but moved to the sidelines in late June and early July. They returned last week and bought JPY1.06 trillion of foreign bonds. However, the even bigger story was the record divestment of global equities. Japanese investors sold JPY3.6 trillion of international stocks last week, according to the Ministry of Finance data. This offsets about 68% of the foreign equities bought this year. For their part, foreign investors bought as roughly as many Japanese equities and bonds last week as they had sold the previous week. Recall that last week, the dollar slipped by 0.5% against the yen and was virtually unchanged against the euro.
The dollar is in about a quarter of a yen range below JPY107.10. Options for about $1.5 bln are a bit higher in the JPY107.25-JPY107.35 area and are set to expire today. The upper end of that range is also marked by the downtrend in place since early June. Nearby support around JPY106.65 was tested yesterday. The Australian dollar reached almost $0.7040 yesterday, its highest level in a month, but the upside momentum has stalled. Around $0.6980, where it is trading in late in the European morning, houses an expiring option for about A$563 mln and is roughly the middle of the range that extends toward $0.6920-$0.6930. The PBOC’s dollar reference rate was slightly firmer than the models suggested, but the greenback remained mostly below the CNY7.0 level. Separately, we note that South Korea left its 7-day repo rate at 50 bp, as widely anticipated. On the other hand, Indonesia delivered the 25 bp cut in its 7-day reverse repo rate to 4.0%, as expected.
EuropeThe ECB meeting today and press conference is today’s European highlight but really plays second fiddle this week to the European Summit. The ECB shot its quiver of arrows last week when it expanded and extended its Pandemic Emergency Purchase Program and indicated it would continue to reinvest proceeds of maturing issues through at least 2022. There is no need for fresh action, and the more than a trillion euro of the long-term loans at minus 100 bp removes the urgency of reducing the reserves impacted by negative deposit rates. At the current pace, the ECB will have exhausted the PEPP a few months before the middle of 2021, the new time frame after the extension from the end of this year at the last ECB meeting. At some point, possibly late this year, will either reduce its buying or, more likely, announce a further increase in PEPP. Lagarde is expected to underscore that the new bonds that will likely be issued by the EU are candidates for its bond purchases. To the extent that there is a discussion, the ECB leadership may have to fend off a rear-guard action that seeks to get is purchases and holdings back in line with the capital key. This would reduce the ECB’s flexibility to deploy its resources where it is necessary to ensure the transmission mechanism of its monetary policy is working. |
Eurozone Trade Balance, May 2020(see more posts on Eurozone Trade Balance, ) Source: investing.com - Click to enlarge |
| The UK employment data was showed modest improvement. The June claimant count fell by 28.1k after increasing by a revised 566k in May (initially 529k). Approximately 125k jobs were lost over the past three months, compared with projections for twice the loss. |
U.K. Average Earnings ex Bonus, May 2020(see more posts on U.K. Average Earnings, ) Source: investing.com - Click to enlarge |
| The ILO measure of unemployment was steady at 3.9%. The median forecast was for an increase to 4.2%. The UK furlough program is helping to contain, or some say, postpone the job destruction. |
U.K. Unemployment Rate, May 2020(see more posts on U.K. Unemployment Rate, )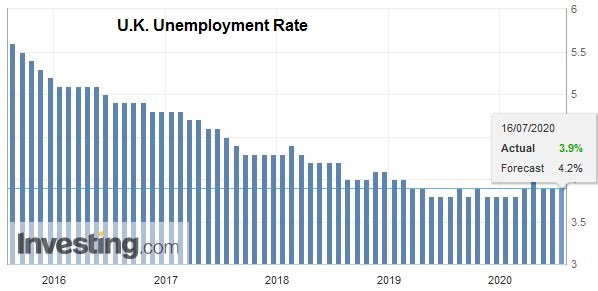 Source: investing.com - Click to enlarge |
The euro reached a four-month high a little above $1.1450 yesterday. It has been in a 20-tick range on either side of $1.1400 in the European morning, where an option for about 855 mln euros will expire today. There also are a set of options for roughly 1.3 bln euro bln euros between $1.1435 and $1.1450 that roll-off today. The euro has rallied strongly against the Swiss franc in recent days, and it reached almost CHF1.08 today, its highest level in over a month, and marks chart-based resistance. We suspect that some participants switched from dollars and yen funding to franc-funding. Sterling is pulling back from yesterday’s push to $1.2650, ahead of the $1.2670 cap that was seen at the end of last week and earlier this week. The option for GBP370 mln at $1.2510 that expires today looks vulnerable. Initial support is seen closer to $1.2480.
AmericaThe US data continues to surprise on the upside. Today’s June retail sales report risks more of the same. The manufacturing sector is leading the US recovery. Industrial output jumped by 5.4%, led by a 7.2% surge in manufacturing. The key driver was a more than 100% month-over-month increase in auto production. The Empire State manufacturing survey rose to 17.2 (from -0.2), which is above last year’s highs (14.4). This is not to argue that the economy has recovered. The claim is much more modest: The manufacturing sector has begun to recover. The stalled, and sometimes reversal or re-opening measures may act as a headwind and shift some growth into Q4. That said, as of the end of last week, the NY Fed’s GDP Nowcast projects, the US economy is expanding at a 10.1% annualized rate this quarter. |
U.S. Retail Sales YoY, June 2020(see more posts on U.S. Retail Sales, )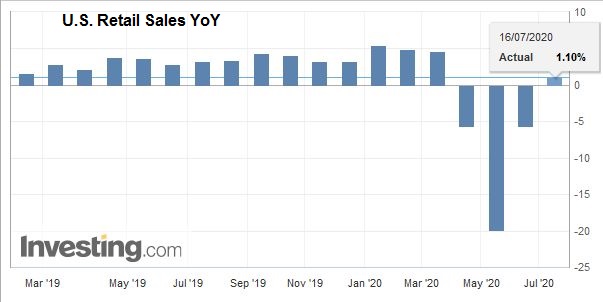 Source: investing.com - Click to enlarge |
| US weekly jobless claims continue to prove sticky. They peaked at the end of March near 6.9 mln. They have fallen every week since but were still at a lofty 1.3 mln in the holiday-shortened week to July 3. The median forecast in the Bloomberg survey expected 1.25 mln people filed for unemployment insurance last week. The other weekly report that has been drawing attention is the Fed’s balance sheet, which is reported shortly after the markets close today. It has fallen for four consecutive weeks as previously extended funds (e.g., swaps and repos) are not fully rolled over, and new programs are slow to catch on, like Main Street. |
U.S. Philadelphia Fed Manufacturing Index, July 2020(see more posts on U.S. Philadelphia Fed Manufacturing Index, )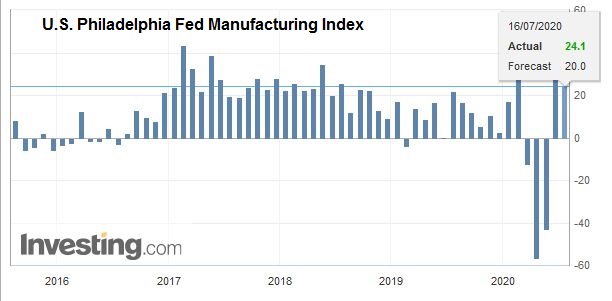 Source: investing.com - Click to enlarge |
The US dollar slumped against the Canadian dollar yesterday after the Bank of Canada’s decision to leave rates unchanged and offered forward guidance that suggests no rate hike until after 2022, by which time the economic slack will be absorbed. The greenback tested the CAD1.35-level. It is the lower end of the one-month trading range and corresponds to the 200-day moving average. Although the upper end of the range is not until CAD1.3630-CAD1.3650, initial resistance is around CAD1.3540-CAD1.3550. Similarly, the greenback tested the lower end of its recent range against the Mexican peso (~MXN24.25) and is bouncing off it today. The MXN24.50 area offers the first important hurdle for stronger dollar recovery.
Graphs and additional information on Swiss Franc by the snbchf team.
Full story here Are you the author? Previous post See more for Next postTags: #USD,Australia,China,Currency Movement,ECB,Featured,Japan,newsletter


