


Read More »


 On Swiss National Bank
  Main SNB Background Info


 Did You Make Janet Yellen Rich?
8 Feb 2021
 Gold Stocks – A Show of Strength
17 Apr 2020
 The Secret to Fun and Easy Stock Market Riches
18 Feb 2020
 A Pharmaceutical Stock That Is Often Particularly Strong At This Time Of The Year
15 Feb 2020
 Riding the Type 3 Mega Market Melt Up Train
11 Nov 2019
 The Golden Autumn Season – One of the Most Reliable Seasonal Patterns Begins
30 Oct 2019
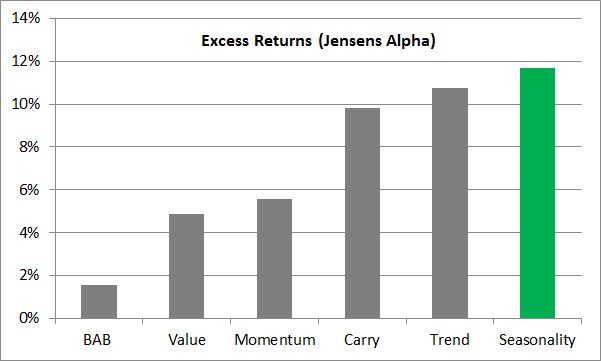 Scientific Long-Term Study Confirms: Seasonality is the Best Investment Strategy!
23 Jul 2019
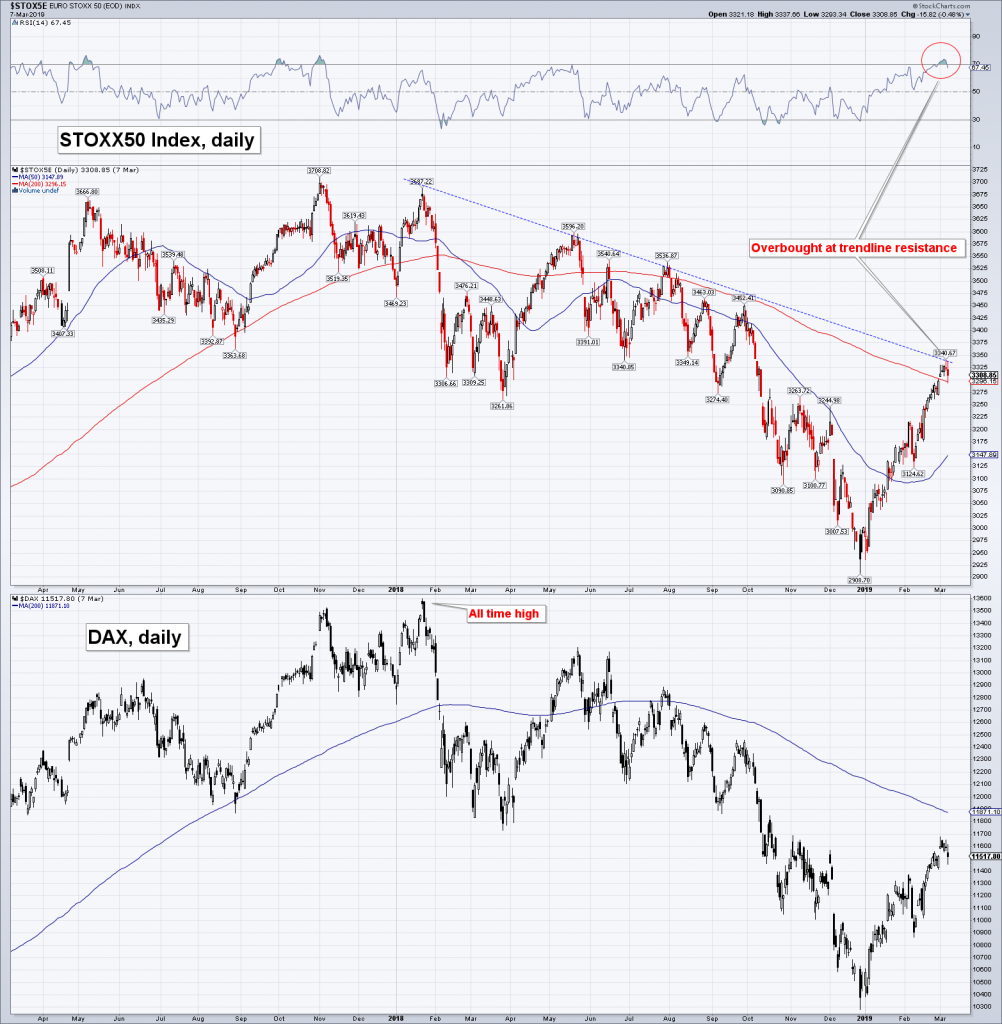 Watch Europe – Free Pass for the Elliott Wave European Financial Forecast
9 Mar 2019
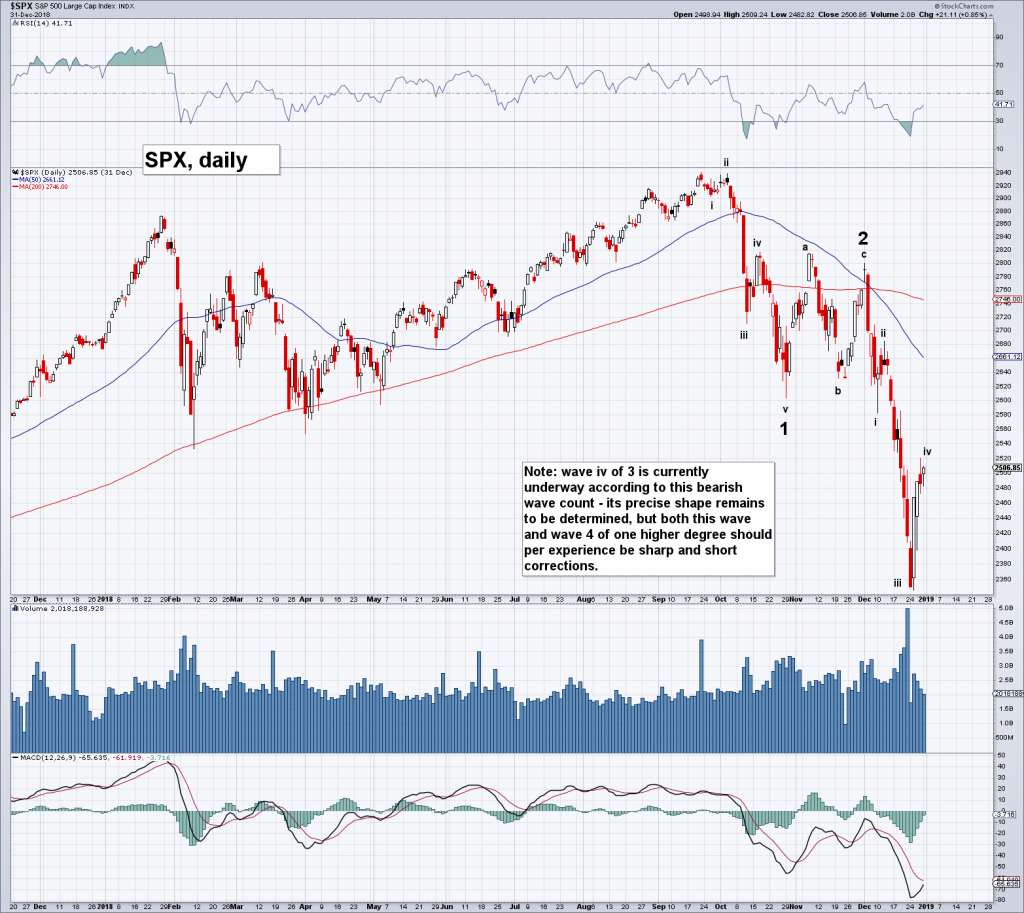 The Bear Market Hook
3 Jan 2019
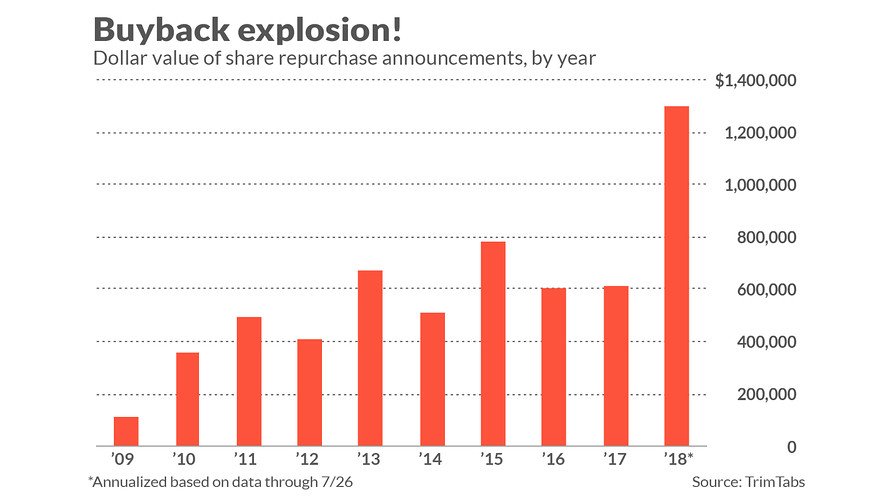
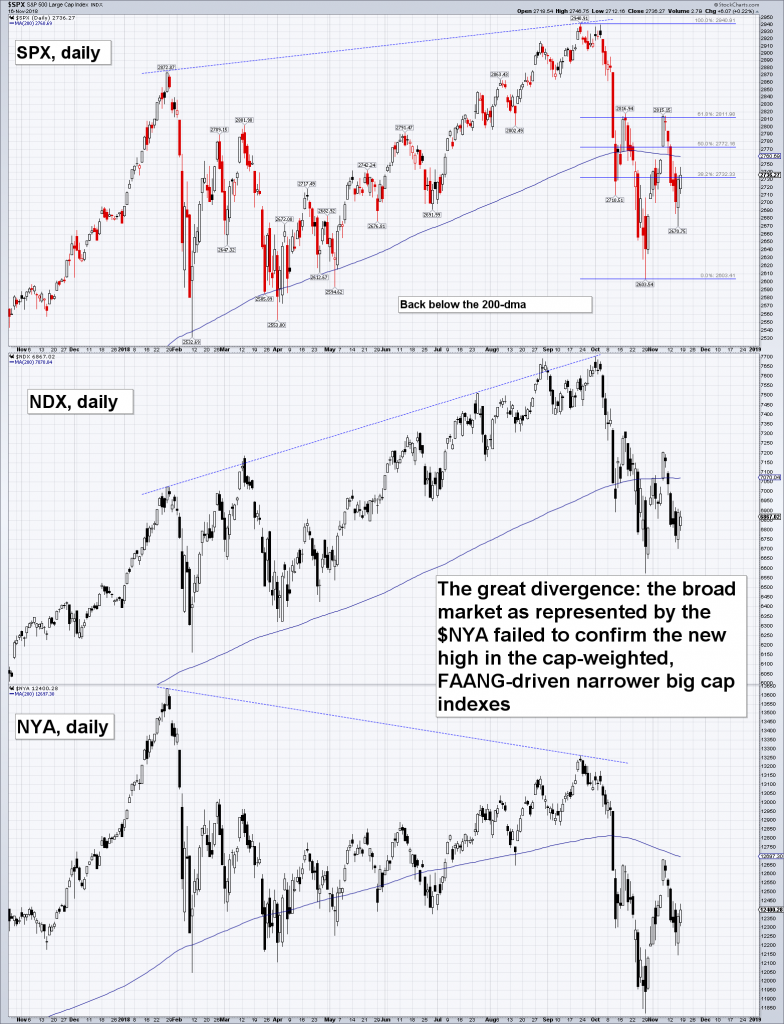 The Intolerable Scourge of Fake Capitalism
20 Nov 2018
 Is the Canary in the Gold Mine Coming to Life Again?
17 Oct 2018
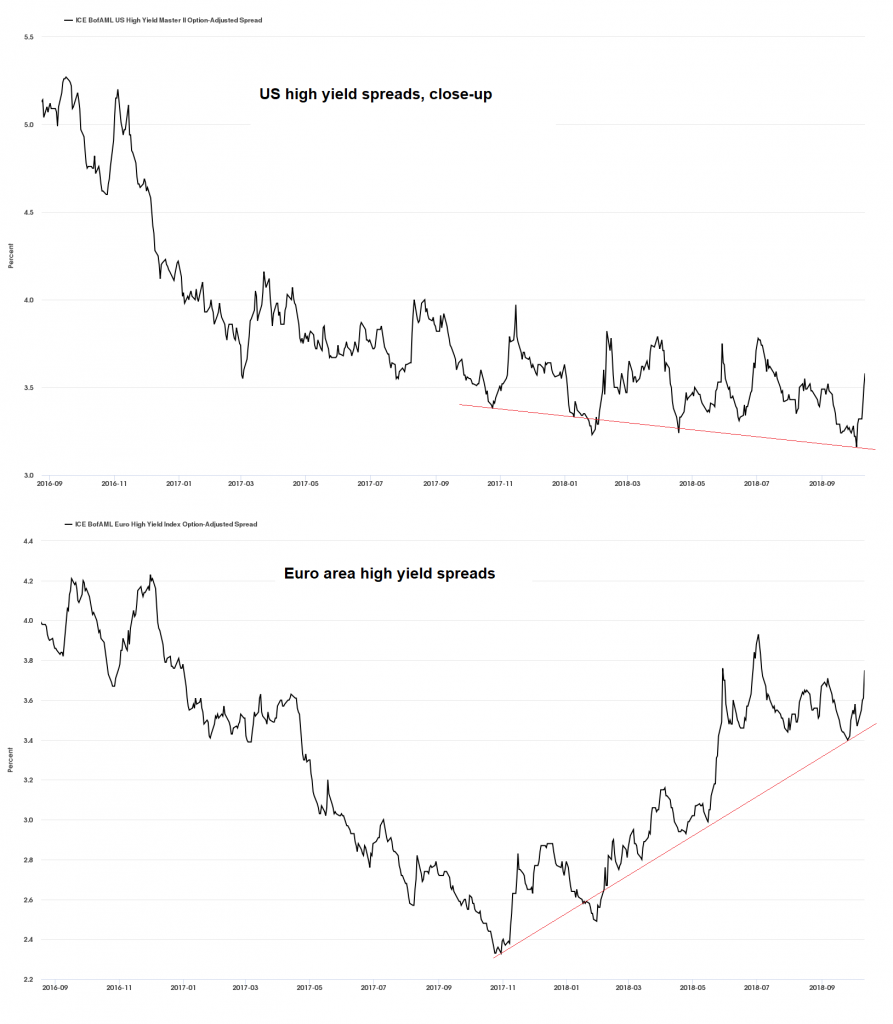 Are Credit Spreads Still a Leading Indicator for the Stock Market?
16 Oct 2018
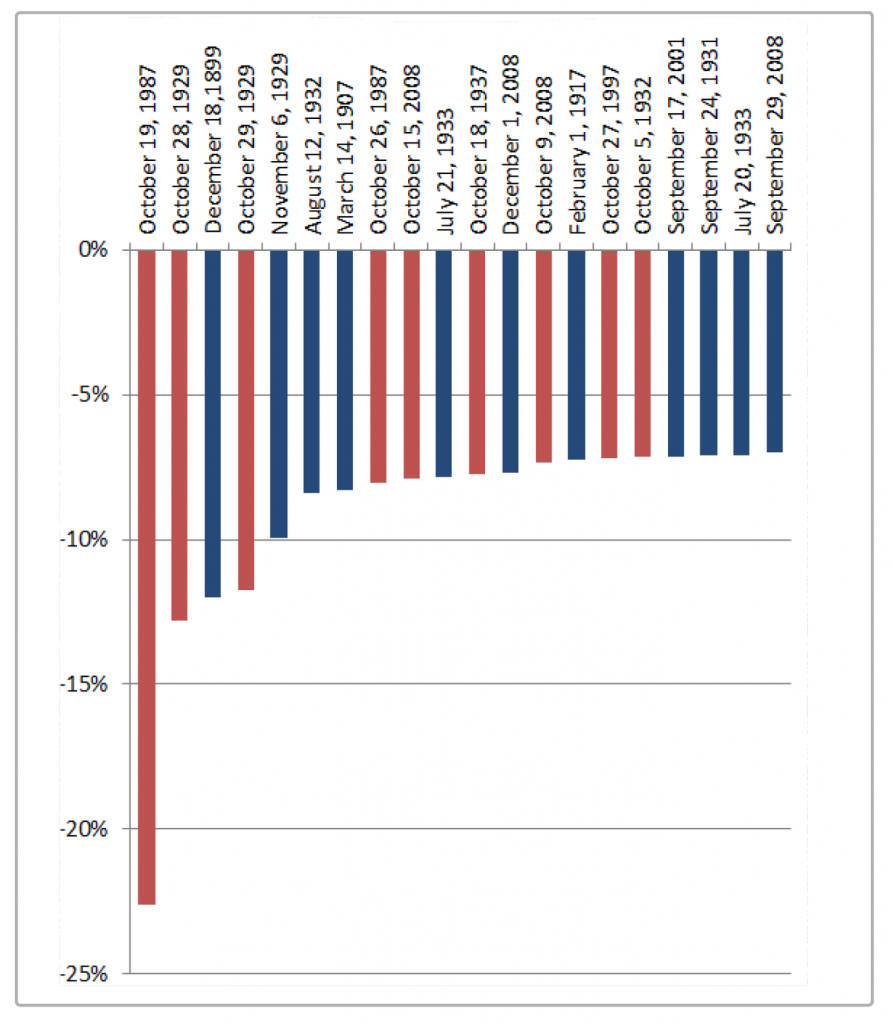 How Dangerous is the Month of October?
9 Oct 2018
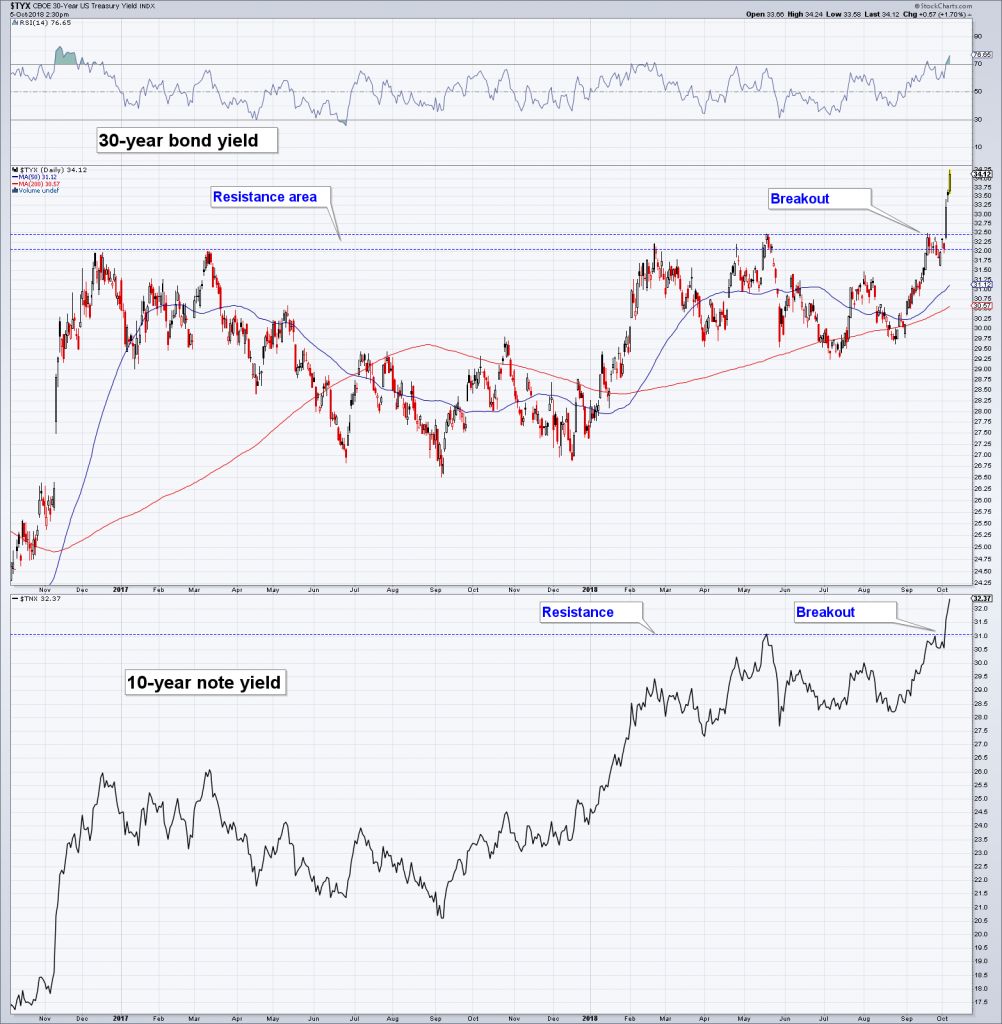 US Stocks and Bonds Get Clocked in Tandem
8 Oct 2018
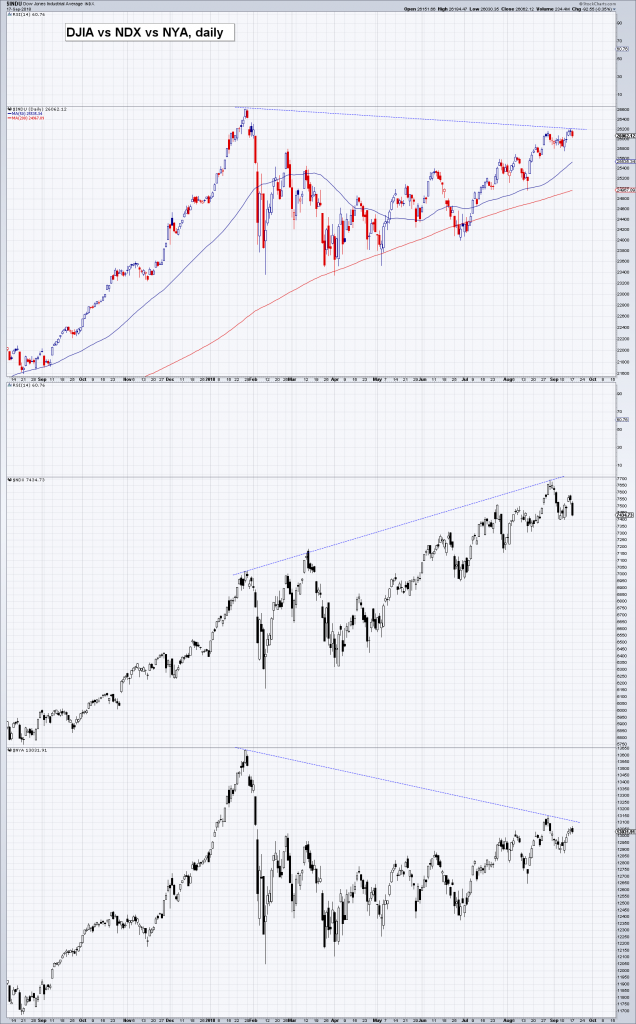 US Equities – Approaching an Inflection Point
19 Sep 2018
 Wall Street – Island of the Blessed
16 Aug 2018
 Stock Market Manias of the Past vs the Echo Bubble
6 Aug 2018
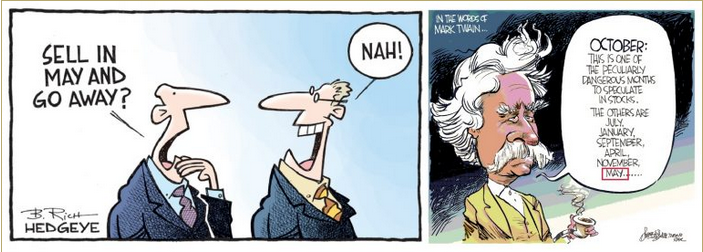 “Sell In May And Go Away” – A Reminder: In 9 Out Of 11 Countries It Makes Sense To Do So
29 May 2018
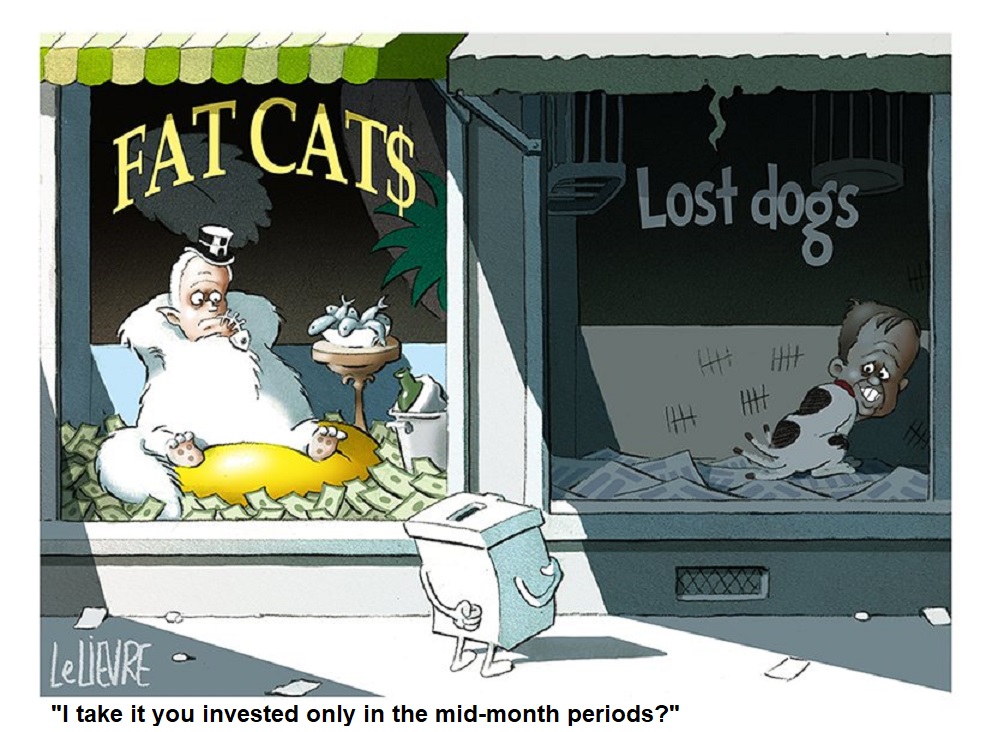 Global Turn-of-the-Month Effect – An Update
17 May 2018
 The “Turn of the Month Effect” Exists in 11 of 11 Countries
22 Apr 2018
