


Pater Tenebrarum
My articles My siteAbout meMy videosMy books
Follow on:TwitterSeeking AlphaFacebook
A Lengthy Non-ConfirmationAs we have frequently pointed out in recent months, since beginning to rise from the lows of the sharp but brief downturn after the late January blow-off high, the US stock market is bereft of uniformity. Instead, an uncommonly lengthy non-confirmation between the the strongest indexes and the broad market has been established. The chart below illustrates the situation – it compares the performance of the DJIA (still no new high since January, although it has come close), the NDX (one of the best-performing indexes, along with the Russell 2000/ RUT) and the NYA (our proxy for the broad market): On Monday the NDX pulled back to its 50-day moving average, which has contained all short term pullbacks since early May. If we were looking only at the daily price charts of NDX or RUT, we would definitely not call their patterns bearish. Per experience rising wedges like the one that has recently formed in the NDX (the Nasdaq Composite looks similar) more often than not lead to further upside – contrary to the conventional wisdom on these chart formations. But these indexes do not exist in isolation. A further advance in the near term seems unlikely, in light of a recent sharp rise in bullish sentiment (consider e.g. Mark Hulbert’s Nasdaq sentiment gauge in this context). Most sentiment and positioning indicators recently returned to very high levels relative to their history, but failed to eclipse their January highs. |
DJIA vs. NDX vs. NYA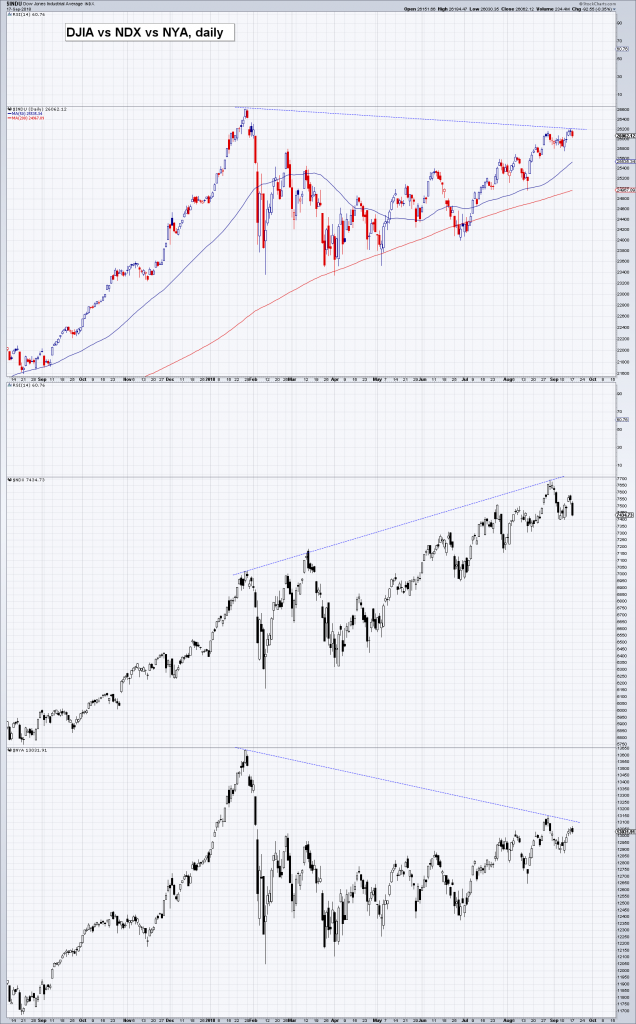 - Click to enlarge DJIA vs. NDX vs. NYA – this rather glaring and very lengthy divergence is a symptom of a narrowing market. The vast bulk of the uptrend in benchmarks such as the S&P 500 was due to the surge in the “FAANG” stocks (FB, AAPL, AMZN, NFLX, GOOGL) – but even this group of stocks is no longer in uniform tracking mode, as FB has fallen out of bed and NFLX and even GOOGL have begun to look wobbly lately. File under interesting trivia: AMZN and AAPL, the two strongest stocks of the group, reached their highest closing levels to date on September 4, the day after Labor Day (the year-to-date closing high in the NDX was recorded on August 29). In 1929, Labor Day fell on September 2 and the DJIA topped out on September 3. |
| The next chart compares two major developed market indexes – the S&P 500 Index and the Euro-Stoxx 50 Index. The divergence between these markets has grown enormously. You may be surprised to learn that European stocks actually topped out in early 2015 (a few country indexes surpassed their 2015 peaks, but the same cannot be said for Europe-wide indexes).
If anything, the EuroStoxx Index shows that superficially obvious fundamentals often count for very little – after all, it has weakened amid an improving economic recovery, rising corporate earnings and heavy money printing by the ECB. European stocks are actually fairly cheap these days, especially on a relative basis. The problem seems to be that there are inter alia no FAANG equivalents listed in Europe. Banks have actually the by far biggest weighting in the index (almost 20%), followed by industrials (~13%), consumer cyclicals (11.36%), healthcare stocks (10.81%) and consumer staples (10.77%). Tech stocks follow in 6th place with just 8.77% – a mere ~100 bps higher than the weighting of energy stocks (7.83%). In other words, this particular divergence indirectly reflects the dominance of the FAANG group as well. |
SPX vs. EuroStoxx 50 (STOX5E).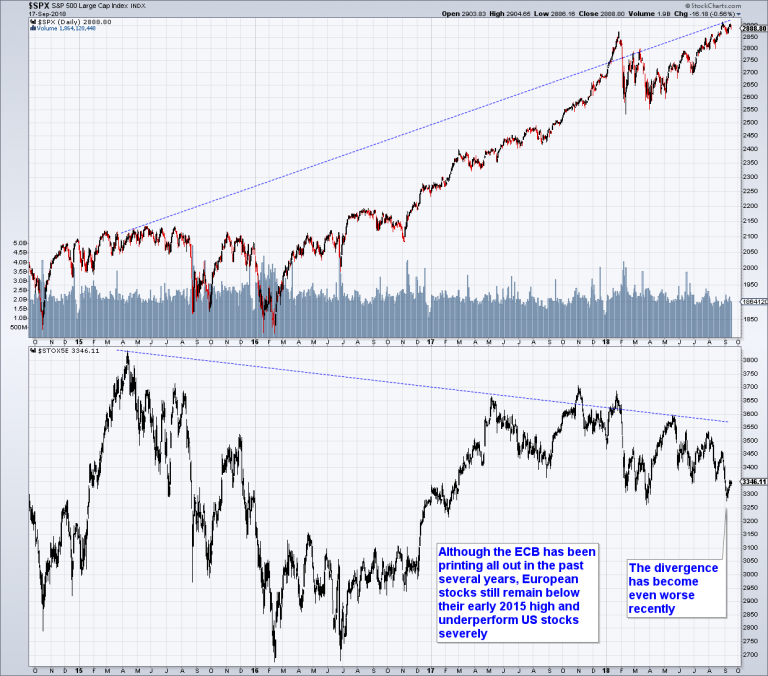 - Click to enlarge European stocks already peaked in early 2015, when the initial enthusiasm over ECB QE started to wane. They remain well below their 2015 peak to this day – and this has created what is easily their biggest ever divergence vs. the SPX. |
Poor Market Internals and Anecdotes of Ingrained ExuberanceA noteworthy recent development was a large cluster of Hindenburg omens that has been recorded in Nasdaq and NYA. In order to provide some context, below are two charts showing the history of such signal clusters. While Hindenburg omens are often meaningless, every major decline in the past was preceded by one, or rather several of them (clustering of signals is typically seen ahead of major turning points). The signal has at best a mixed reputation due to its perceived lack of predictive value, but this may actually be undeserved. As the charts above show, the negative implications of the Hindenburg omen seem to be stronger when it is triggered very frequently over relatively long time periods. Of course this does not represent a guarantee – similar to the new high-new low percentage index for the S&P 500 Index which we we usually follow, it is simply another indicator documenting that trend uniformity within the stock market is breaking down. |
“Hindenburg” statistics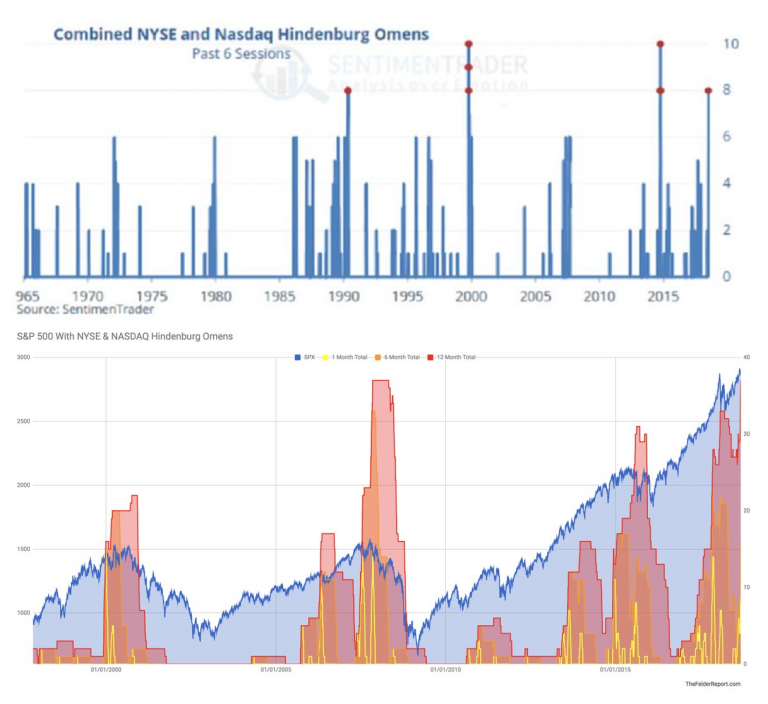 - Click to enlarge Two different views of the “Hindenburg” statistics. The chart at the top adds Nasdaq and NYSE Hindenburg signals that have occurred within a span of six consecutive trading days. The recent peak of 8 occurrences is among the four highest on record. The second chart shows the frequency of signals over periods of one month, six months and one year. The one-year total has recently climbed to a tie with the previous record high established in 2007-2008. Interestingly, the mid 2015/ early 2016 corrections were also preceded by a spike in Hindenburg readings. |
| We found the second of the two charts on Twitter and noticed that the signal was almost universally dismissed as meaningless. Some of the commentators sounded quite hostile, as if the mere mention of the ominous omen constituted a personal affront. This tidbit of anecdotal sentiment actually adds a little weight to the signal’s message – a few years ago a similar chart would probably have met with a more sympathetic response. |
SPX new high-new low percentage index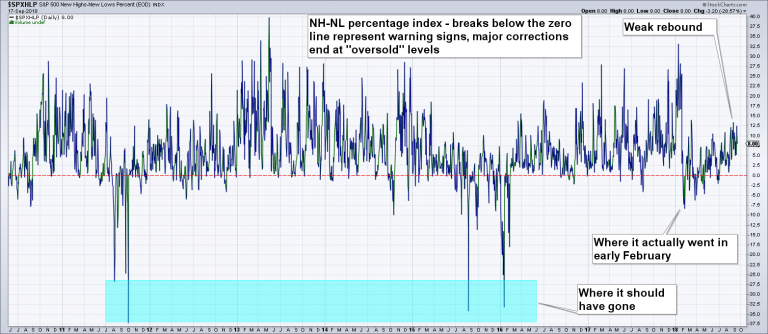 - Click to enlarge SPX new high-new low percentage index – its message is similar to that given by the Hindenburg omen. The rebound in this indicator so far remains weak and it still “owes” us an oversold reading, which it failed to provide in February. |
| We came across another tweet reflecting how deeply ingrained bullish sentiment has apparently become. It is was not just what was said, but rather the timing of the tweet we found interesting.
We don’t mean to pick on Joe Weisenthal – his tweet merely serves as an example of the prevailing market mood. One wonders what prompted him to dismiss a hedging strategy after a nearly decade-long rally that has pushed the stock market’s Shiller-PE ratio (a.k.a. CAPE) above the level seen at the top of 1929. Surely there must have been better moments to voice such misgivings, especially in light of the fact that hedges are priced as though there were almost no downside risk. |
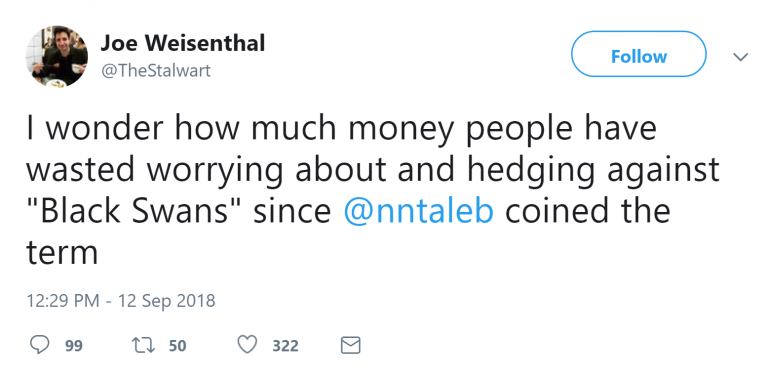 September 12 2018 may turn out not to have been the best time ever to declare hedging of one’s stock market exposure a “waste of money”. |
Active Fund Management Falls out of FavorAlong similar lines, we were recently (once again) treated to several reports in the financial press on the poor performance of hedge funds in recent years – here is an example, here is another one. A number of prominent fund managers have been deserted by investors as a result of poor their performance (coupled with high fees to boot). Inflows across the industry have essentially stagnated for two years. Almost concurrently an article discussing the enormous popularity of passive investment vehicles such as ETFs was published by the Financial Times. Assets under management in ETFs have roughly doubled in just the past five years, on the heels of already quite heady growth rates in previous years. The report quotes numerous experts who opine unanimously that growth in ETFs is going to continue at a blistering pace. As an aside, hedge funds that have seen large inflows counter to the trend in recent years were ironically those employing algorithmic strategies – which are passive investment vehicles as well. |
Stagnation in hedge fund inflows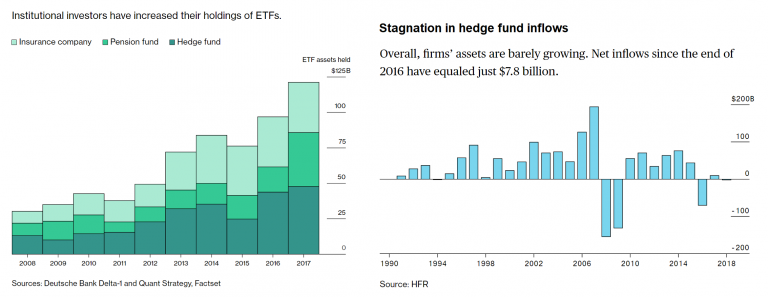 - Click to enlarge Who needs active fund managers in a bull market? Everybody is a genius in a bull market after all, and hedge funds have generally performed rather poorly of late. |
| Growing disdain for active fund managers is a phenomenon typically seen in the late stages of bull markets. At first glance this disdain seems well-deserved, but hedge funds have actually outperformed major benchmark indexes such as the SPX smartly over the long term. Passive investment vehicles meanwhile seem to distort equity valuations significantly, as stocks included in ETFs are purchased according to their weightings rather than on the basis of their investment merit. |
Hedge fund performance vs passive valuation distortions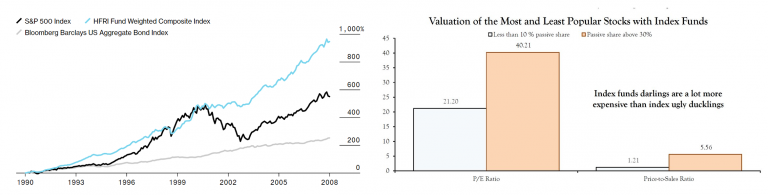 - Click to enlarge Left: hedge funds have trounced the markets from 1990 to 2010, but have floundered since then. Right: stocks with a large presence and large weightings in index funds tend to sport far higher P/E and price/sales ratios than those with a smaller presence or smaller weightings. |
| It is probably a good bet that the pendulum will eventually swing in the other direction again – once the bull market cycle ends, active money management is likely to come back into fashion – and active strategies will probably begin to outperform again as well.
Lastly, here is a chart constructed by Saxo Bank, which shows combined speculative net positions in futures on “risk protection assets” (10-year treasury note, JPY, gold and VIX futures) as of September 4: |
Speculators hold a large combined net short position in futures on risk hedges.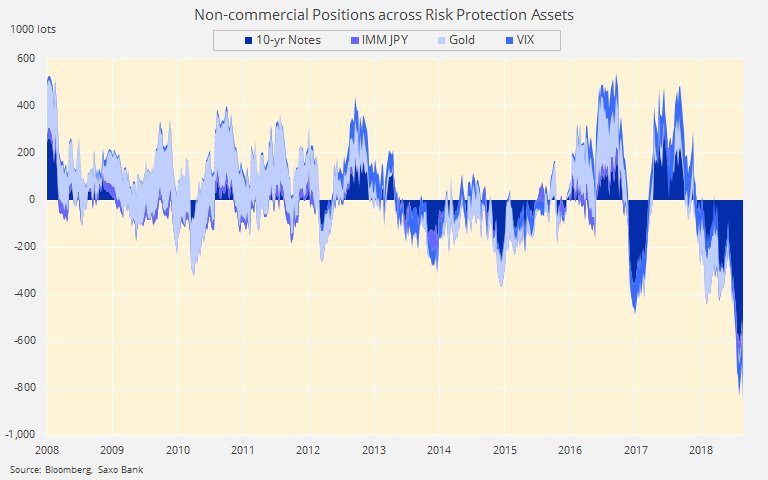 - Click to enlarge |
ConclusionThe market seems to be close to a resolution with respect to its recent uneven trading range. With many indexes just below their all time highs, this is either the point at which the rebound since February fails, or the point at which the advance accelerates and the divergences discussed above are finally overcome. In view of the recent sentiment backdrop, the extent of the divergences shown above and the increasingly hostile monetary backdrop, the former seems more likely to us than the latter, but it wouldn’t be the first time the market proved surprisingly resilient. Short term interest rates are still rising and unemployment claims recently made new lows, both of which are usually short term positive coincident indicators for the stock market. But both trends appear quite stretched by now, which suggests that an inflection point is fast approaching. Note that neither a specific trigger event nor an impending recession are required for such an inflection point to be reached. Very high valuations and weak internals make the market vulnerable even if the economic expansion continues (economic data are increasingly mixed as well, but not yet to an extent that would justify recession concerns). |
 Will the juggler manage to keep all the bombs in the air? |
Charts by: StockCharts, SentimenTrader, Jesse Felder/Felder Report, Deutsche Bank/ Factset, HFR, Bloomberg, Saxo Bank
Full story here Are you the author?
Tags: Chart Update,newsletter,The Stock Market


