Tag Archive: Chart Update

US Money Supply – The Pandemic Moonshot

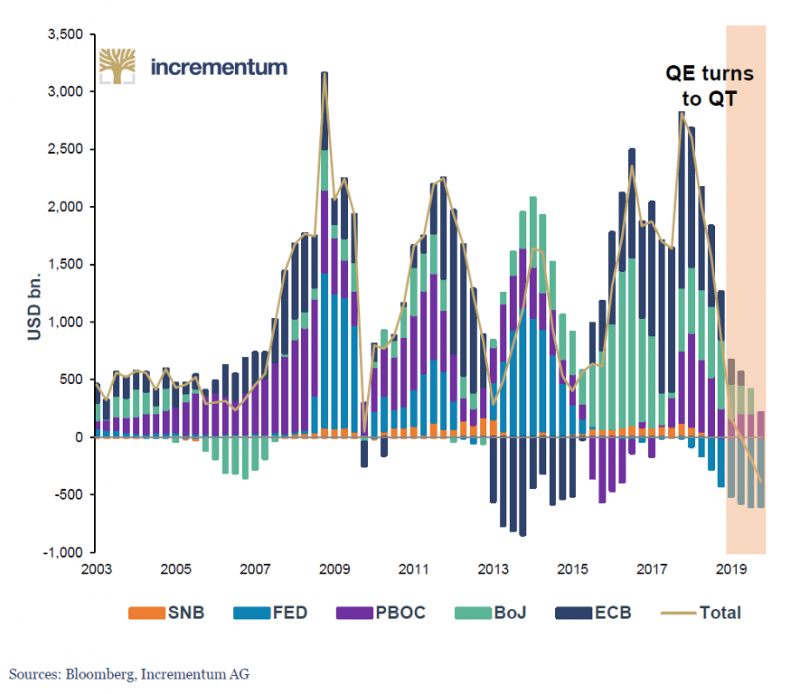
Printing Until the Cows Come Home… It started out with Jay Powell planting a happy little money tree in 2019 to keep the repo market from suffering a terminal seizure. This essentially led to a restoration of the status quo ante “QT” (the mythical beast known as “quantitative tightening” that was briefly glimpsed in 2018/19). Thus the roach motel theory of QE was confirmed: once a central bank resorts to QE, a return to “standard monetary policy”...

Read More »
Gold Stocks – A Show of Strength

Gold Sector Outperforms Broad Market. The gold sector is in an uptrend since September 2018. The initially rather labored move accelerated after a secondary low was established in May 2019 and the 50-day and 200-day moving averages were breached for the second time. Last week the two moving averages were once again overcome in the course of the post-crash rebound.

Read More »
Wealth Consumption vs. Growth – Precious Metals Supply and Demand

GDP – A Poor Measure of “Growth” Last week the prices of the metals rose $35 and $0.82. But, then, the price of a basket of the 500 biggest stocks rose 62. The price of a barrel of oil rose $1.63. Even the euro went up a smidgen. One thing that did not go up was bitcoin. Another was the much-hated asset in the longest bull market. We refer to the US Treasury.

Read More »

The Strongest Seasonal Advance in Precious Metals Begins Now

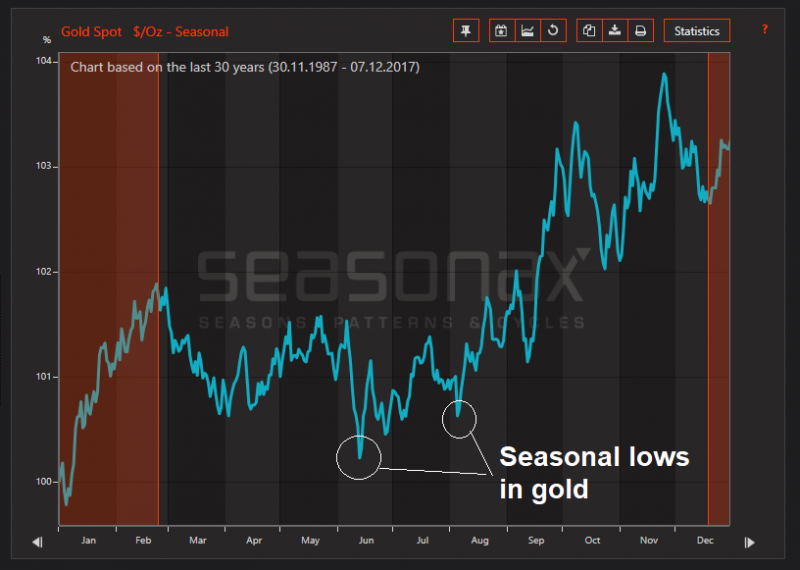
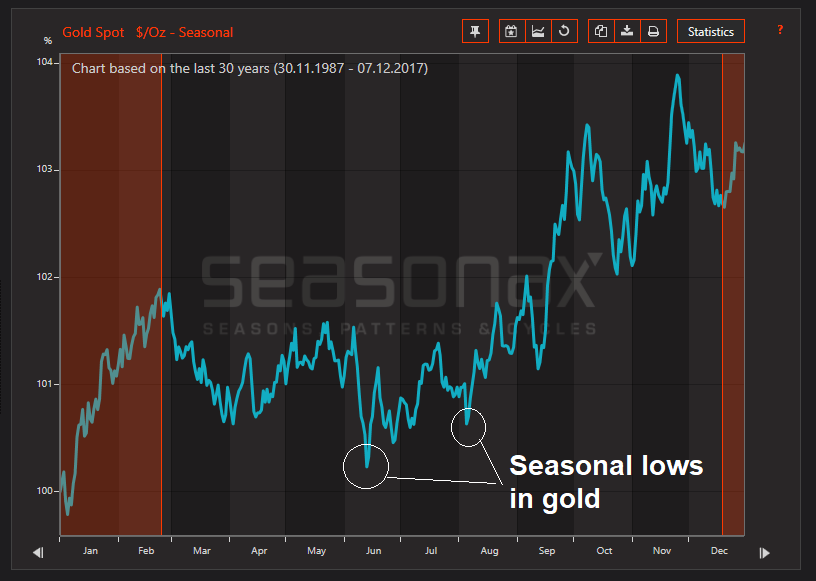
Plans and Consequences. You are probably already getting into the holiday spirit, perhaps you are even under a little stress. But the turn of the year will soon be here – an occasion to review the past year and make plans for the new one. Many people are doing just that – and their behavior is creating the strongest seasonal rally in the precious metals markets.

Read More »

Incrementum 2019 Gold Chart Book

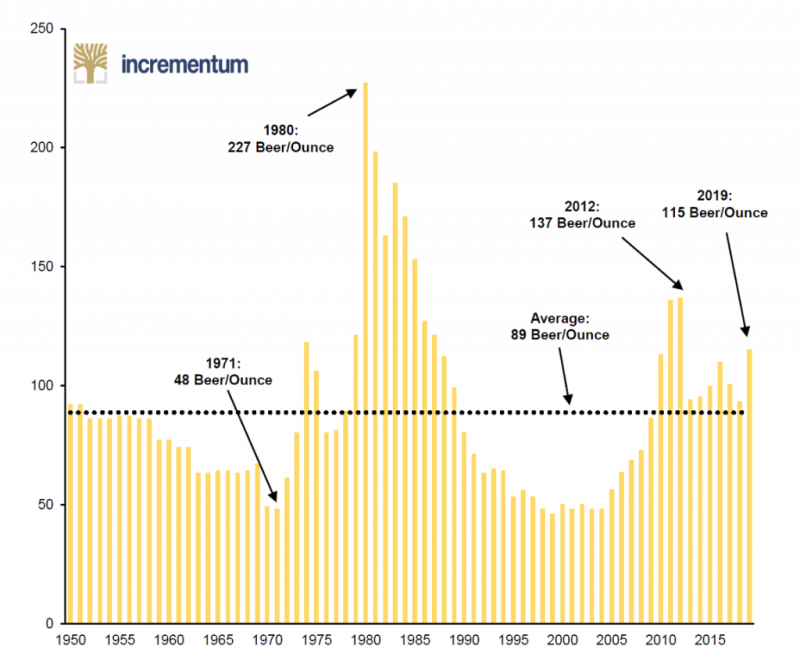
The Most Comprehensive Collection of Gold Charts. Our friends at Incrementum have just published their newest Gold Chart Book, a complement to the annual “In Gold We Trust” report. A download link to the chart book is provided below. The Incrementum Gold Chart Book is easily the most comprehensive collection of charts related to or relevant to gold available anywhere.

Read More »

A Surprise Move in Gold

Traders and Analysts Caught Wrong-Footed. Over the past week gold and gold stocks have been on a tear. It is probably fair to say that most market participants were surprised by this development. Although sentiment on gold was not extremely bearish and several observers expected a bounce, to our knowledge no-one expected this.

Read More »

In Gold We Trust 2019 

The New Annual Gold Report from Incrementum is Here. We are happy to report that the new In Gold We Trust Report for 2019 has been released today (the download link can be found at the end of this post). Ronnie Stoeferle and Mark Valek of Incrementum and numerous guest authors once again bring you what has become the reference work for anyone interested in the gold market.

Read More »

In Gold We Trust 2019 – The Preview Chart Book

The new IGWT report for 2019 will be published at the end of May… …and for the first time a Mandarin version will be released as well. In the meantime, our friends at Incrementum have decided to release a comprehensive chart book in advance of the report. The chart book contains updates of the most important charts from the 2018 IGWT report, as well as a preview of charts that will appear in the 2019 report.

Read More »

Monetary U-Turn: When Will the Fed Start Easing Again? Incrementum Advisory Board Meeting Q1 2019

On occasion of its Q1 meeting in late January, the Incrementum Advisory Board was joined by special guest Trey Reik, the lead portfolio manager of the Sprott Institutional Gold & Precious Metal Strategy at Sprott USA since 2015

Read More »

The Gold Debate – Where Do Things Stand in the Gold Market?

A Recurring Pattern. When the gold price recently spiked up to approach the resistance area even Aunt Hilda, Freddy the town drunk, and his blind dog know about by now, a recurring pattern played out. The move toward resistance fanned excitement among gold bugs (which was conspicuously lacking previously).

Read More »

Change is in the Air – Precious Metals Supply and Demand

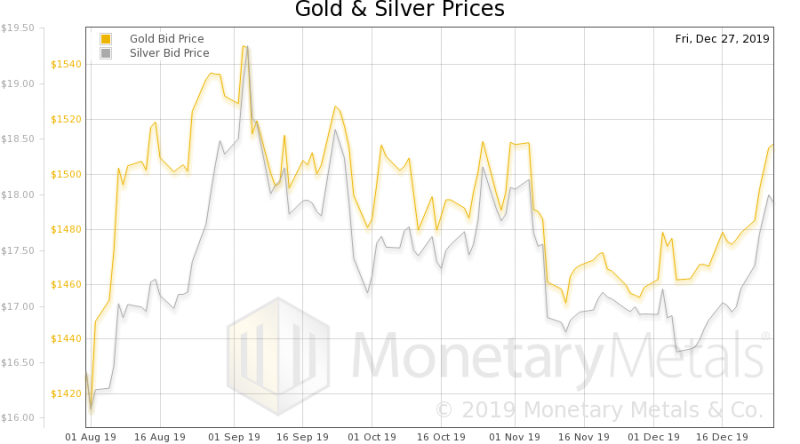
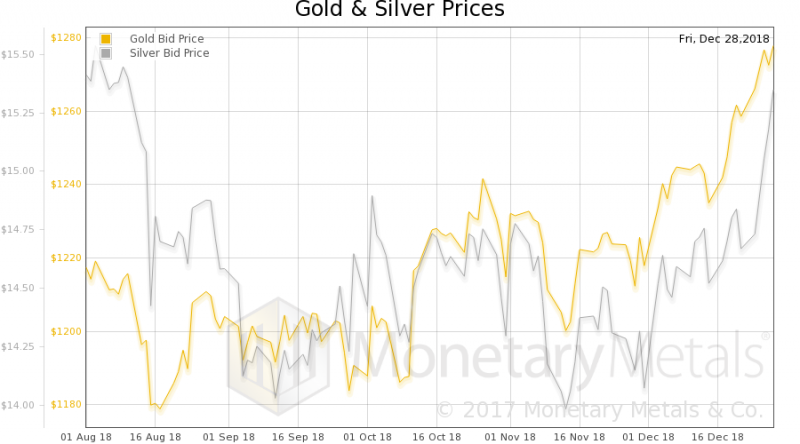
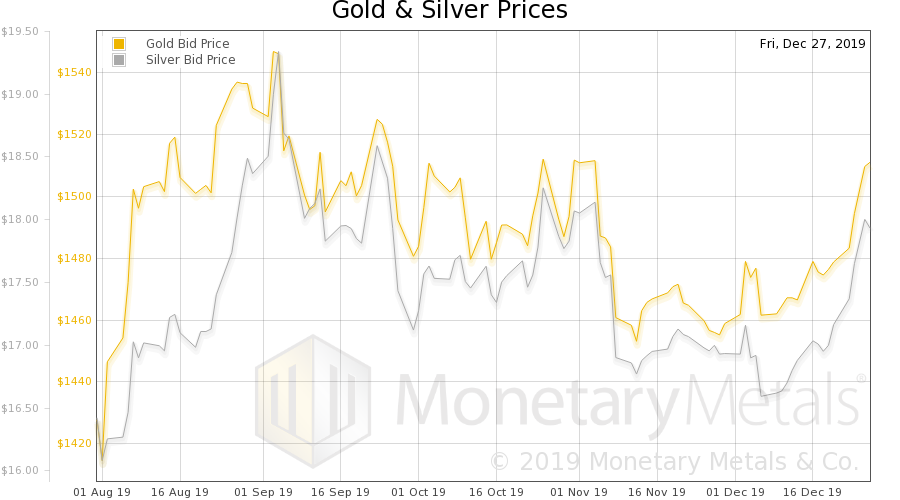
Last week, the price of gold rose $25, and that of silver $0.60. Is it our turn? Is now when gold begins to go up? To outperform stocks? Something has changed in the supply and demand picture. Let’s look at that picture. But, first, here is the chart of the prices of gold and silver.

Read More »

The Recline and Flail of Western Civilization and Other 2019 Predictions

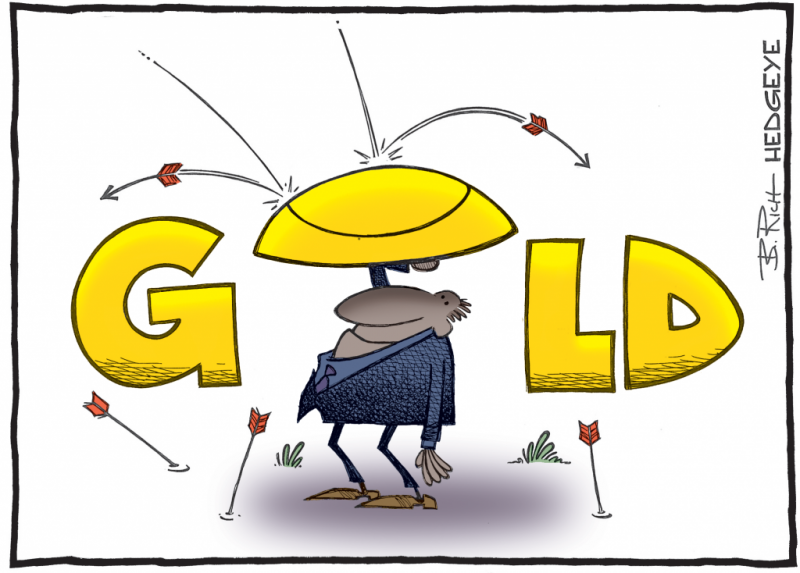
The Recline and Flail of Western Civilization and Other 2019 Predictions. “I think it’s a tremendous opportunity to buy.  Really a great opportunity to buy.” – President Donald Trump, Christmas Day 2018. Darts in a Blizzard. Today, as we prepare to close out the old, we offer a vast array of tidings.

Read More »

The Big Picture: Paper Money vs. Gold

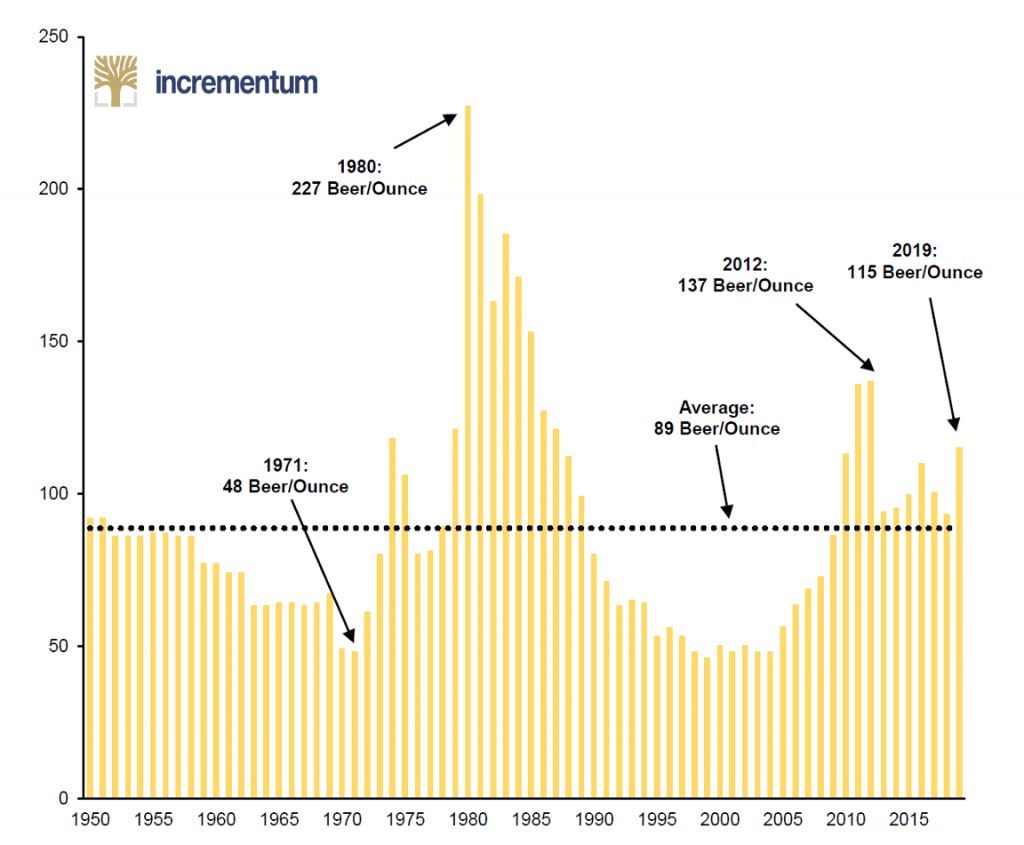
Numbers from Bizarro-World. The past few months have been really challenging for anyone invested in gold or silver; for me personally as well. Despite serious warning signs in the economy, staggering debt levels and a multitude of significant geopolitical threats at play, the rally in risk assets seemed to continue unabated.

Read More »

A Global Dearth of Liquidity

Worldwide Liquidity Drought – Money Supply Growth Slows Everywhere This is a brief update on money supply growth trends in the most important currency areas outside the US (namely the euro area, Japan and China)  as announced in in our recent update on US money supply growth (see “Federal Punch Bowl Removal Agency” for the details).   Nobody likes a drought. This collage illustrates why.   The liquidity drought is not confined to the US – it...

Read More »

Eastern Monetary Drought

Looking back at the past decade, it would be easy to conclude that central planners have good reason to be smug. After all, the Earth is still turning. The “GFC” did not sink us, instead we were promptly gifted the biggest bubble of all time –  in everything, to boot. We like to refer to it as the GBEB (“Great Bernanke Echo Bubble”) in order to make sure its chief architect is not forgotten.

Read More »

Is the Canary in the Gold Mine Coming to Life Again?

Back in late 2015 and early 2016, we wrote about a leading indicator for gold stocks, namely the sub-sector of marginal – and hence highly leveraged to the gold price – South African gold stocks. Our example du jour at the time was Harmony Gold (HMY) (see “Marginal Producer Takes Off” and “The Canary in the Gold Mine” for the details).

Read More »

You Can’t Eat Gold – Precious Metals Supply and Demand

You Actually Can Eat Gold, But Its Nutritional Value is Dubious. “You can’t eat gold.” The enemies of gold often unleash this little zinger, as if it dismisses the idea of owning gold and indeed the whole gold standard. It is a fact, you cannot eat gold. However, it dismisses nothing.

Read More »

Are Credit Spreads Still a Leading Indicator for the Stock Market?

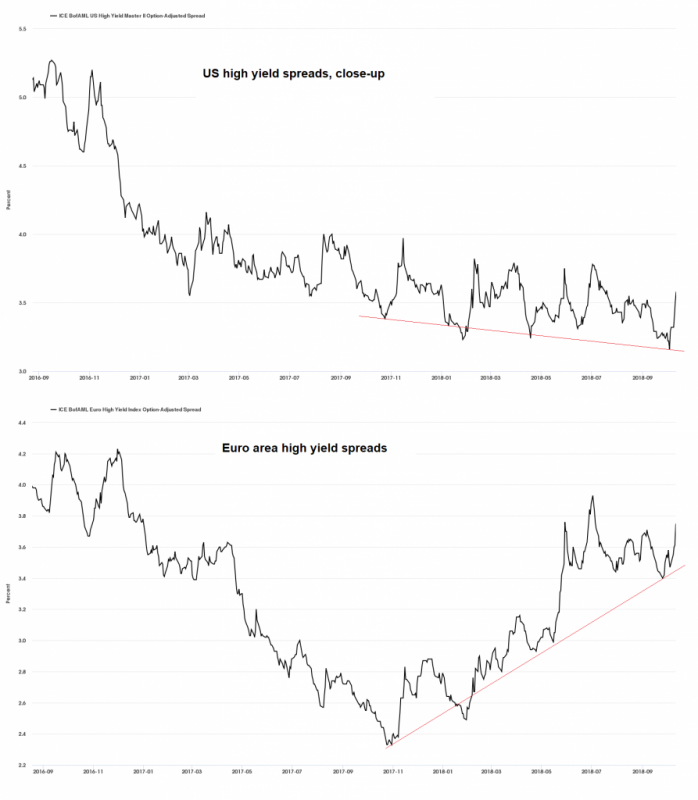
Seemingly out of the blue, equities suffered a few bad hair days recently. As regular readers know, we have long argued that one should expect corrections in the form of mini-crashes to strike with very little advance warning, due to issues related to market structure and the unique post “QE” environment.

Read More »

Fed Credit and the US Money Supply – The Liquidity Drain Accelerates

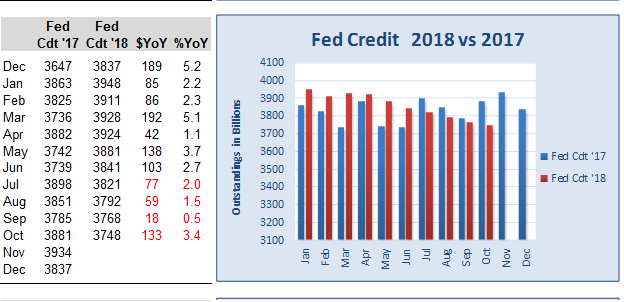
Federal Reserve Credit Contracts Further. We last wrote in July about the beginning contraction in outstanding Fed credit, repatriation inflows, reverse repos, and commercial and industrial lending growth, and how the interplay between these drivers has affected the growth rate of the true broad US money supply TMS-2 (the details can be seen here: “The Liquidity Drain Becomes Serious” and “A Scramble for Capital”).

Read More »

In Gold We Trust – Incrementum Chart Book 2018

Our friends from Incrementum (a European asset management company) have just released the annual “In Gold We Trust” chart book, which collects a wealth of statistics and charts relevant to gold, with extensive annotations. Many of these charts cannot be found anywhere else.

Read More »