


Pater Tenebrarum
My articles My siteAbout meMy videosMy books
Follow on:TwitterSeeking AlphaFacebook
| Worldwide Liquidity Drought – Money Supply Growth Slows Everywhere
This is a brief update on money supply growth trends in the most important currency areas outside the US (namely the euro area, Japan and China) as announced in in our recent update on US money supply growth (see “Federal Punch Bowl Removal Agency” for the details). The liquidity drought is not confined to the US – it is fair to say that it is a global phenomenon, even though money supply growth rates in the euro area and Japan superficially still look fairly brisk. However, they are in the process of slowing down quite rapidly from much higher levels – and this trend seems set to continue. |
 Nobody likes a drought. This collage illustrates why. - Click to enlarge |
Euro Area – Money Supply Growth Still High, But Slowing FastThe chart below shows the euro area’s narrow money supply aggregate M1 (stock) and its year-on-year growth rate. M1 in the euro area is almost equivalent to US TMS-2, which makes it a good enough stand-in (it includes savings deposits that are in practice payable on demand; however, it lacks euro deposits belonging to foreign residents and central government deposits). It is worth noting that a slowdown to a 0% growth rate triggered crisis conditions in 2008. After a sharp, but short term spike in money supply growth after the ECB made emergency liquidity facilities available to European banks to mitigate the fallout from the US housing bubble implosion, crisis conditions promptly returned when these facilities expired and money supply growth fell to around 1% in 2011. Although recent surveys show that lending standards in the euro area have eased considerably, bank lending growth remains quite anemic. Lending to non-financial corporations recently grew at just 1.75% y/y, while lending to households grew at approx. 2.6% y/y. Total bank credit growth (incl. lending to governments and other loans) amounted to 3.5% y/y, which is quite similar to recent bank credit growth in the US (3.4%). In other words, most of the expansion of the money supply in recent years can be ascribed to QE – and the ECB has halved the size of its asset purchase program again to EUR 15 billion per month as of October and plans to discontinue new purchases entirely at the end of this year (at the peak, it bought EUR 80 billion in securities per month). |
Euro Area M1 TMS Euro area, M1 (~TMS-2): Total in millions of EUR (blue line) and y/y rate of change (orange line). - Click to enlarge We have highlighted the three most recent slowdowns in money supply growth associated with economic crises and declining asset prices. In 2000, a slowdown to 5% annualized growth was sufficient to trigger an economic downturn in concert with a recession in the US after the technology mania ended. It not certain yet where the threshold will be this time, but there are already some indications that it may be at a higher level than in 2008 and 2011. The current growth rate of 6.8% is still quite brisk, but it is down from more than 14% at the peak in 2015 and this downtrend is almost certain to continue. |
| Reinvestment of the proceeds from maturing bonds will continue so as to prevent the ECB’s balance sheet from shrinking, but a stagnating balance sheet is materially different from an expanding one. Based on the growth in bank loans and the concomitant slowdown in QE, we concluded a few months ago based on a rough estimate that TMS growth in the euro area was likely to fall to less than 5% y/y by the end of the year. We still believe this is likely to happen sometime between December and February.
It all depends on contingent circumstances – and while European banks have greatly improved their capital ratios, many are still weighed down by large legacy NPLs. Stricter capital adequacy regulations are proving to be a considerable obstacle to bank credit expansion as well. |
Euro Area TMS end November preliminary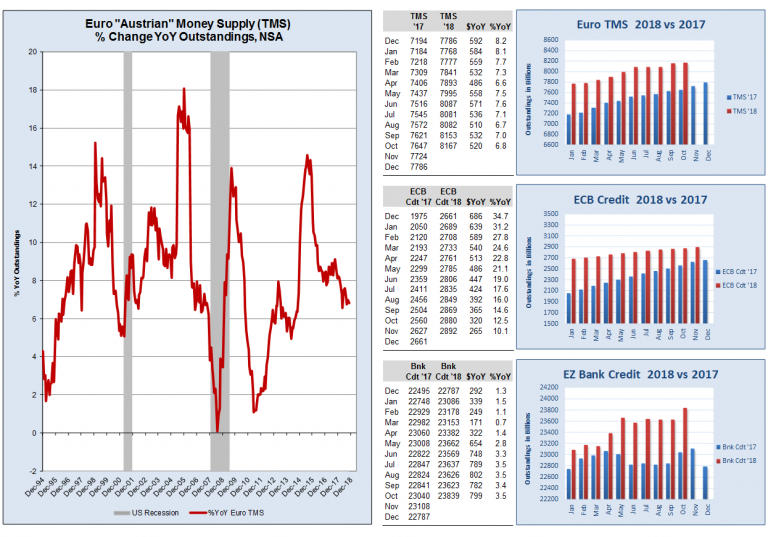 - Click to enlarge |
| Another impediment to credit growth is the recent weakness in economic performance, which was presumably at least in part triggered by faltering confidence due to the pending “Brexit” and the spat between Italy and the EU Commission over the country’s draft budget. This is illustrated by the Citigroup economic surprise index depicted below – positive surprises predominated in 2017, but this has changed significantly in 2018.
Currently there is nothing that suggests that the slowdown in money supply growth will reverse anytime soon – on the contrary. ECB spokespersons are at pains to reassure everyone that the central bank’s policy remains accommodative, which is certainly true considering its NIRP/ZIRP policy mix remains firmly in place. Stressing this point will also make it easier for the ECB to quickly revert to an easing bias. However, we think it will only do that in reaction to the wheels coming off the wagon. Readers should also keep in mind that the same could have been said of the BoJ in the 1990s and 2000s – its policy remained accommodative even when it temporarily suspended QE, and yet, it was unable to accelerate money supply and credit growth, as both the banking industry and borrowers were eager to reduce their credit exposure. |
Eurozone - Citi Economic Surprise Index, Jan 2016 - Nov 2018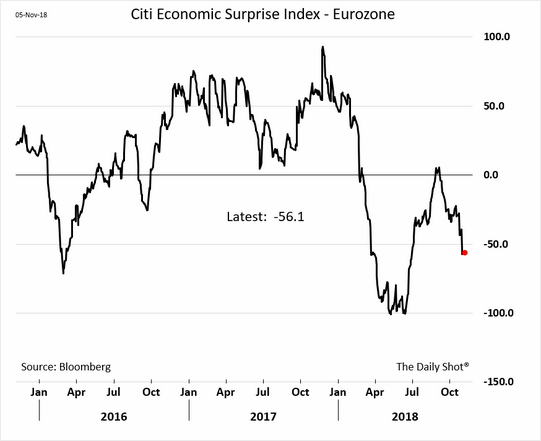 Citigroup economic surprise index for the euro area – 2018 has proved to be quite a disappointment on the economic data front. - Click to enlarge |
Japan – “Stealth Tapering” and the Sword of DamoclesBy introducing the damn-the-torpedoes-full-speed-ahead QQE program, Bank of Japan governor Haruhiko Kuroda managed to do what no other BoJ governor was able to accomplish before him since the bursting of the bubble in the early 1990s: he pushed Japan’s true money supply growth above the level of 6% y/y. But just as happened to his predecessors, he is now forced to acknowledge that taking his foot even a little bit off the gas pedal is all it takes to reverse this growth spurt again. In Japan we also use M1 as a proxy for TMS, although we have some reservations about this measure.* Nevertheless, it is a better measure than the broad money supply aggregates published by the BoJ, as it does not double-count money. Moreover, it is in fact well aligned with Frank Shostak’s money AMS measure for Japan with respect to direction and turning points.
|
Japan M1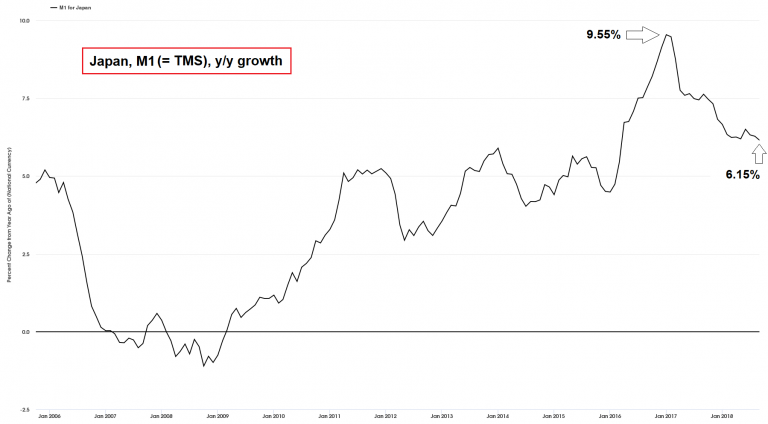 QQE has pushed Japan’s money supply growth to a multi-year high in early 2017. Prior to this expanded QE program, growth rates in the 5% to 6% range usually marked peaks, as banks and borrowers alike were cutting back on outstanding credit. In the meantime the y/y growth rate has slipped back to 6.15% – still hefty by Japanese standards, but the trend is now pointing down. - Click to enlarge |
| The BoJ could not fail to notice that its QQE program had a number of drawbacks – one of them was that the Japanese government bond market essentially became paralyzed. It eventually decided to switch from buying a fixed amount of 80 trillion yen in JGBs every month to a policy of “controlling the yield curve”, or keeping the 10-year JGB yield between 0 and 0.1%.
As numerous articles at Bloomberg have reminded us in recent months, this has led to a kind of “stealth tapering”, as the BoJ’s JGB purchases have steadily decreased since then. Here is a recent chart illustrating the situation: |
BOJ's Stealth Tapering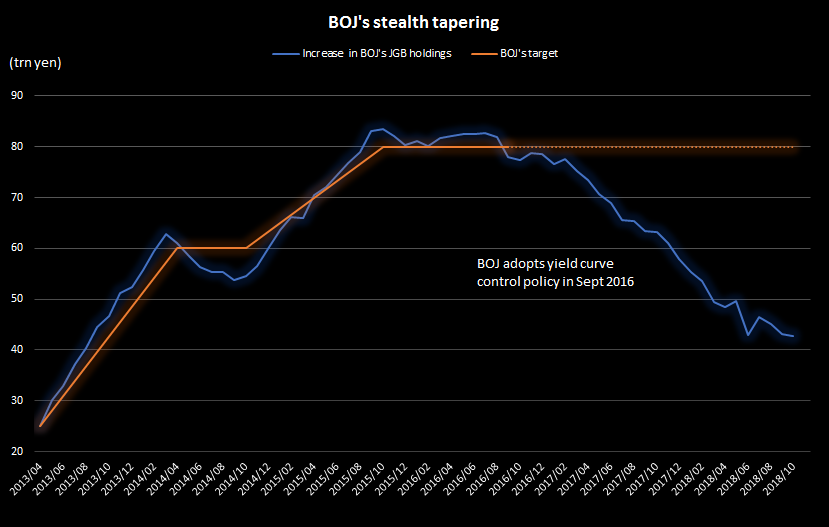 Actual JGB purchases by the BoJ (blue line) vs. purchases originally planned under QQE (orange line). - Click to enlarge |
| Once again the relationship between central bank activity and money supply growth was quite direct (i.e., there was very little time lag), something we have observed in all currency areas in which QE policies were enacted. Funny enough, Japanese banks are not really all that reluctant to lend – they are just not lending much in Japan (with the exception of real estate-related lending, which has grown quite a bit). Instead they have become even greater funding sources for the rest of the world than they already were previously. |
Japanese Data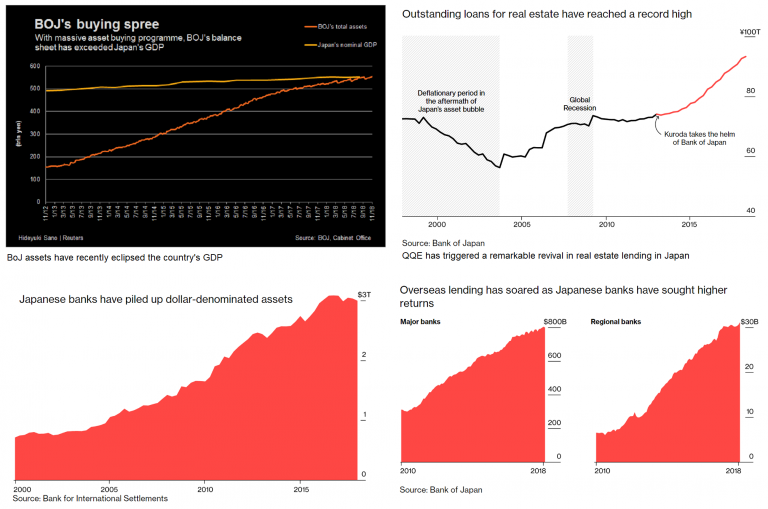 A number of remarkable data: recently the BoJ’s balance sheet has eclipsed the country’s GDP; real estate lending in Japan has grown rapidly; and so has lending to overseas clients, with both large international and regional banks in Japan amassing US dollar-denominated assets in size. - Click to enlarge |
| Readers may recall that the BoJ ended a previous QE program rather abruptly in 2006, shrinking its monetary base by almost 25% practically overnight. At the time we were surprised how little attention was paid to this maneuver. Later on we began to suspect that it was probably no coincidence that home prices in the US peaked right around the same time.
Clearly the yen carry trade was impaired by this sudden withdrawal of QE, which was inter alia reflected by a rapid decline in money supply growth. Of course, at present the BoJ is far from cutting back on anything – so far it has merely slowed the pace of its JGB purchases somewhat. But the pile of USD-denominated assets held by Japanese banks has become so large that it hangs over the markets like the sword of Damocles. It may not take much for it to fall.
|
 King Dionysius shows the courtier Damocles his sword levitation trick, to demonstrate to him that one is constantly in peril as a king. According to Wikipedia, today the anecdote is “used to denote the sense of foreboding engendered by a precarious situation, especially one in which the onset of tragedy is restrained only by a delicate trigger or chance”. - Click to enlarge |
China – Downtrend in Money Supply Growth ContinuesWe recently discussed the situation in China in some detail (see “Eastern Monetary Drought”, which includes additional charts and background information), so we will only show an update of the y/y growth rates of M1 and M2 here. Since our last missive, y/y growth in M2 has essentially remained stuck near a 20-year low of ~8.72%, while y/y growth in M1 has dipped below 4% for the first time since 2015. |
China M1 and M2 growth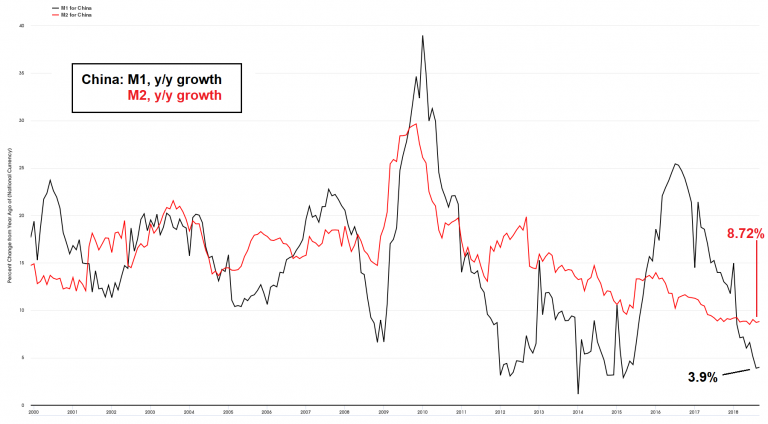 Year-on-year growth rates in M1 (black line) and M2 (red line) in China – historically these growth rates are remarkably slow. - Click to enlarge |
Evidently, no serious reflation efforts are underway as of yet, although the PBoC has cut minimum reserve requirements several times this year and is frequently seen injecting short term liquidity to keep repo rates under control. Recently chatter about an imminent rate cut has become more insistent. Over the past few days it has intensified, as the rally in the yuan on the heels of the talks between Donald Trump and Xi Jinping was seen as giving the PBoC more leeway to ease.
So far, said rally was a one-day wonder and we are not sure whether a rate cut will actually do much to reverse the trend. Besides, as we always point out, the effects of the slowdown in money supply and credit growth have not fully played out yet – a sizable lag is to be expected. For example, by the time the full effects of the slowdown from 2014 to early 2015 were felt around the world, growth in China’s M1 had already reversed back up again and was rising steeply.
Conclusion
In summary we can say that although y/y money supply growth in the euro zone and Japan is still fairly strong for the moment, the trend is definitely no longer supportive. Not surprisingly, we have recently not only seen weakness in stock prices, but also fairly sharp breakouts in credit spreads, as positive arbitrage effects are beginning to dissipate.
Credit markets in particular were benefiting from the ECB’s corporate bond buying program. As we have pointed out in past articles on credit spreads, the fact that spreads in the euro area had begun to rise while US credit spreads were still trading close to their lows constituted a warning sign, as the former have been leading the latter for quite some time.
In short, the markets are facing a far more profound problem than just the question of whether the trade dispute can be resolved to everybody’s satisfaction, or whether a smooth Brexit can be achieved or whether the conflict over Italy’s budget will be settled amicably.
For some reason many people seem to completely ignore the Fed’s QT operation and the cutback in central bank support elsewhere, but this is precisely what one should focus on. As we have stressed for a long time, money supply growth is the most important fundamental datum for overvalued risk assets. Everything else is just decoration.
Footnote:
*In particular, the BoJ only counts only deposit money belonging to members of the private non-financial sectors as part of M1 – which means that non-bank financial intermediaries are excluded (Frank Shostak’s money AMS measure for Japan exhibits considerably greater volatility – unfortunately we don’t have the resources and/or time required to obtain the data he has access to).
Charts by ECB, Michael Pollaro, the Daily Shot (WSJ), St. Louis Fed, Bloomberg
Full story here Are you the author?
Tags: central-banks,Chart Update,newsletter


