


Pater Tenebrarum
My articles My siteAbout meMy videosMy books
Follow on:TwitterSeeking AlphaFacebook
A Well-Established TraditionSeemingly out of the blue, equities suffered a few bad hair days recently. As regular readers know, we have long argued that one should expect corrections in the form of mini-crashes to strike with very little advance warning, due to issues related to market structure and the unique post “QE” environment. Credit spreads are traditionally a fairly reliable early warning indicator for stocks and the economy (and incidentally for gold as well). Here is a chart of US high yield spreads – currently they indicate that nothing is amiss: It is fair to say that the current level of US high yield spreads is not what one would expect to see prior to a big decline in stock prices. Since we are apparently a very early leading indicator, we already discussed in late 2017 what signals one should look for in HY spreads in order to avoid getting caught in a sudden stock market revaluation exercise (see: “The Coming Resurrection of Polly”). This heads-up (and several updates since then) was inter alia inspired by the fact that for the first time in history, credit spreads had begun to deviate rather noticeably from the trend in corporate leverage. This unusual divergence has widened even further since then. We pointed out at the time that in light of “QE” by major central banks “it is quite possible that future developments will continue to diverge in a number of respects from historical experience. In short, we may not get the warnings we usually get before euphoria turns to panic.”
|
US High Yield Spread, 1997 - 2018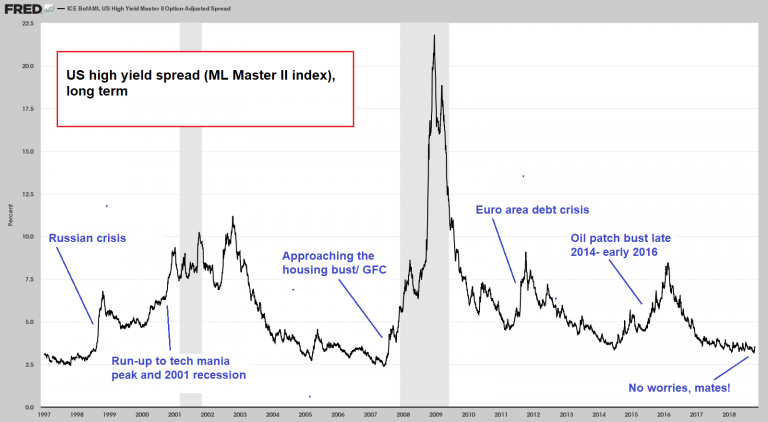 As this chart shows, credit spreads do as a rule warn of impending problems for the stock market, the economy or both. - Click to enlarge Not every surge in spreads is followed by a bear market or a recession, but some sort of market upheaval is usually in the cards. Since the stock market normally peaks before the economy weakens sufficiently for a recession to be declared, the warnings prior to market tops are often subtle – usually all one gets is a confirmed breakout over initial resistance levels, at which time yields will still be quite low. At the moment credit spreads suggest that nothing untoward is expected to occur for as far as the eye can see (a.k.a. the near future). Will something intrude on that enviable and stress-free combination of Nirvana, Goldilocks and the Land of Cockaigne, where everything seems possible, especially good things? Will Santa Claus remain a permanent fixture of the junk bond and stock markets, handing out gifts to all those prepared to spice up their portfolios with bonds bereft of covenants and light in yield, triple-digit P/E stocks, or even CUBE stocks (=completely unburdened by ‘E’)? Perhaps Fisher’s permanent plateau has materialized 90 years later than originally envisaged, but we don’t think so. |
Impaired Advance Warning FunctionThe question is if this also applies to the leading indicator function of credit spreads. After giving some more thought to this, we have come to the conclusion that waiting for high yield bonds to conveniently crack and provide advance warning of a future stock market decline may not be the best idea. Below is an updated comparison between US and euro area HY spreads. The pronounced widening in US HY credit spreads during the oil patch bust from late 2014 to early 2016 was mimicked by euro area spreads as well, but they didn’t widen as dramatically. Subsequently euro area junk bond yields and spreads became leaders to the downside, egged on by the ECB’s decision to make its asset purchase program more interesting by adding corporate bonds to the list of things to be monetized. We already noted on a previous occasion that euro area junk bonds may continue to lead now that their trend has changed. |
US and Euro Area Spreads Compared, Sep 2016 - 2018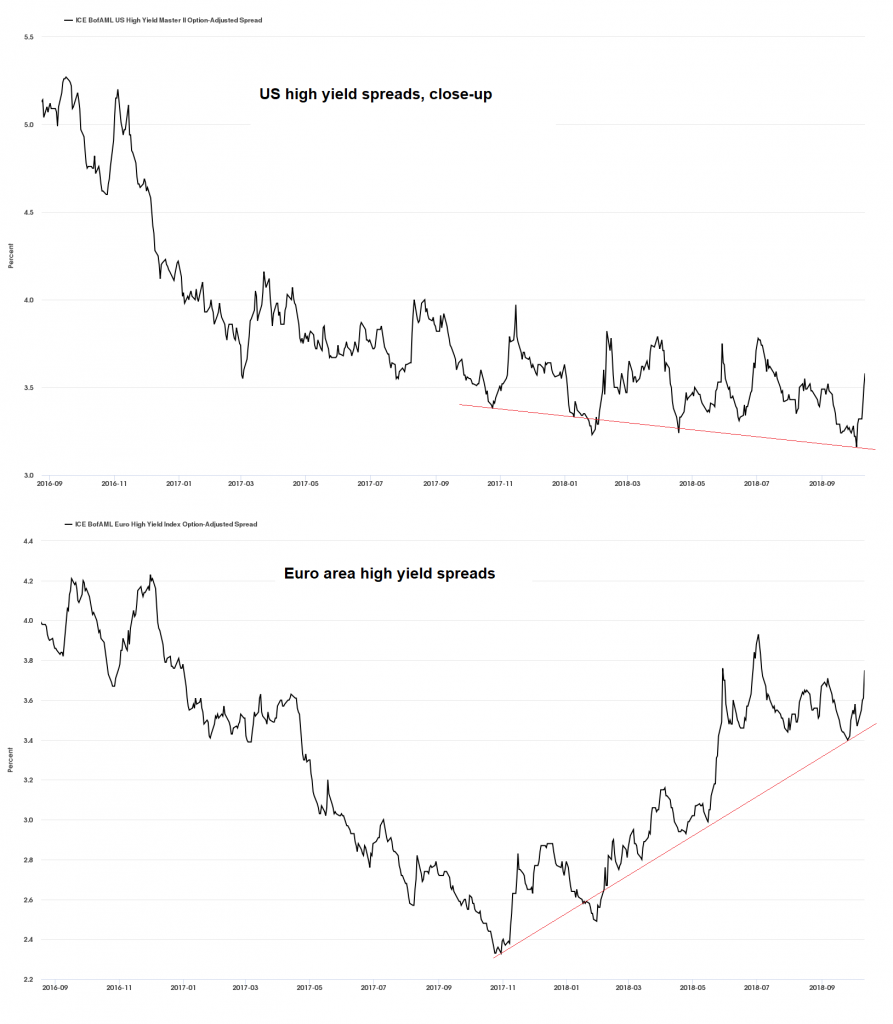 US vs euro area junk bond spreads. Since putting in a low in late October 2017, the latter have steadily widened, while the former have continued to tighten. - Click to enlarge Historically, HY credit spreads of these two regions were very closely aligned. During the housing boom, they even tracked each other quite closely in absolute terms. Significant divergences are rare and tend to occur at peaks rather than lows. In fact, divergences around peaks were immensely useful and timely as “all clear” signals helping to identify major lows in US and European stock markets. There is actually no precedent for such a pronounced divergence near multi-year lows, but we would hazard that it is probably not a good sign. |
| There is more to these divergences though than just the differences between Fed and ECB “QE”. For one thing, Europe’s sovereign benchmark is the German Bund, which yields a paltry 0.5% (as an aside, Italian government bonds are essentially trading like junk bonds now). The composition of the US high yield universe may be even more relevant though. In the course of the shale oil boom, energy companies became the largest issuers of junk bonds in the US. Ever since their fortunes have a pronounced impact on the performance of the aggregate junk bond yield reflected by US HY indexes. QED:
Crude oil futures remain in backwardation, which indicates that the markets perceive supplies to be tight. Global demand growth is not likely to be the culprit, as the US is pretty much the only major economic area in which noteworthy GDP growth momentum has been in evidence of late. Recent oil price strength is more likely driven by concerns over supply; the markets are trying to price in the expected impact of renewed sanctions on Iran. Sanctions on oil exports are supposed to kick in from the beginning of November. There may be a “sell the news” reaction at first, but thereafter the markets will have to assess how big the impact will actually be. |
US HY Inverted vs Crude Oil, Jan 2014 - Sep 2018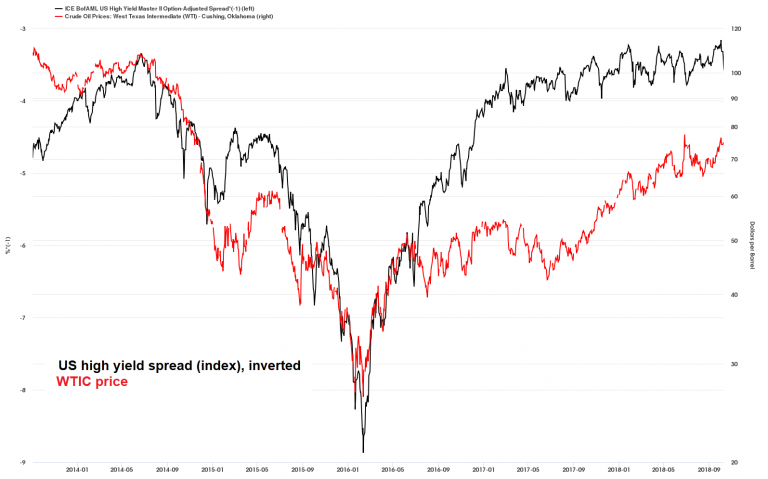 This chart shows the inverted US HY spread (black line) vs crude oil prices (red line). Evidently, there is a very pronounced negative correlation between US HY spreads and oil prices. - Click to enlarge |
| Some oil market analyists reportedly estimate that the shortfall could amount to up to 1.5 million bbl./day (around half of Iran’s crude oil exports), which is not exactly chickenfeed. In a way this reminds us a bit of the 1970s, when oil prices were inter alia also boosted by geopolitically motivated supply restrictions.
Back then, stock markets weakened and economic growth faltered in concert with rising oil prices. All things considered, it is conveivable that the response of US HY spreads to a deterioration in economic confidence will be dampened and/or delayed if oil prices remain firm due to supply concerns (a side note: Venezuela’s oil output has plummeted to a 30 year low this year). Tightness in US HY spreads is the result of a mixture of yield chasing (induced by central bank policies) and the belief that the US energy sector is in good shape as long as oil prices remain strong. However, the fracking industry as a whole was reportedly unable to generate positive free cash flows for many years – not even a price of $75/bbl. may be high enough to change that. Thus many fracking companies depend on the willingness of junk bond buyers to constantly refinance their debt, and/or on stock market investors to support their equity placements. In short, the US HY sector is in a self-referential feedback loop at the moment. |
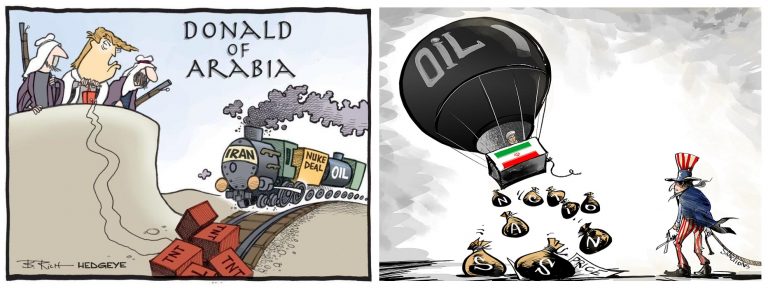 Up, up and away… US sanctions are expected to decrease Iran’s oil exports substantially. The markets are trying to price the shortfall in. - Click to enlarge |
Junk Bond Supply ConsiderationsThe other side of the coin is that the volume of junk bonds maturing this year is very low. Next year there is a considerable jump (to more than $200bn), but that still pales compared to the daunting wall of maturities lying in wait between 2020 and 2024 (see this chart from “Stock Market Manias of the Past”). This year and next year should be quite tame in terms of supply, ceteris paribus. As we recently pointed out, the ceteris may not remain paribus (in “Corporate Credit – Risk Perceptions vs Actual Risk”), because around 50% of investment grade corporate bonds are rated BBB – a single notch above junk. A lot of this debt is bound to be eventually downgraded, as the average net debt/EBITDA ratios of BBB-rated companies are already way beyond levels that used to be considered acceptable for investment grade ratings. When that happens, the high yield segment will be flooded with unexpected new supply. That is certainly a potential trigger for a future surge in junk bond yields and spreads. The prospective number of downgrades will largely depend on the performance of the economy, but companies in this rating category are already on extremely thin ice given their historically high leverage.
Conclusion – A Possible Role ReversalIn view of the above, it seems at the moment actually more likely that a stock market decline will put pressure on junk bonds, instead of weakness in junk bonds providing advance warning of an impending stock market decline. The stock market sell-off in the past week did in fact very slightly lead a surge in high yield spreads. As an aside, one indicator we suspected might fail to deteriorate ahead of a sell-off did after all come through with a subtle advance warning, namely the cumulative NYSE advance/decline line. It topped in late August, which was followed by a lower secondary peak in late September. This created a divergence with the index (more on this and the behavior of other market internals soon). |
US HY Spreads vs Stocks, Jun 2017 - Oct 2018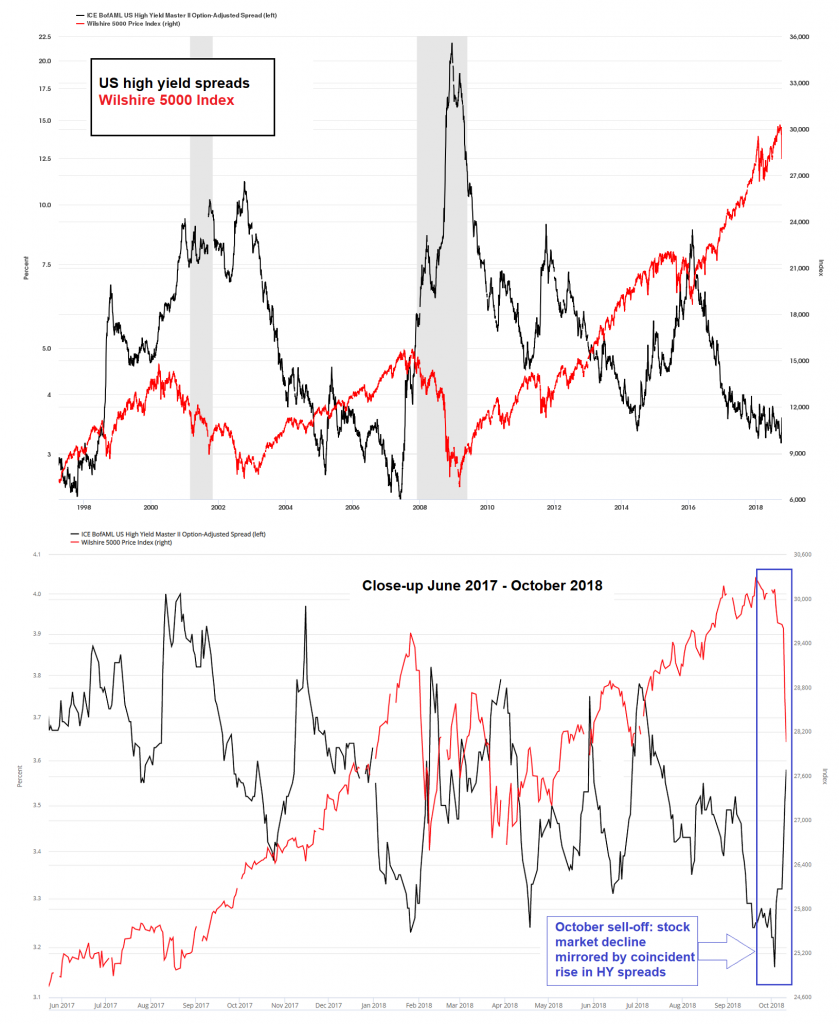 US high yield spreads and the Wilshire 5000 Index – as the long term chart illustrates, spreads as a rule tended to widen ahead of past stock market declines, and the trend usually accelerated once a fall in stock prices was underway. - Click to enlarge The most recent decline in stock prices happened almost concurrently with rising junk bond spreads. If one looks closely, it seems the bond market was surprised by the weakness in stocks and reacted to it with a slight lag. Since the weakness in the stock market doesn’t amount to much yet – so far it was a swift, but still relatively small correction – this does admittedly not prove anything yet, but it certainly doesn’t invalidate our idea either. |
Charts by: St. Louis Fed
Full story here Are you the author?Tags: Chart Update,Credit Markets,newsletter,The Stock Market


