


Pater Tenebrarum
My articles My siteAbout meMy videosMy books
Follow on:TwitterSeeking AlphaFacebook
Federal Reserve Credit Contracts FurtherWe last wrote in July about the beginning contraction in outstanding Fed credit, repatriation inflows, reverse repos, and commercial and industrial lending growth, and how the interplay between these drivers has affected the growth rate of the true broad US money supply TMS-2 (the details can be seen here: “The Liquidity Drain Becomes Serious” and “A Scramble for Capital”). |
 The Fed has clearly changed course under Jerome Powell – for now, anyway. |
| Our friend Michael Pollaro* recently provided us with an update on outstanding Fed credit. As there are no longer any outstanding reverse repos with domestic banks, the liquidity drain is accelerating of late, with growth in net Fed credit contracting at fairly rapid rate of 3.4% year-on-year in September, the fourth consecutive month of decline: |
The year-on-year contraction in net Fed credit accelerates.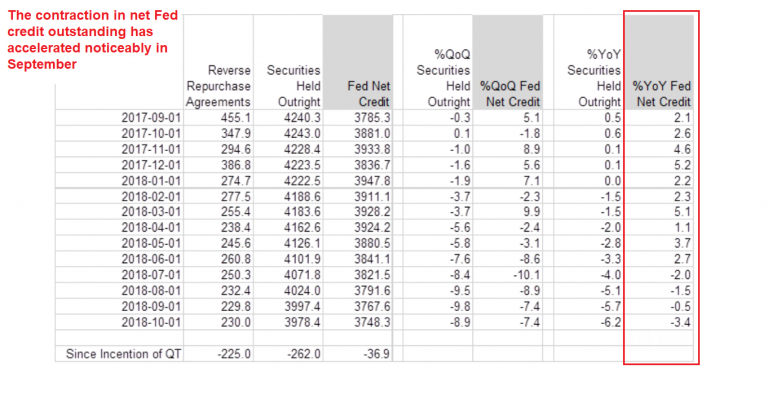 - Click to enlarge Since there are no longer any outstanding reverse repos with domestic financial institutions, the only force counteracting the negative effect on money supply growth is inflationary bank lending. |
| Michael also sent us a chart comparing the monthly trend in total net Fed credit in the course of 2017 with the trend in 2018 to date. When “QT” started in September of 2017, outstanding Fed credit initially kept growing well into 2018, largely because reverse repos with US banks ran off faster than securities held by the Fed decreased – but that has changed quite noticeably in the meantime:
Keep in mind that the reverse repos mainly served to alleviate growing delivery fails due to a shortage in certain off-the run treasury securities which banks needed as collateral. As the Fed has stopped reinvesting all proceeds from maturing treasuries and MBS, banks no longer need to borrow securities from its portfolio. |
Fed credit in 2017 vs. 2018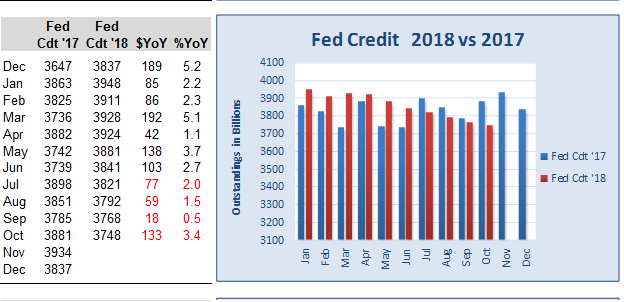 The downtrend becomes more pronounced. - Click to enlarge |
| The markets evidently never “missed” the liquidity tied up in these reverse repos, not least because high quality treasury collateral serves as a kind of secondary medium of exchange in repo markets, where it supports all kinds of other transactions. With net Fed credit actually decreasing, an important threshold has been crossed. The effect on excess liquidity is more pronounced, which definitely poses a big risk for overextended financial markets.
As an aside to this, bank reserves have in the meantime declined by roughly USD one trillion from their 2014 peak, but remain far above the amounts required to support the deposit liabilities of US banks. The main effect of the decrease is that the amount of fiduciary media (uncovered money substitutes) in the system is rising, but reserves are definitely not a constraint on inflationary bank lending. Once the temporary effect of repatriation flows on the domestic US money supply abates, bank lending growth will be the only force counteracting the effect of the Fed’s liquidity drain on the broad money supply. |
Reserve Balances and Covered Money Substitutes 2007-2018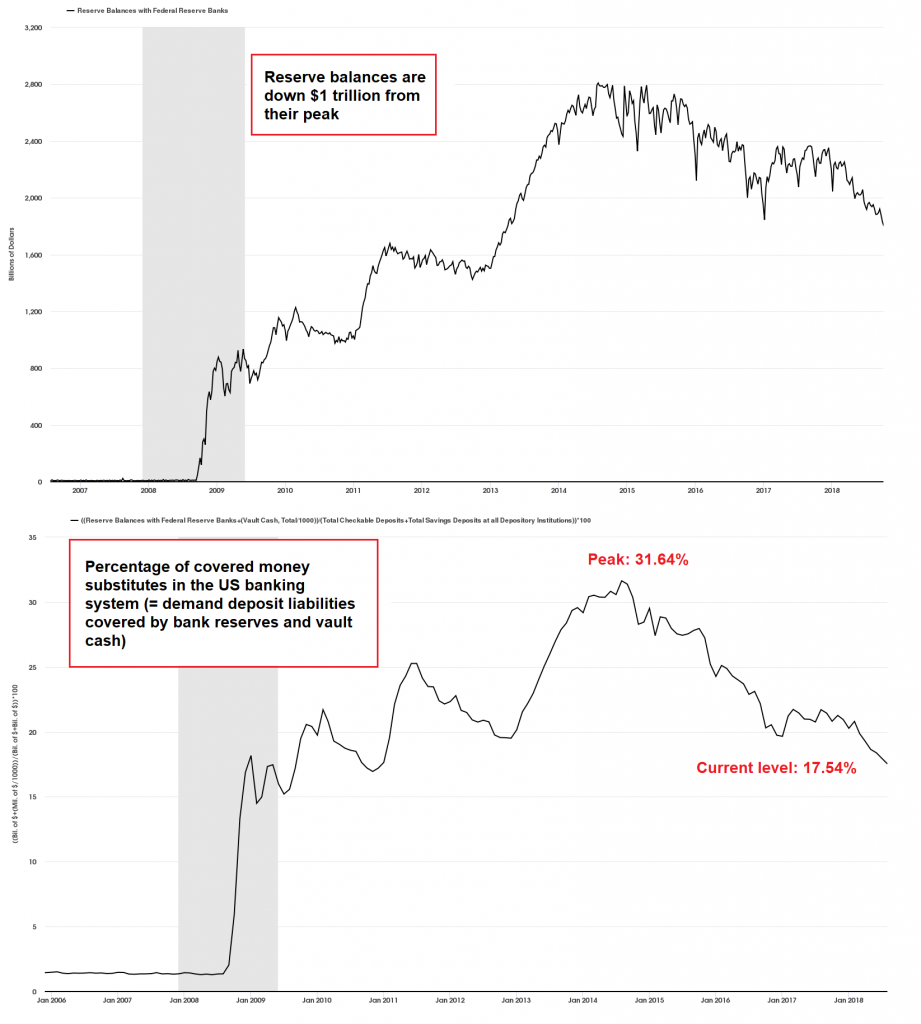 - Click to enlarge Bank reserves are down quite a bit (and the monetary base has declined accordingly), but the main effect of this was to reduce the percentage of deposit liabilities in the banking system consisting of covered money substitutes. This increases risks for depositors somewhat, but is not a constraint on bank lending – one only has to consider the paltry amount of bank reserves that supported the credit bubble leading up to the 2008 crisis. |
| The main constraint on bank lending these days are capital requirements, which have become a great deal more stringent under Basel III. We would add to this that a number of large international banks (particularly European ones) remain very cautious with respect to credit expansion, and with good reason. As the recent upheaval in emerging markets (particularly in Turkey) and in Italian bond markets demonstrates, they continue to face considerable risks.
Not surprisingly, the economic area in which banks are most willing to lend is the US – but even US bank lending growth is paltry compared to what is considered “normal” in boom times, and may be about to falter again from a lower peak. Consider the sharp dip in commercial and industrial bank loan growth last month. Interestingly, while consumer loan delinquencies remain fairly high, business loan delinquencies have actually declined quite noticeably over the past 18 months. Business confidence is high and lending standards have continued to ease – and yet, recently C&I loan growth is faltering anyway. |
US commercial and industrial bank lending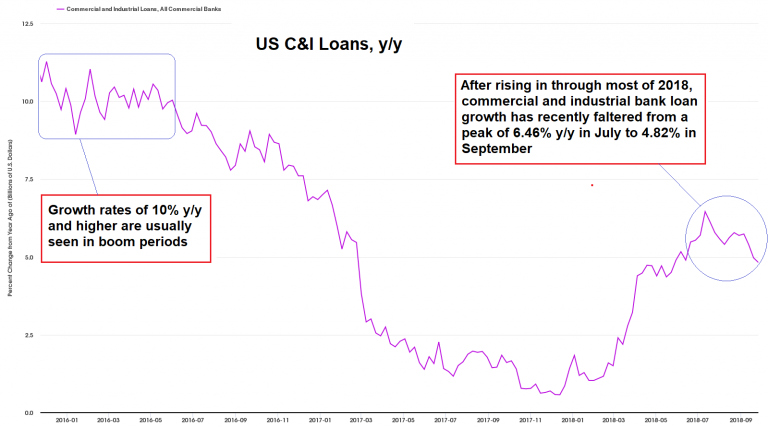 - Click to enlarge US commercial and industrial bank lending y/y growth rate: after rising from a low just below 1% y/y in December 2017 to 6.46% in July 2018, C&I lending growth has recently decreased again to 4.82% y/y – far below the 10%+ growth rates usually seen in boom periods. |
US True Money SupplyUnfortunately the money supply data for September are not available yet – as of August, the US broad true money supply was still growing at roughly 4.7% y/y, but we suspect that a decline in this growth rate will be reported in September. The y/y growth rate of the narrow aggregate M1 already decreased to 3.92% in August, one of the lowest readings of recent years. Similar low points in M1 growth were last seen in August 2008, July 2010 (in the pause between QE1 and QE2) and in February 2016. Normally the growth rate of M1 tends to lead growth in TMS-2, but after they peaked concurrently in October/November 2016 (note: this was just an interim peak in a longer term declining trend) these roles reversed, as M1 growth proceeded to decline more slowly from there. This has changed in the meantime, as growth in M1 has recently slowed sharply, catching up with the slowdown in TMS-2 growth. It also seems that the trend in the growth rate of the narrow money supply has lately “synced up” with the accelerating decline in assets held by the Fed. For a variety of reasons this was not always the case in recent years. |
Fed assets in USD million and y/y growth in M1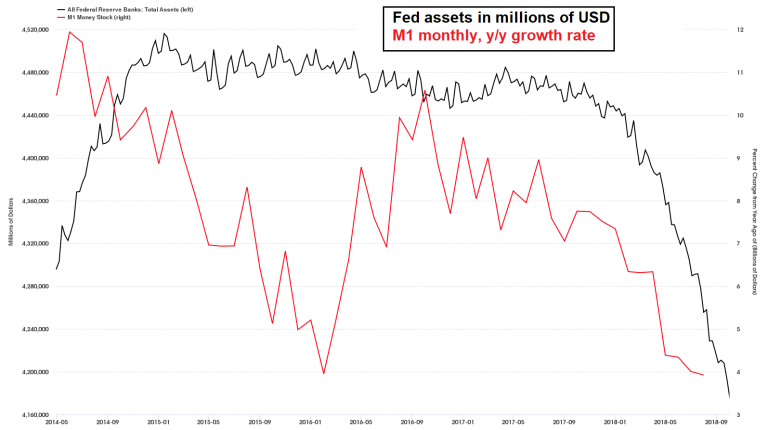 - Click to enlarge Fed assets in USD million (black line, left hand scale) and y/y growth in M1 (red line, rhs). Recently the trend in M1 growth has “synced up” with the slowdown in TMS-2 growth and the decline in Fed assets. M1 growth has slowed to 3.9% y/y. |
| The following chart shows the y/y growth rate of TMS-2, its 12-month moving average and the y/y growth rate in total US bank credit. The latter has actually weakened again in August, to just 3.8% y/y. It is fair to say that inflationary bank lending is currently not contributing much to money supply growth. In fact, total US bank loan growth is around two thirds lower than it was in the housing boom period between 2002-2008.
A major reason why TMS-2 growth is somewhat higher continues to be the Treasury’s General Account at the Fed, which reflects over-issuance of t-bills to accommodate repatriation flows. There were two such phases – the first one coincided with the introduction of new money market fund regulations, which led to MM funds moving eurodollars to the US and purchasing t-bills. Since MM funds were primarily buying commercial paper issued by European banks, this activity led to the TED spread widening quite sharply at the time. In the meantime this has been digested and the TED spread has tightened to more normal levels again (i.e., it does not indicate any stress in the banking system). |
TMS and total bank lending growth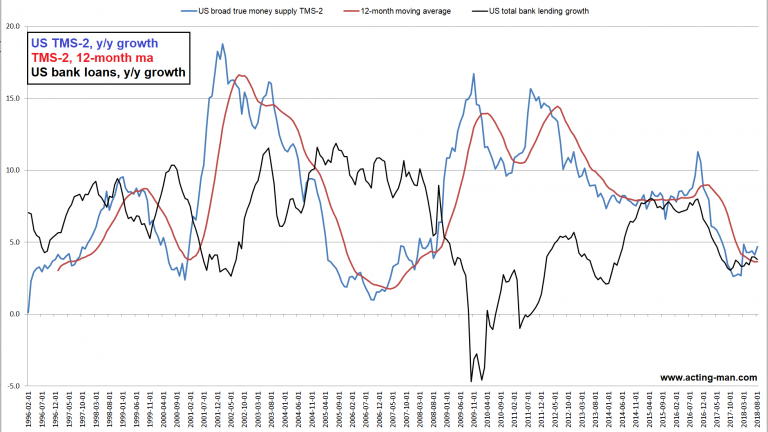 Year-on-year growth in TMS-2 (4.7%), the 12-month moving average of TMS-2 growth (3.7%) and year-on-year growth in total US bank credit (3.8%). - Click to enlarge |
| The repatriation of cash by non-financial corporations by contrast mainly pushed up USD borrowing costs for European corporations, as Apple, Oracle and others were major buyers of CP issued by European non-bank companies. Since repatriated funds are initially deposited with money market funds before they are deployed (for stock buybacks, dividends, capex, etc.), demand for t-bills by MM funds has surged again.
Repatriation by companies is reportedly still underway, but the effect will ultimately be a “one-off”, just as the first repatriation wave by MM funds was. The large Treasury deposits with the Fed should therefore decrease again – but the money will of course remain part of the domestic money supply, as it will then show up in private bank deposits (some of it may find its way back overseas again through different channels). Incidentally, the drawdown of Treasury deposits at the Fed should slow down the QT-driven decline in bank reserves (or even reverse it temporarily). Memorandum items such as the Treasury’s General Account are not included in monetary aggregates such as M1 or M2, but they clearly represent money and are therefore included in TMS-2. The Treasury will spend this money (most of the recently accumulated funds will presumably be used to redeem t-bills). By contrast, bank reserves are excluded from both TMS-2 and other monetary aggregates. Bank reserves are as a rule not “spent” – they are either lent out in interbank markets to banks that are short of reserves (though not as long as interest paid on reserves exceeds the effective federal funds rate, but that may be on the verge of changing), or alternatively they are converted into currency if bank customers withdraw demand deposit money. Although reserves can potentially become part of the money supply if/when they are paid out to bank customers in the form of bank notes, the concomitant decrease in deposits should at the same time lead to credit contraction. The money supply should therefore not grow – on the contrary, in a fractionally reserved system a decrease in demand deposits and reserves will tend to contract the money supply (of course this won’t necessarily be the case as long as there are large amounts of excess reserves). |
US Treasury General Account at Federal Reserve 2005-2018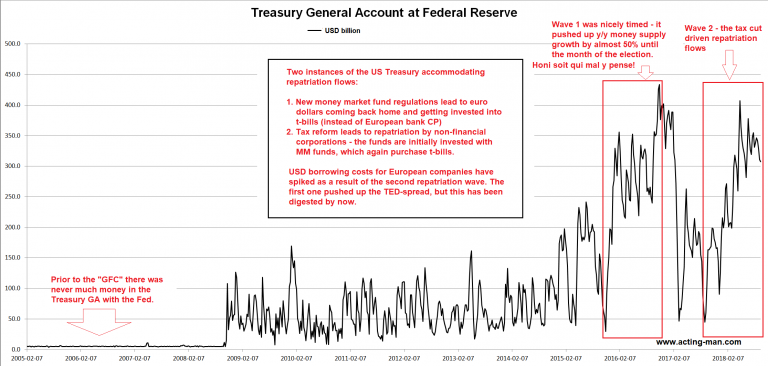 - Click to enlarge Treasury deposits at the Fed – the two highlighted periods coincided with two repatriation waves. Judging from what has been published about the discussions of the Treasury’s advisory board, it appears that the Treasury accommodated these inflows by over-issuance of t-bills. The Treasury’s account at the Fed has become quite active since the “GFC”. Previously, only a tiny float of tax receipts was kept there, as the money was spent as fast as it came in (in the more distant past, the Treasury tended to hold this small float mainly in commercial bank deposits, but these amounts have become negligible). |
Conclusion
Given the accelerating decline in Fed credit as “QT” continues, anemic and apparently slowing bank credit growth and a recent sharp slowdown in the growth rate of M1, we expect that the slowdown in the growth rate of TMS-2 – which was briefly interrupted after bottoming at 2.7% y/y in February – will resume shortly.
Narrow money supply growth rates in the euro area (6.5% y/y ) and China (5.1% y/y) have recently also declined to new lows for the move (we plan to discuss these developments in greater detail soon). All over the world the monetary backdrop continues to become less accommodative, which is bad news for “risk assets” such as stocks and corporate bonds.
Although pockets of weakness are in evidence here and there, most US economic indicators nevertheless continue to look strong. This supports market sentiment, but the stock market remains extremely overvalued, while profit margins are probably as high as they will ever get.
We have previously discussed the market’s mounting technical and structural problems – we believe these are a direct result of the increasingly hostile monetary backdrop (i.e., there is no longer enough excess liquidity to keep all the plates in the air).
Addendum: Modified Ned Davis Method Gives Partial Sell Signal
Frank Roellinger** has informed us that the Modified Ned Davis Method has given a partial sell signal at the close of October 5 with the Russell 2000 index (RUT) at 1632.11 points, i.e., it has moved from 100% long to 50% long the RUT last week.
Footnote:
*Michael Pollaro regularly publishes statistics on the “Austrian” money supply of the G4 (US, euro area, UK and Japan). He has penned a highly recommended and very useful backgrounder on the Austrian School’s monetary aggregates with numerous links to further reading material that can be accessed at Forbes.
**Frank Roellinger has invented the Modified Davies Method, which is a systematic strategy that goes both long and short the Russell 2000 Index based solely on technical signals. The method has been highly successful in recent years. For background information see “The Modified Ned Davies Method” and “Reader Question on the MNDM”)
Charts, tables and data by: Michael Pollaro, St. Louis Fed and Acting Man
Full story here Are you the author?
Tags: central-banks,Chart Update,newsletter


