


Pater Tenebrarum
My articles My siteAbout meMy videosMy books
Follow on:TwitterSeeking AlphaFacebook
The Most Comprehensive Collection of Charts Relevant to Gold is HereOur friends from Incrementum (a European asset management company) have just released the annual “In Gold We Trust” chart book, which collects a wealth of statistics and charts relevant to gold, with extensive annotations. Many of these charts cannot be found anywhere else. The chart book is an excellent reference work for anyone interested in the gold market and financial markets in general. A download link for the chart book can be found at the end of this post.
|
Central Bank Policies Turn, 2003 - 2019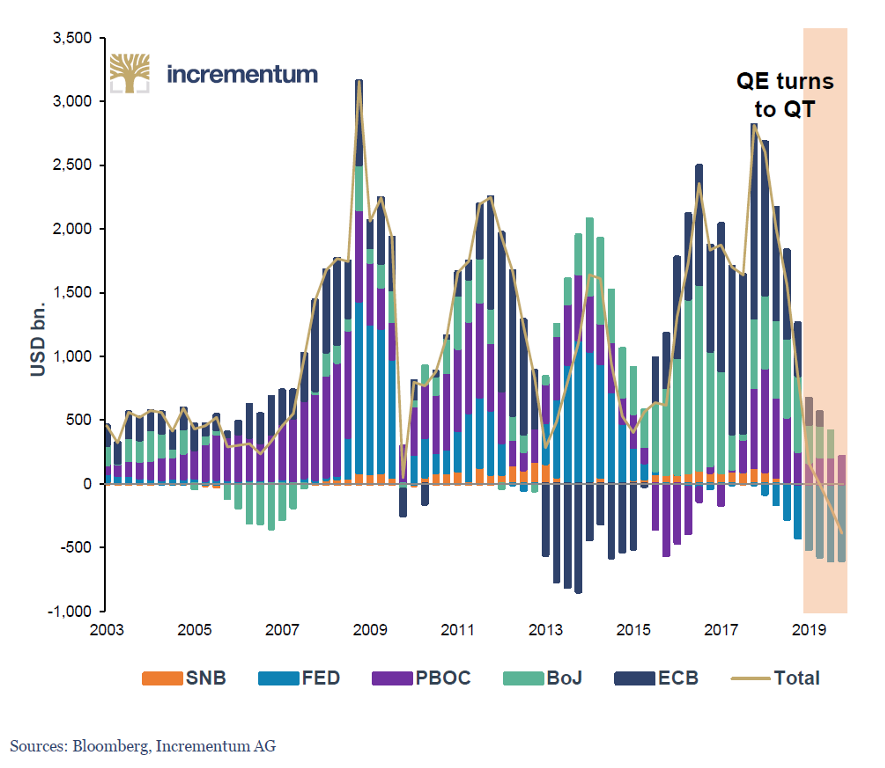 Turn of the tides: monetary expansion becomes monetary contraction - Click to enlarge |
| The chart book is based on the 2018 In Gold We Trust report (IGWT), but all charts and tables are updated and additional material has been added. The main theme of the 2018 IGWT report was the “turn of the monetary tides” – the fact that the era of extremely loose central bank policies is – at least temporarily – coming to a close. |
Federal Funds Rate and Gold, 1971 - 2018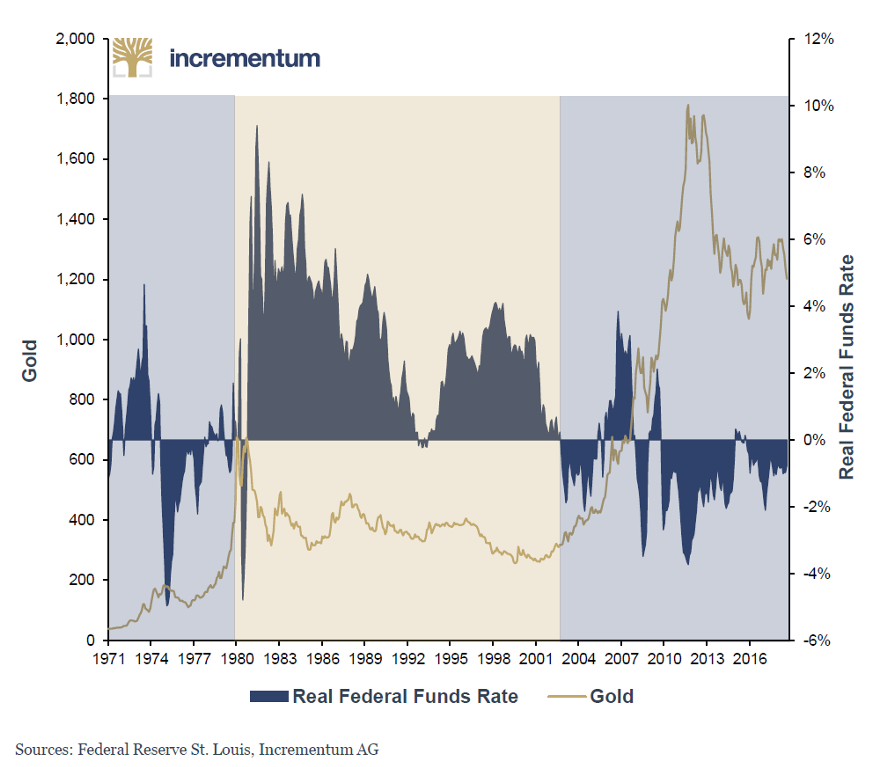 This chart shows the “real” federal funds rate vs. the gold price. We have discussed this topic extensively in these pages before – see: Gold and the Federal Funds Rate for the details. - Click to enlarge |
With respect to gold, these periods of policy tightening are a kind of “twilight zone”. On the one hand, the expectation of tighter monetary policy is weighing on the gold price; on the other hand, the markets are well aware that draining liquidity from the system will create the conditions for the next major monetary expansion, which will drive gold prices higher again.
Consider now the chart above: we are currently several rate hikes into the latest tightening cycle, and yet, the real federal funds rate is not even in positive territory yet. Admittedly, the same cannot be said for our favorite proxies for real interest rates, namely 5 and 10-year TIPS yields which are currently mildly positive and exerting pressure on gold.
The main point is though that central banks may feel compelled to return to expansionary policy well before they even get the opportunity to push real short term interest rates to clearly positive levels. Gold prices are likely to turn up with a vengeance once the markets perceive this to be the case.
For the moment there is still pressure on gold from a fundamental perspective, as the most important macroeconomic price drivers remain bearish. However, market positioning is already at extreme levels, which lends some support to prices in the short term. Moreover, fundamental conditions are poised at a precipice and can change very quickly in the metal’s favor. After all, tightening liquidity is primarily bearish for overextended “risk assets” and economic activity.
Without further ado, here is the download link for the chart book – enjoy!
Incrementum IGWT 2018 chart book (PDF)
Charts by Incrementum
Full story here Are you the author?
Tags: Chart Update,newsletter,Precious Metals


