


Keith Weiner
My articles My offerMy siteAbout meMy videosMy books
Follow on:LinkedINTwitterSeeking AlphaFacebookAmazonGoogle +
GDP – A Poor Measure of “Growth”Last week the prices of the metals rose $35 and $0.82. But, then, the price of a basket of the 500 biggest stocks rose 62. The price of a barrel of oil rose $1.63. Even the euro went up a smidgen. One thing that did not go up was bitcoin. Another was the much-hated asset in the longest bull market. We refer to the US Treasury. The spread between Treasury bonds and junk bonds narrowed this week. It is now close to its post-crisis low. While many would cheer this cheapening of the cost of credit to below-investment-grade issuers, we note two things. One, this enables them to borrow more to spend more and thus add to GDP. Two, this is not a recommendation of forcing down the cost of credit to marginal borrowers. It is a damning indictment of GDP as a measure. Whatever the word is, when there is an increase of borrowing to consume wealth, “growth” is not that word. Yet this is our world. This is held up as proof of a strong economy. I had a bizarre encounter on social media. I said that when the government borrows, it adds to GDP. An otherwise-free-market economist chimed in to say that it does not, and said that transfer payments are not included in GDP. |
BofA Merrill Lynch high yield master II option-adjusted spread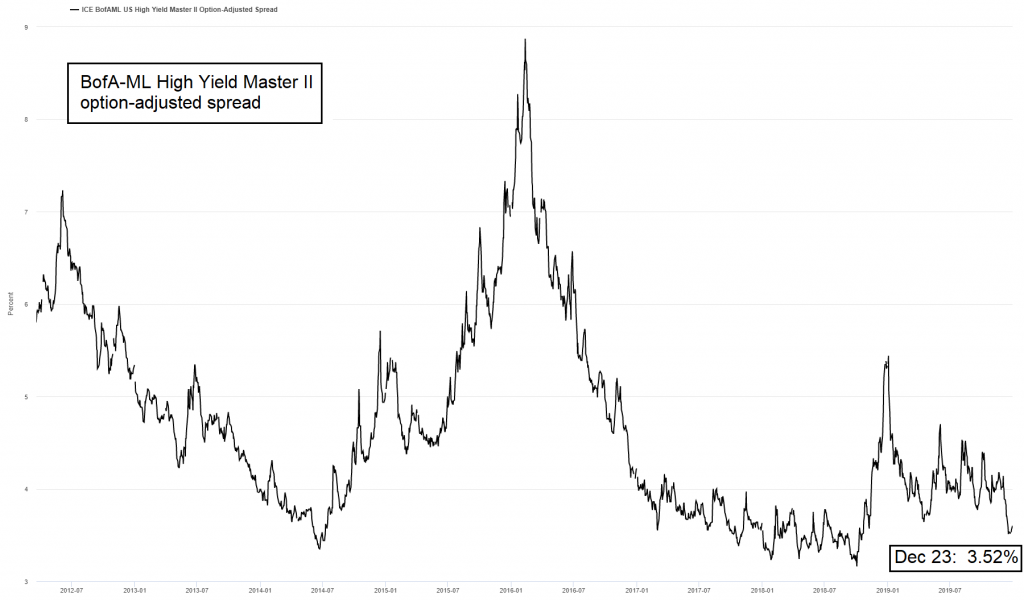 - Click to enlarge on Dec. 23 it tightened to the lowest level of 2019, fairly close to its post-crisis low established in 2018. This seemingly signals that risk is very small – in reality, risk is probably extremely high. [PT] |
|
Indeed, but if the government doles out $1,000 to Joe Six-pack, and Joe buys $1,000 worth of beer, that adds to GDP. Next, this otherwise-free-marketer quibbled that well Mark Millionaire spends less. It went round and round. And then it suddenly became clear. They cannot admit that borrowing to consume adds to GDP. For if they do, they concede the case against Fed GDP targeting. So to head that off at the pass, they have to deny this fact. How many of the companies rated below investment grade are zombies — which the Bank for International Settlements defines as profits < interest expense? It is not sustainable to borrow more to pay some of the interest expense. Not even if the interest rate keeps falling. This is just another mechanism of capital destruction. Though new capital is being produced by productive enterprises, capital is finite. No one can say when this process will blow up. But we can be certain that it will. We have been periodically checking on a marketing page, which keeps putting a date on it. And revising the date every six months, when Armageddon does not arrive on schedule. Today it says December 31. But check back in January to see it revised to June 30! Just because the financial system is offering bad deals, does not mean every newsletter offer is a good deal. |
 The land of zombies and cronies… there is a growing supply of both. [PT] |
Gold and Silver PricesLet us look at the only true picture of the supply and demand fundamentals of gold and silver. But, first, here is the chart of the prices of gold and silver. |
Gold and Silver Prices(see more posts on gold price, silver price, ) - Click to enlarge |
Gold to Silver RatioNext, this is a graph of the gold price measured in silver, otherwise known as the gold to silver ratio (see here for an explanation of bid and offer prices for the ratio). The ratio dropped this week. |
Gold to Silver Ratio(see more posts on gold silver ratio, )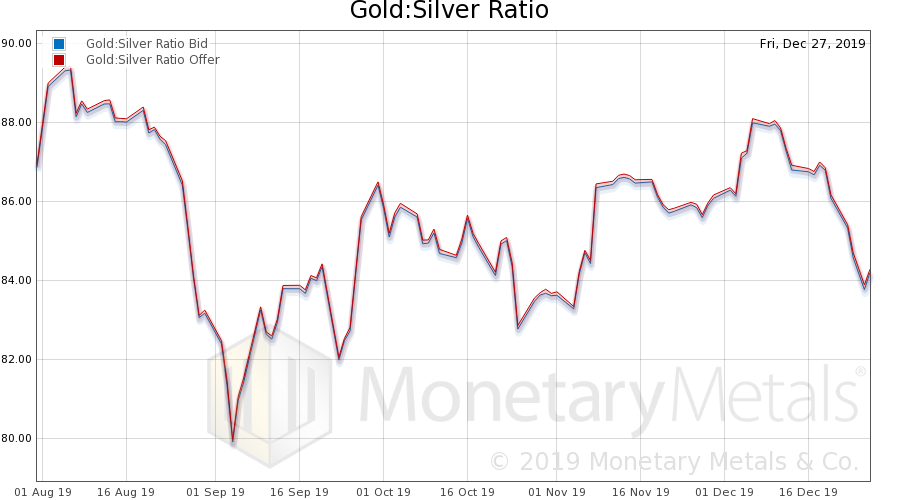 - Click to enlarge |
Gold Basis and Co-basis and the Dollar PriceHere is the gold graph showing gold basis, co-basis and the price of the dollar in terms of gold. With the big drop in the dollar (which the muggles see as a rise in the price of gold), we observe a drop in the scarcity of gold to the market. They are selling more gold metal, at the new, higher price. Nevertheless, the Monetary Metals Gold Fundamental Price—the price at which metal would clear, if it weren’t for leveraged speculators in the futures market—was up $10 over the past two weeks, to $1,480. |
Gold Basis and Co-basis and the Dollar Price(see more posts on dollar price, gold basis, Gold co-basis, )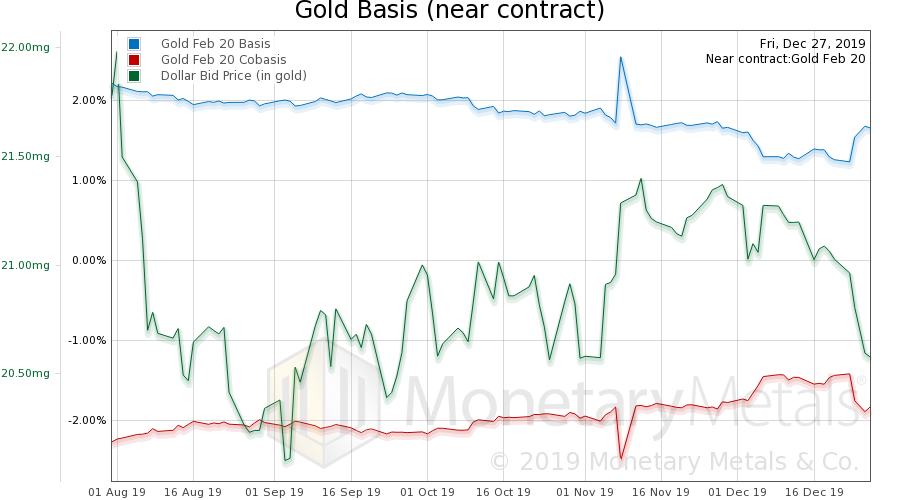 - Click to enlarge |
Silver Basis and Co-basis and the Dollar PriceNow let’s look at silver. The same thing happened in silver, the dollar dropped (i.e., the price of silver rose) and more people were happy to trade silver in exchange for more of those slips of paper that people yet call money. The dollar, as measured in silver, fell a lot, but the co-basis did not fall so much. So the Monetary Metals Silver Fundamental Price rose 43 cents, to 17.35. |
Silver Basis and Co-basis and the Dollar Price(see more posts on dollar price, silver basis, Silver co-basis, )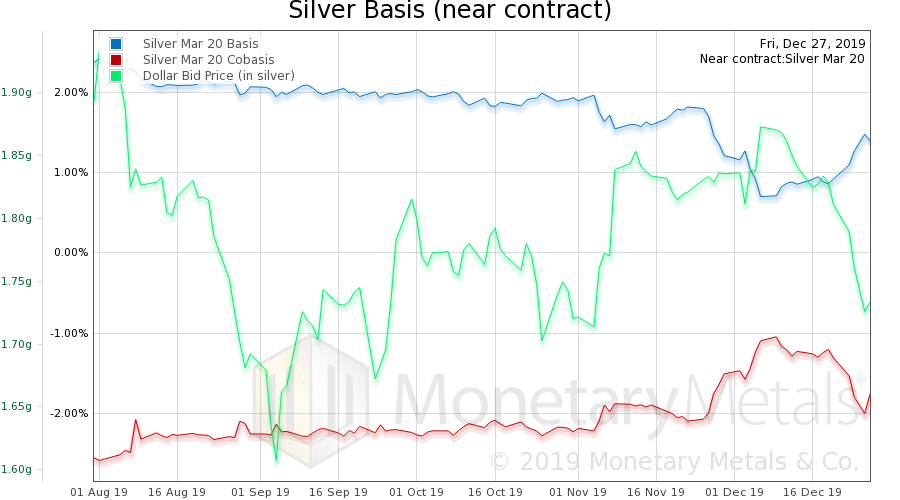 - Click to enlarge |
© 2019 Monetary Metals
Charts by St. Louis Fed, Monetary Metals
Chart and image captions by PT
Full story here Are you the author?
Tags: Chart Update,dollar price,gold basis,Gold co-basis,gold price,gold silver ratio,newsletter,On Economy,Precious Metals,silver basis,Silver co-basis,silver price


