


Pater Tenebrarum
My articles My siteAbout meMy videosMy books
Follow on:TwitterSeeking AlphaFacebook
A Recurring PatternWhen the gold price recently spiked up to approach the resistance area even Aunt Hilda, Freddy the town drunk, and his blind dog know about by now, a recurring pattern played out. The move toward resistance fanned excitement among gold bugs (which was conspicuously lacking previously). This proved immediately self-defeating – prices pulled back right away, as they have done almost every time when the slightest bit of enthusiasm emerged in the sector in recent years. A number of observers were concerned about the Economist penning a few positive words about gold, as Economist endorsements of market trends are usually the kiss of death for the trend in question. We would point out though that although the pullback began the very next day, it was luckily not a page one story. As to why the Economist would suddenly endorse the safe haven qualities of gold, we have no idea. It is certainly out of character for the magazine, which is not exactly averse to statist interventionism and similar to most other mainstream financial publications is known to be a staunch defender of the economic status quo, including the fiat money system on which it rests. |
Gold-daily 2016-2019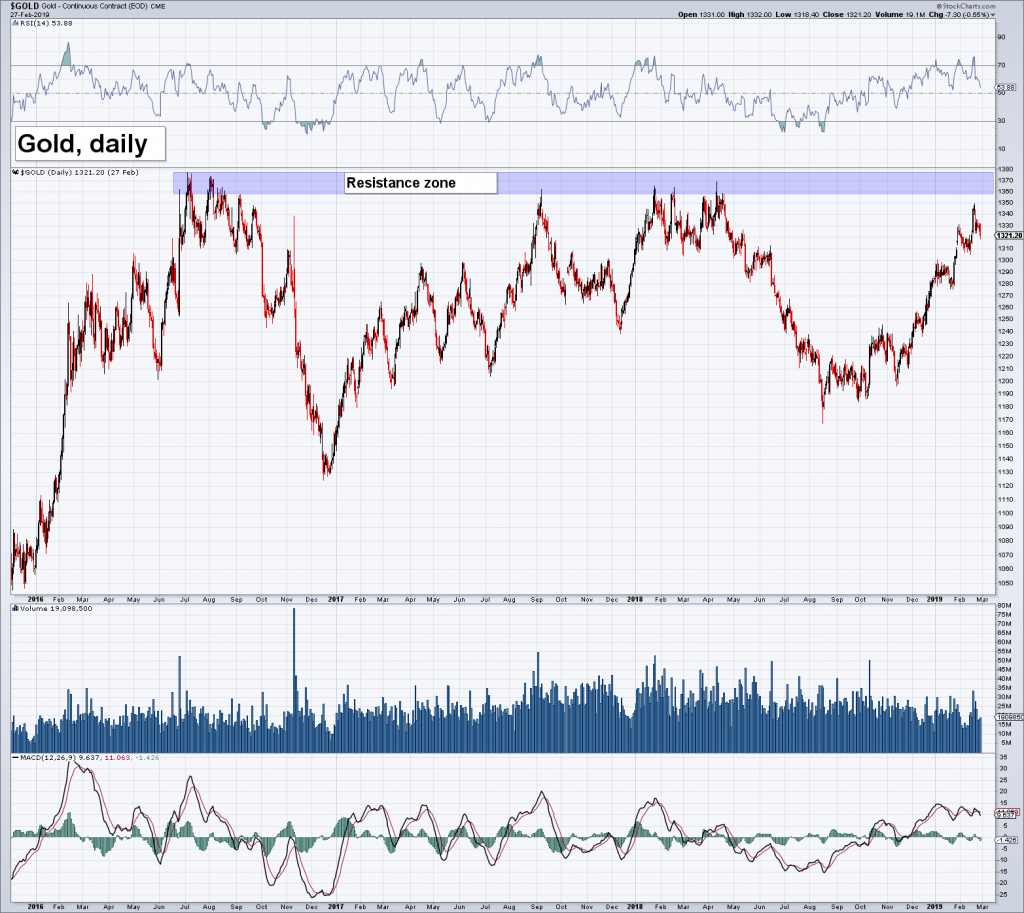 There is a well-known resistance area in gold priced in USD between roughly $1360 and $1380. It has become the proverbial watched pot. - Click to enlarge |
The Fundamental BackdropAs long time readers know, over the past year or so we have often pointed out that the macro-economic drivers of the gold price were not exactly bullishly aligned yet, but seemed to be on the cusp of getting there. In Q4 of 2018 sharply rising credit spreads and falling stock prices finally appeared to tilt the fundamental backdrop clearly toward gold-bullish territory. Since the turn of the year, the picture has become somewhat muddied again, as credit spreads have tightened and stocks have rallied. The yield curve never got around to steepening, so there was no help from that front at any point. On the other hand, the trend in TIPS yields has become supportive again. The US dollar and commodities are not really going anywhere (yet), so their effect on gold is largely neutral. Bank stocks have been weak relative to the broad market since early 2018, but are recently recovering. Below are several charts illustrating the situation. We would interpret it as overall neutral for gold prices, but retaining a slight bullish bias (as opposed to the slight bearish bias that prevailed for most of last year prior to the fourth quarter). |
Fundamental Drivers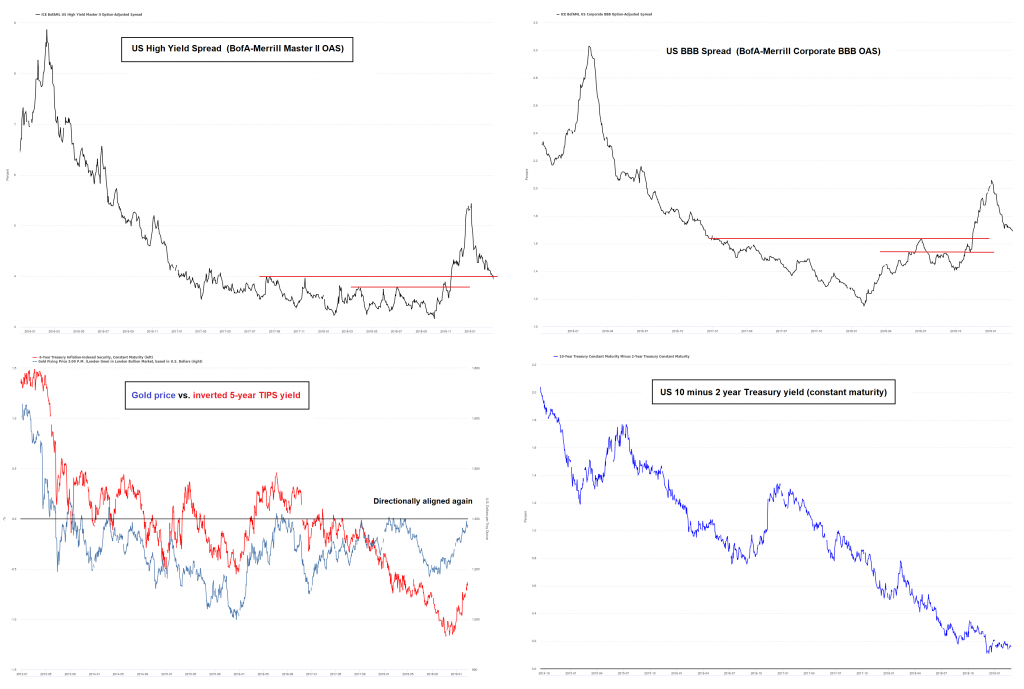 - Click to enlarge The top half shows US high yield and BBB (lowest investment grade segment) spreads. After breaking out with authority in Q4, they have tightened again and are now back at the former resistance area. It remains to be seen whether it will now serve as support. At the bottom on the left is a chart showing the gold price vs. the inverted 5-year TIPS yield. Gold has led TIPS yields this time, which have recently aligned with it. TIPS yields are therefore confirming the recent gold rally. On the right hand side we show the 10 minus 2 year Treasury yield spread as a proxy for the steepness of the yield curve. Portions of the yield curve have in fact inverted recently, but not this particular one. A flattening yield curve is generally negative for gold prices, but once the flattening trend stops a reversal to steepening usually comes next – and that will be supportive. |
| It is generally much easier to be long-term bullish on gold than holding a firm opinion on its short term prospects. Clearly, the post QE economic landscape is an accident waiting to happen in view of the massive debt build-up and the capital malinvestment induced by interest rate suppression and money printing. The timing is what remains open to question, but the warning shots are becoming more frequent.
We have not mentioned money supply growth yet, which remains quite weak. This is superficially bearish for gold, but since a dearth of excess liquidity is mainly dangerous for “risk assets” and economic activity, gold market participants may actually consider this to represent a bullish datum at present. There is a lively debate underway between gold aficionados with respect to the outlook for gold in coming months, and many well-informed observers are skeptical in view of the recent mixed bag of fundamentals. However, there are actually a few signs pointing to the possibility that gold could rally in advance of the fundamental backdrop turning unequivocally bullish. Readers may recall that we have mentioned this possibility on previous occasions. A number of recent developments are lending additional support to this idea. |
Fundamental Drivers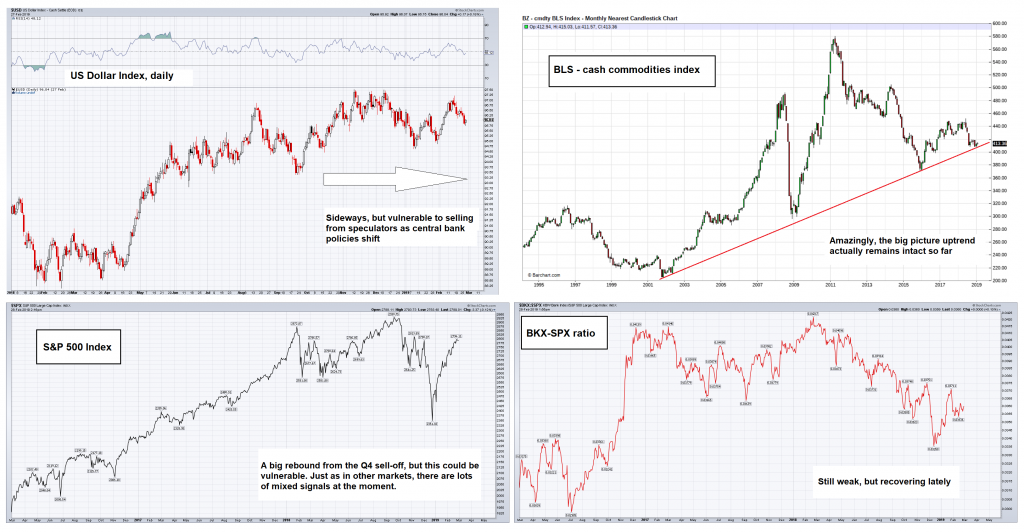 - Click to enlarge Top half: the Dollar Index (DXY) has been moving sideways for quite some time, but it has become vulnerable now that the monetary policy bias of the Fed has become less hawkish. To the right we show a very long term chart of the BLS cash commodities index, which illustrates that the long term uptrend in commodity prices remains actually intact so far. The CRB Index fails to show this as it includes the roll-over effect, which introduces a sizable downward bias whenever most commodity futures are in contango. In the near term commodities still look weak – they have failed to rally as strongly as the stock market. In the bottom half we show the SPX, which has recovered smartly (obviously, the tentative wave count we presented early this year did not pan out as advertised) and the BKX-SPX ratio, which serves as a proxy for market perceptions about the soundness of the banking system (hat tip to Steve Saville for adding this indicator to the gold macro-fundamentals arsenal). |
Signs of StrengthFor one thing, as Keith Weiner regularly points out, in recent months his fundamental gold price indicator (which is inter alia derived from the spread between gold futures and spot prices) shows that there is persistent buying of physical gold in the market. We suspect that reservation demand is quite strong as well – after all, why would holders of bullion sell? The need for having some insurance against potential economic and financial turmoil seems crystal clear. The same goes for the need to defend one’s wealth against increasingly rapacious and intrusive governments. Readers may recall that we wrote about our “Canary in the Gold Mine” again last October, when the JSE Gold Index broke above two resistance levels in a row and started to advance in quite spirited fashion (here is what the chart looked like at the time). We are happy to report that this breakout turned out to be the real McCoy. Here is what the chart looks like now – the index has in the meantime broken above further resistance levels in what is clearly an impulsive rally: Since South African gold stocks tend to lead US gold stocks near major turning points (see also the original “Canary in the Gold Mine” post from early 2016), we consider this to be a potentially quite significant development. Apart from signals we get from market indicators one would also do well to ponder a number of recent events and their likely impact on gold prices down the road. In this context one also needs to keep in mind that gold prices will probably lead future fundamental developments. |
JSE Gold Index 2018-2019 we have circled the breakout we discussed in October in red. It was followed by a textbook retest, and then it was off to the races for good. - Click to enlarge |
Simmering TroubleFor one thing, the Federal Reserve’s sudden about-face regarding its policy bias may well end up damaging its much-vaunted “credibility”, despite the fact that it was greeted with great enthusiasm by market participants. It certainly feels as if Fed members are slowly realizing that the central bank is boxed in. It seems “QE” is akin to the Hotel California: you can check in, but you can never leave. Western central bankers should have known- all they had to do was look at Japan. After all, Japan isn’t on another planet. In Japan they now have QE and ZIRP forever and ever, a scary and inexorably rising pile of public debt, while economic growth is increasingly disappearing into the realm of myth and legend and vast swathes of the population seem to be suffering from depression. Why this didn’t set alarm bells ringing is a complete mystery to us. Our guess is that it was a case of extremely misguided central planner hubris. Gold is traditionally a major beneficiary of crumbling faith in the monetary authority and we don’t think that has changed. The Fed’s credibility should therefore definitely be of concern to anyone interested in the gold market. |
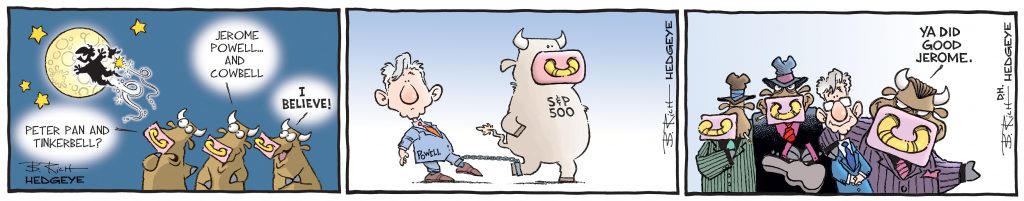 Hedgeye cartoonist B. Rich quickly responded: Jerome Powell as Peter Pan, chained to the S&P 500 and lastly in his new role as the Dovefather. |
| This brings us a few other recent events that are giving us pause (interestingly, we have so far not seen them discussed elsewhere in the context of gold). As Mish reported, a study by the US Department of Commerce has come to the bizarre conclusion that European car imports do indeed pose a “threat to US national security”.
One day earlier, Vice President Mike Pence attended the Munich security conference. After offering greetings from President Trump he waited for applause – and received a rather awkward moment of silence instead: Not only that, but his attempts to put pressure on the EU with respect to the Iran deal were less than successful (as an aside to this, we are generally on board with most of Donald Trump’s foreign policy efforts and are often disappointed when they are thwarted, but we think ditching the nuclear treaty with Iran was a mistake). Along similar lines, his attempt to persuade Germany to abandon Nord Stream 2 – after which the US is presumably going to sell LNG to the Germans at roughly twice the price Russia is charging – were not exactly welcome either (see once again Mish for additional color). That there is a rift between the Trump administration and the EU has been obvious for quite some time, but lately it seems to be growing. Clearly the rhetoric is becoming more adversarial, as inter alia evidenced by Ms. Merkel’s speech at the conference. Since the political establishment of the EU is increasingly under threat from its own unhappy voters, we would not expect it to back down when it is confronted with outside pressure. Normally we ignore geopolitical developments in the context of gold analysis. Empirical evidence suggests that gold price spikes triggered by geopolitical events are invariably given back, i.e., they usually represent short term selling opportunities. However, if it seems possible that monetary and economic policy could be affected, one should pay attention. The report by the US Commerce Department on European car imports indicates that the recent US-EU spats could indeed affect economic policy. Transatlantic dissension in particular tends to create a bullish backdrop for gold. This was e.g. the case in the late 1960s and early 1970s when the Bretton-Woods agreement fell apart. It was once again a factor in driving gold prices higher in 1987, when the US administration clashed with Germany over the Bundesbank’s tight monetary policy. With the EU increasingly coming under strain – it is losing its third biggest net payer now that the UK is exiting – the fact that it is a major beneficiary of what is referred to as the Pax Americana is coming into stark relief as well. European citizens with assets to protect are undoubtedly eyeing a potentially weakening security umbrella with concern. While the allies are likely to resolve their disagreements eventually, things could easily get worse before they get better. Gold investors should keep a close eye on these developments, especially if they end up affecting cooperation between central banks. We say this because Mr. Trump’s trade policies cannot be divorced from currency policy. A weakening US dollar became a major bone of contention in both the 1970s and 1980s and this could eventually happen again. |
Mike Pence gets the silent treatment in Munich |
ConclusionDespite the fact that gold fundamentals are still not unequivocally bullish, there are signs that investors are increasingly receptive to the idea of buying some gold for insurance purposes. The stock market rout in Q4 2018 has probably reminded some people that having a portfolio hedge may not be a bad idea. There also seems to be growing interest in the battered gold mining sector from value investors. The HUI-gold ratio has begun to trend up, albeit in laborious fashion as you can see below: |
HUI-Gold ratio 2018-2019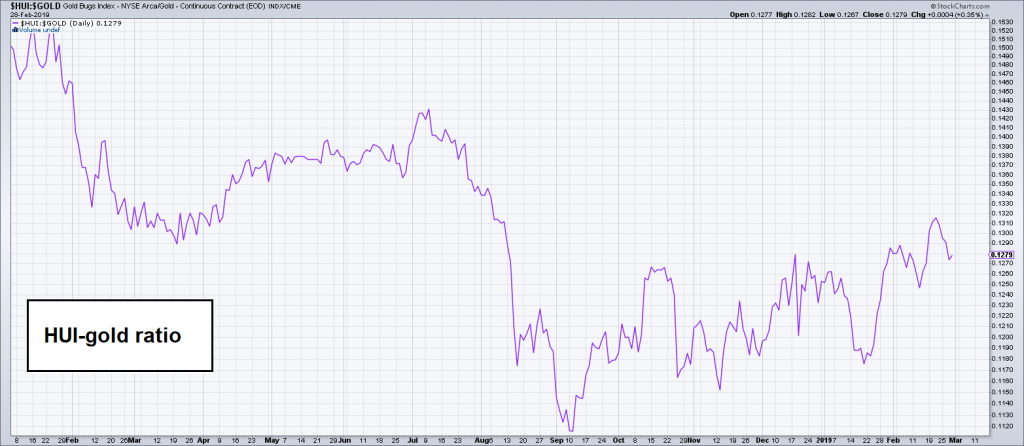 The HUI-gold ratio is slowly trending up in “two steps forward, one step back” fashion since establishing a low in early September 2018. - Click to enlarge |
| We mentioned above that some short term excitement was stirred up when gold approached lateral resistance at $1360. However, it is difficult to argue that sentiment ever came close to anything akin to foaming-at-the-mouth bullishness at any time during the advance. On the contrary, prior to the move from around $1300 to $1350, it felt to us as though the gold rally was widely dismissed as an unsustainable counter-trend move.
The halting advance in gold stocks struck us as a symptom of this widespread skepticism (which the recent pullback has probably revived). A friend recently described the sector as “boring” to us – which actually describes it well. Obviously there are exceptions, such as the stocks driving the rally on the JSE and certain individual stocks like Kirkland Lake, but overall the sector is not really doing much considering its traditionally high beta. Well, you know what they say about dull markets. Stay tuned. Charts by: StockCharts, St. Louis Fed, bigcharts, barchart.com. Cartoons by B.Rich/ Hedgeye |
 An investor who purchased his portfolio hedge in good time. |
Full story here Are you the author?
Tags: Chart Update,newsletter,Precious Metals


