


Pater Tenebrarum
My articles My siteAbout meMy videosMy books
Follow on:TwitterSeeking AlphaFacebook
Has a Bear Market in Stocks Begun?The stock market correction into late December was of approximately the same size as the mid 2015/early 2016 twin downturns, so this is not an idle question. Moreover, many bears seem quite confident lately from an anecdotal perspective, which may invite a continuation of the recent upward correction. That said, there is not much confirmation of said confidence in data that can be quantified. |
S&P 500 Large Cap Index(see more posts on S&P 500 Large Cap Index, )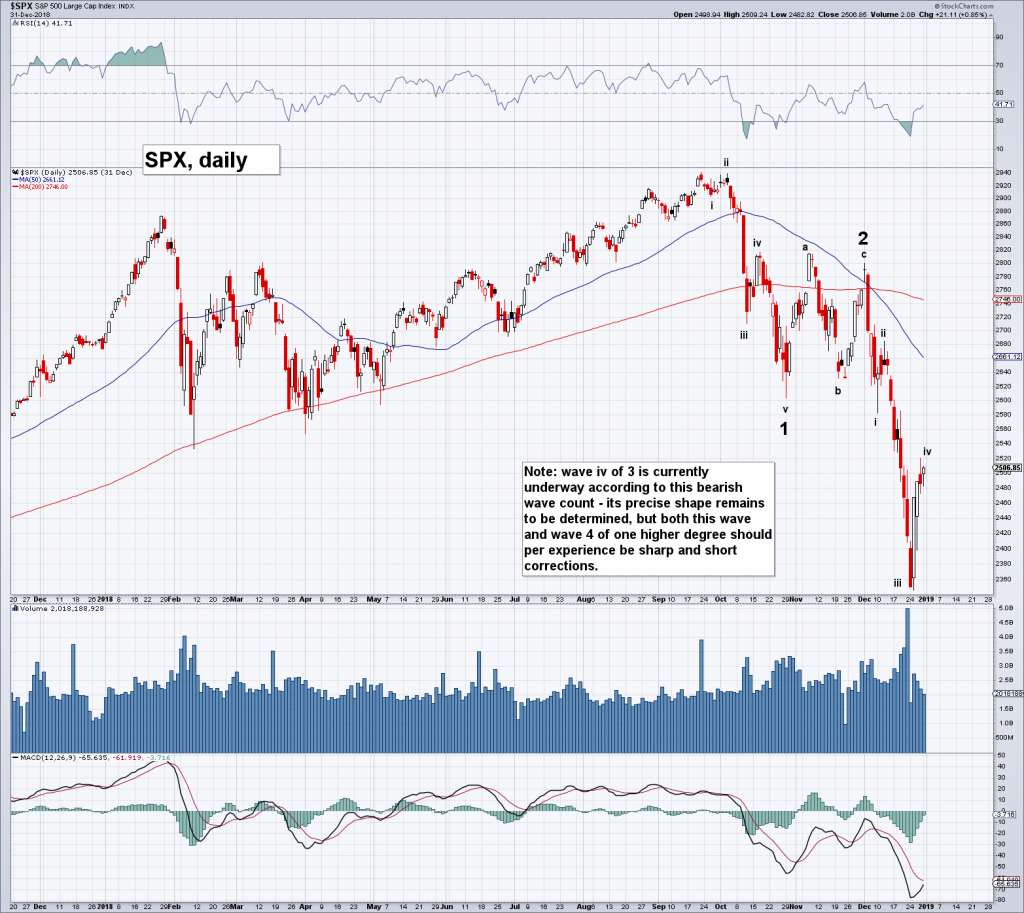 - Click to enlarge Our proposed bearish wave count for the S&P 500 Index, which could easily be completely wrong, so take with a big grain of salt. Let us just note here that this chart looks bearish regardless of the wave labels. The latter are mainly meant to serve as an orientation aid (i.e., if something very different from the expected fractal shape develops, we would know that this interpretation is wrong; on the other hand, if the expected shape does develop, we could be reasonably confident of where short term turning points are likely to occur and would have further confirmation that a large scale bear market has begun). |
| Obviously, our personal impressions of anecdotal sentiment alone are a bit of a thin reed to hang a forecast on – and as noted, these observations are at least partly contradicted by hard data, such as e.g. put-call ratios:
Along similar lines, speculators in E-mini futures doubled their net long exposure in a mere two weeks to more than 350,000 contracts (large and small speculators combined) and Rydex bear assets remain 50% below the level they reached in early 2016 (which in turn was also quite low compared to historical readings). It is fair to say that the willingness to believe remains quite strong. |
CBOE Options Equity Pull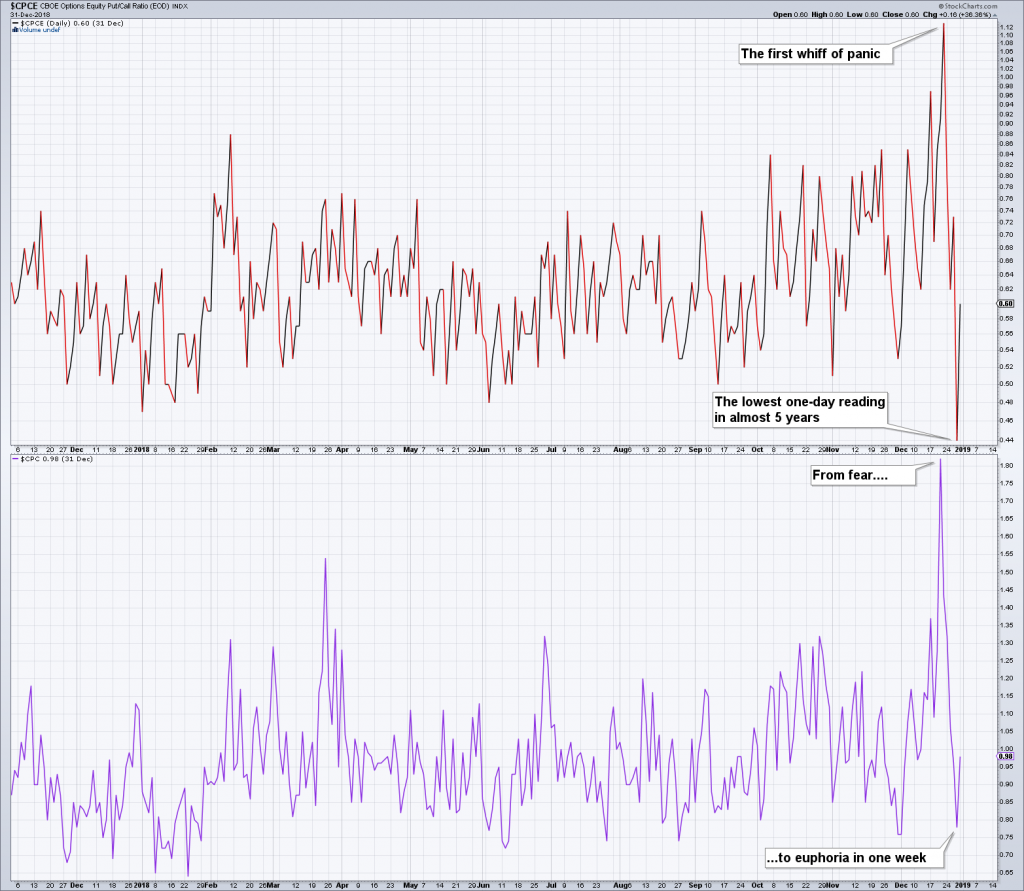 - Click to enlarge CBOE equity put-call ratio and the CBOE total (equity and index combined) put-call ratio – in the third week of December, option punters finally showed some fear, even though the one-day peak in equity options remained below the early 2016 spike high. Remarkably though, traders are apparently still extremely eager to catch falling knives at the first hint of a turnaround, as the equity P/C ratio fell to its lowest one-day reading in almost 5 years just four trading days later! |
| Even so, given that all of this happened so close to and around the holidays, it is hard to say how meaningful it is. It is easy to come up with arguments supporting a more positive short term scenario than that suggested by our wave count; for instance, the new highs/new lows percent index (NHNLP) for the SPX did finally decline well into oversold territory (it bounced back to the zero line immediately thereafter).
Regardless of what happens in the short term, the monetary backdrop remains hostile and last year was home to a plethora of major technical warning signs, all of which were indicative of the typical breakdown in intra-market trend uniformity associated with major turning points. This and the valuation extremes seen at the peak is reason enough for us to remain in the medium to long term bearish camp. At the same time, we concede that definitely not all the signals normally warning of a major market downturn or an approaching recession are in place just yet. We did expect that the market would eventually decline before that happened, since the distortions created by ZIRP and QE made it likely that things would develop slightly differently from the past. However, now the question is what is likely to happen next. |
S&P 500 NH-NL-Percent Index 2011-2019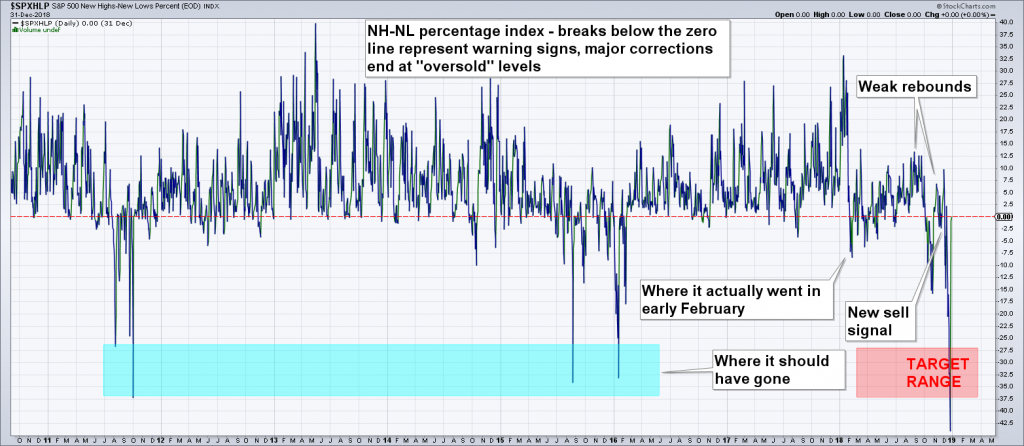 - Click to enlarge S&P 500 NH-NL-Percent Index: finally a drop into severely oversold territory, followed by a swift bounce back to the zero line. In the past, such drops have ended corrections – but that was during the bull market. In a bear market the goal posts are likely to shift. Unfortunately we cannot say what happened in past bear markets, as this indicator is only available since 2010. |
Errors of the Boom About to be Unmasked?When the stock market turned down in October, we thought that at least some of the hitherto strong economic data series were fated to show weakness soon. This has in fact just happened, and ironically, it was the release of the first really disappointing regional PMI report in a long time (the Richmond Fed survey) that coincided with the biggest ever one-day rally in the DJIA in points. The same “sell the rumor, buy the fact” effect seemed to be at work a few days later, when the Dallas Fed manufacturing survey lent support to the market by likewise falling out of bed with a thud. It is of course normal to see a bounce in a very oversold market once feared negative news are actually out of the way. Besides, these two PMI surveys have certainly not yet dented the narrative that the economy is doing just fine. In fact, this is what one hears from a great many market observers – they argue that one should regard the market decline as a buying opportunity because economic fundamentals by and large remain strong. Consider though that in light of the recent blow-out in credit spreads, junk bond issuance has come to a screeching halt over the past several weeks. One would expect the effects of this to be reflected in PMIs with a lag. We imagine that the oil patch in particular is once again in trouble, not so much due to the decline in oil prices, but due to junk bond and leveraged loan markets shutting down. |
US junk bond spreads - Click to enlarge US junk bond spreads – this looks like the mother of all breakouts. Readers may recall that we discussed in great detail in late 2017 how an eventual breakout should play out based on the historical record (see “The Coming Resurrection of Polly” for the details). This is precisely what has now happened, and it represents a serious warning that economic conditions are about to take a turn for the worse. |
| Even “Northman Trader”, who seems to be on the same page with us regarding the longer term outlook (he also believes that overvalued assets will be unable to continue levitating with central banks reversing their previous monetary pumping efforts), felt compelled to wonder in late December how recent extreme technical conditions could be reconciled with the absence of a financial or economic crisis and the generally still positive corporate earnings backdrop. We quote:
There are two possible answers to this question. One is that the stock market has “rediscovered” its function as a discounting mechanism. In the last two major downturns, the decline in stocks happened almost concurrently with the back-dated beginning of economic recessions, but in the more distant past, the market usually declined well before economic data gave cause for concern. The other possibility is that the decline in stock and corporate bond prices is the crisis, so to speak. QE by the world’s major central banks has distorted asset prices to such an extent, that they are now plummeting well before other macroeconomic fundamentals deteriorate, simply because excess liquidity is drained. Of course we know based on sound economic theory that the prolonged period of interest rate suppression and monetary pumping has likely led to enormous capital malinvestment on a broad front. Market participants correctly fear that the errors of the boom are going to be unmasked now that the artificial support provided by “unconventional policy” is on the way out. |
US Real Gross Private Domestic Investment and 10 year - 2 year spread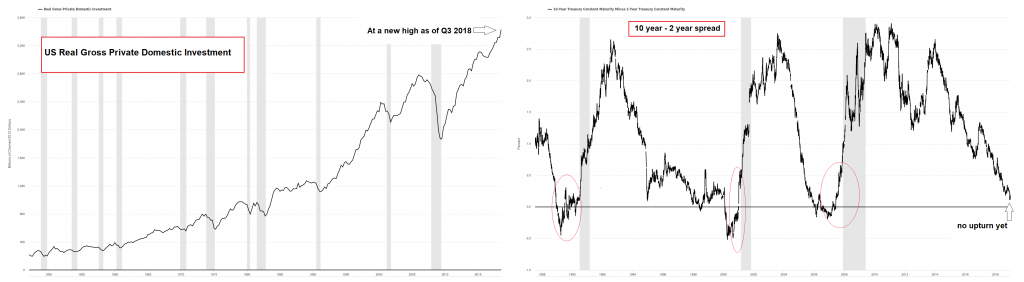 - Click to enlarge Two macroeconomic data points that seemingly belie the idea that an economic downturn is imminent – real gross private domestic investment and the 10-year/2-year treasury note yield spread. The former ended at a new all time high in Q3 2018, the latter has yet to turn up (never mind invert – as we have often pointed out, an inversion of this spread is not necessary as a sine qua non precondition for a recession – however, a sharp turn higher from extreme compression should definitely happen at some point). |
The Bear Market HookThe bull market was born at the lows of March 2009 with just 3% of S&P futures traders still declaring themselves bullish in the “daily sentiment index” survey (ironically, only 3% said they were bearish in late January of 2018). The rally that started at that point was accompanied by skepticism for a very long time. What caused the widespread skepticism? The sluggish performance of the economy seemed to be the main reason. Most people could not fathom the possibility that the stock market would continue to rise in such an environment, particularly as it was frequently shaken up by the emergence of fresh batches of quite bad news, including the euro area debt crisis and the tsunami that devastated Japan. We include ourselves among these skeptics by the way. While we did caution that strong money supply growth underpinned asset prices, we also ruminated about the possibility that the threshold below which its growth rate would have to decline to derail the party might be higher than in the past – precisely because the economy seemed very weak. As it turns out, that was actually a “bull market hook”. It kept doubt elevated and in keeping with contrarian thinking, this produced a steady stream of new converts as stocks kept rising, right until the time when the bullish consensus reached new extremes. We recently pondered the fact that the S&P 500 Index plunged by more than 50% from early 1973 to late 1974 while aggregate SPX earnings rose every single quarter. We are not suggesting that the current situation is comparable to the mid 1970s in any other important respect – we are only noting that a seemingly inconceivable disconnect between a datum considered bullish for stocks and the bearish performance of the market was in evidence at the time. Given this precedent, it is definitely imaginable that an analogous situation is playing out now, with the stock market having such a long lead on the economy that it creates a “bearish hook”. In this scenario, the narrative of the “strong economy” keeps people in the market even though the market continues to go down. In other words, bullish investors remain “hooked”, just as the bears remained “hooked” in the first few years of the bull market.
|
DJIA, daily: May 1972 - April 1975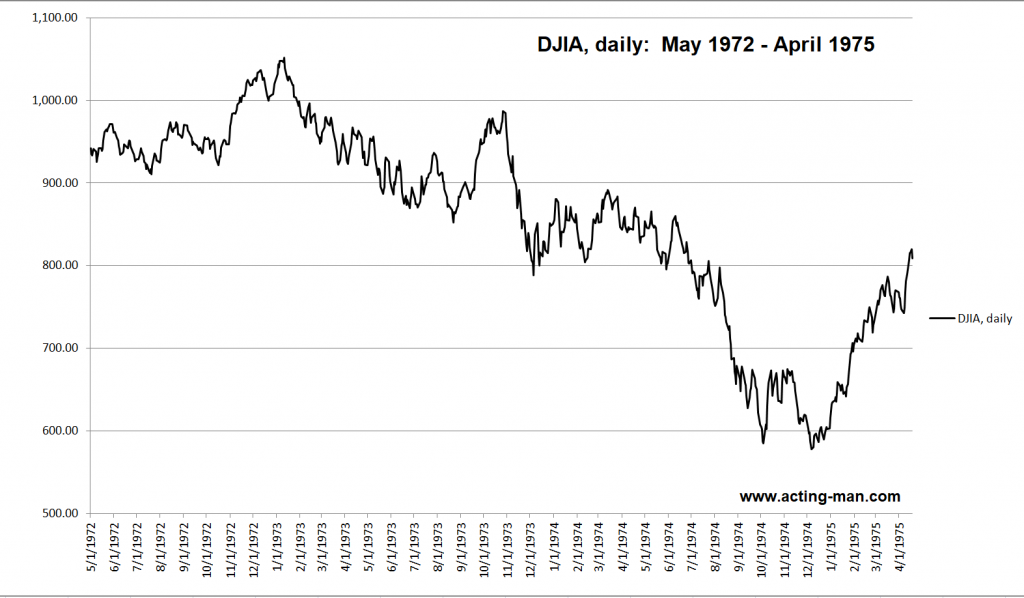 - Click to enlarge The 1973-1974 bear market in the DJIA (the Dow declined a little less than the S&P 500 at the time, while the Nasdaq and small caps did a lot worse). The market was devastated despite continuing earnings growth, as valuations were extremely rich at the peak and soaring price inflation caused investors to attach lower multiples to corporate earnings. There was also the “oil shock” of 1973 and Nixon’s resignation in 1974. |
ConclusionWe continue to believe that one must tread with caution, even if the market delivers a strong short term rebound. Note also that historically, once earnings multiples begin to contract from valuation extremes and margin debt declines by 10% or more from an all time high, a major bear market usually gets underway and lasts until a “reversion to the other extreme” has occurred. The economy may still show some momentum for a while, but this should not distract from the fact that slowing money supply and credit growth will eventually impact economic activity with a lag as well. By the time this becomes obvious to all, stocks could easily trade at much lower levels.
Charts by: StockCharts, St. Louis Fed, acting-man.com, SentimenTrader |
NYSE margin debt since 1990-2018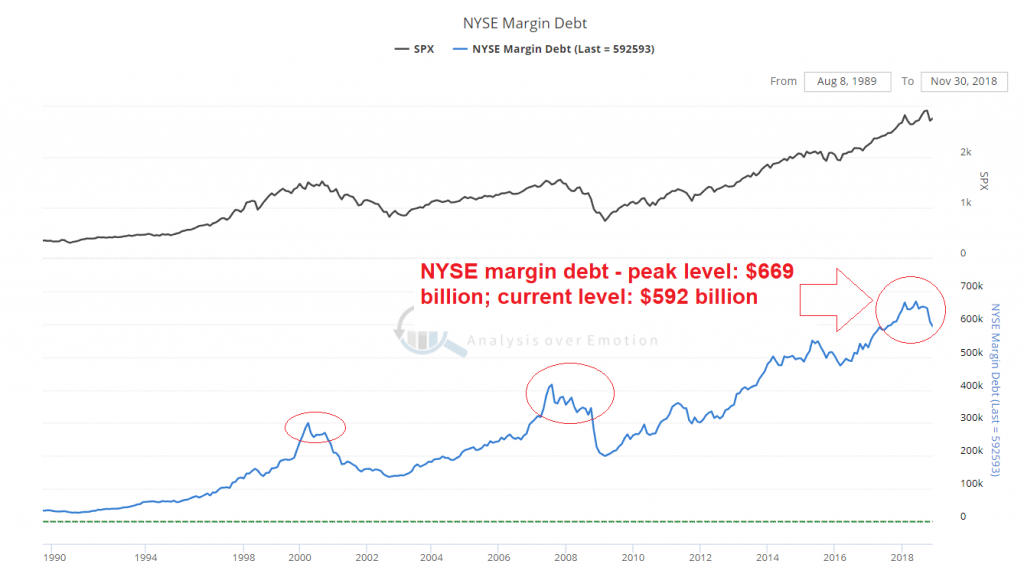 - Click to enlarge |
Full story here Are you the author?
Tags: newsletter,S&P 500 Large Cap Index,The Stock Market


