Pater Tenebrarum
My articles My siteAbout meMy videosMy books
Follow on:TwitterSeeking AlphaFacebook
Lord, Grant us Chastity and Temperance… Just Not Yet!Most fund managers are in an unenviable situation nowadays (particularly if they have a long only mandate). On the one hand, they would love to get an opportunity to buy assets at reasonable prices. On the other hand, should asset prices actually return to levels that could be remotely termed “reasonable”, they would be saddled with staggering losses from their existing exposure. Or more precisely: their investors would be saddled with staggering losses. In this context we have noticed the emergence of a new consensus in the form of an invocation we hereby term the Augustine of Hippo Plea. |
 St. Augustine of Hippo, here seen doing saintly magic in his later years. - Click to enlarge In his Confessions the Saint admits that as a “wretched young man” he once inserted a phrase into one of his prayers that has become quite famous for the hopeful qualifier attached to it: “Da mihi castitatem et continentiam, sed noli modo.”, read: “Grant me chastity and temperance, but not yet”. At the time the future Saint feared that he might actually get what he wished for. “Timebam enim ne me cito exaudires et cito sanares a morbo concupiscentiae, quem malebam expleri quam extingui”, as he explains (“I was afraid that you might hear me right away and quickly cleanse me of the disease of carnal desire, which I would much rather have explored than expunged”). |
| A recent example of this consensus we have come across was an interview with Jeffrey Sherman, Deputy Chief Investment Officer at Double Line Capital, Mr. Gundlach’s investment company. It bears the scary click-bait title “It Sure Feels Like 1987”, a comparison numerous people have made over the past year or so, and rightly so (this includes us – in fact, we were probably among the first people pointing out some of the parallels). As an aside, we plan to revisit this particular topic soon in more detail as well.
Mr. Sherman touches upon all the relevant issues in this interview: the rise of quantitative trading strategies and the perception that they may be one of the weak links in the chain, the increase in yields across the curve, the nevertheless soggy performance of the US dollar, the vast expansion in corporate and government debt, the financial strains faced by consumers, the Fed’s tightening bias, the overvaluation of the stock market and the dangers of trend extrapolation, possible investment alternatives to stocks and bonds, you name it. He leaves almost nothing out; as far as we can tell, the only noteworthy omission is the slowdown in money supply growth. And yet, despite enumerating all these tripwires, one doesn’t come away with a sense of urgency at all. For instance, he mentions a 10 year t-note yield of 4% as potentially posing a problem, while levels close to 3% are still deemed manageable. But how can anyone be sure of this? All we know for certain is that the level of interest rates required to trigger crashes and economic busts has steadily declined over recent decades. We understand why so many people who are generally skeptical of valuations and the sustainability of recent boom conditions believe that nothing really bad can possibly happen right away. The main reason for this is that economic data have been strong and tightening by the Fed is seen as being offset by fiscal stimulus and the ongoing (albeit reduced) EBC/BoJ printathons. The former boosts economic activity, while the latter are keeping credit spreads suppressed through arbitrage effects. And aren’t bears cutting a sad figure that at best inspires pity and ridicule by now? Moreover, as we have pointed out on several previous occasions, many of the bells that usually ring ahead of bear markets and economic busts have not yet rung – a plethora of well-known early warning signals remains silent so far. We continue to believe that these signals may well fail to conveniently warn everybody just in time that it is time to get out. Relying on them could well turn out to be a costly mistake. |
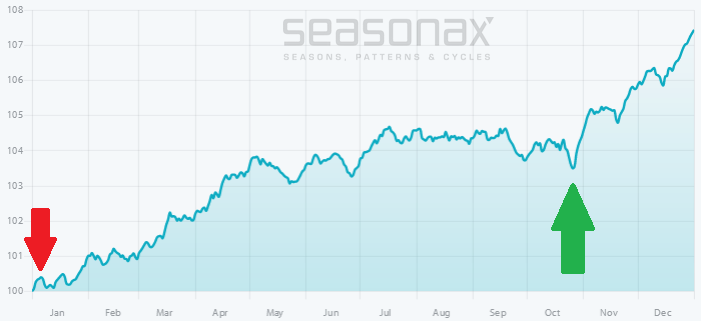
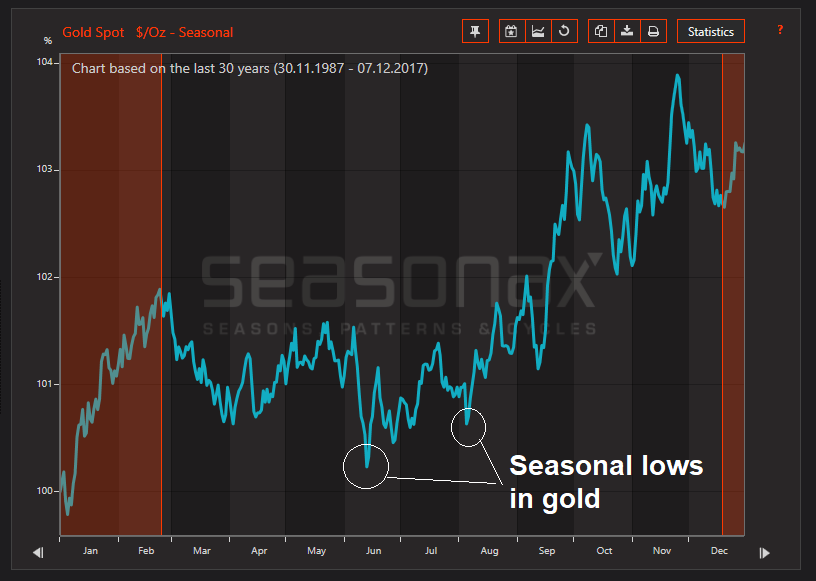
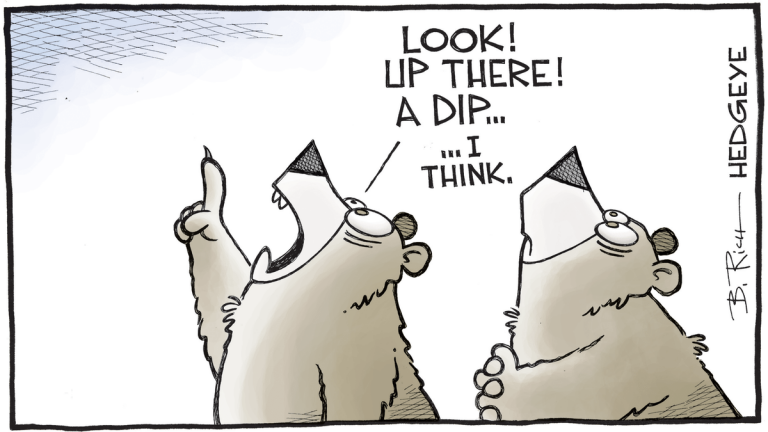 Hopeful bears spotting a possible dip. Sorry boys, it’s probably just a data error…. - Click to enlarge |
Quantitative SuffocationLet us consider the Fed’s monetary policy. As a general remark, while there clearly exists a feedback loop between gross market interest rates and policy rates set by the Fed, the closer a boom comes to its end, the greater the influence of the natural interest rate on market rates will become; the Fed often seems to just follow this trend in a tightening cycle. The upcoming rate hike in March is officially the sixth baby step rate hike in the current cycle. However, recall that in 2012, economists at the San Francisco Fed issued a paper in which they argued that $600 billion in QE was roughly equivalent to a 75 basis points cut in the federal funds rate. We are skeptical about their ability to precisely quantify this supposed equivalence, but let us assume for the sake of argument that this figure is correct. In that case, the upcoming rate hike would be akin to the 9th rather than the 6th rate hike in the current cycle. Moreover, if one considers it legitimate to look at “QE” as equivalent to rate cuts, then “QT” must perforce be equivalent to rate hikes. In other words, with QT now well underway (as the Fed gradually cuts reinvestment into maturing debt on its balance sheet), one could argue that the rate hikes have become larger – at the current pace of $20 billion of QT per month, a theoretical additional rate hike of 7.5 basis points comes into play in Q1 2018. This will accelerate every quarter from now on. |
All Federal Reserve Banks: Total Assets, Jan 2016 - 2018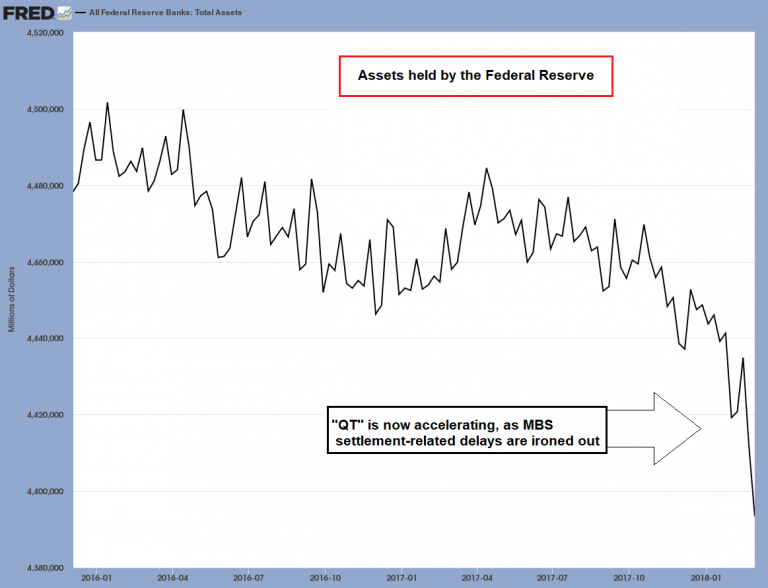 Quantitative tightening actually begins to become visible in a close-up. - Click to enlarge Note: the peak level was recorded in January 2015, at $4.516 trillion. |
| The move in short term market interest rates since their lows in 2014 – 2015 has been rather impressive as well. Consider the chart below, which shows three short term US rates and LIBOR.
This sharp rise in short term rates reflects a scramble for capital, a typical feature of the late stages of a credit boom (we have discussed this in more detail in “Business Cycles and Inflation”, Part 1 and Part 2). It is egged additionally by rising demand for speculative loans: when stocks rise by more than 20% per year, speculators won’t be deterred by such rates. Not surprisingly, NYSE margin debt has soared to a new record high of ~$640 billion. When will the moment arrive when it feels as though “someone had thrown a light switch”? This is a phrase that is habitually uttered when economic activity seemingly falls off a cliff at the end of a boom. No-one knows for sure, but nothing says that it cannot happen in short order.
|
CBOE Treasury Yield Index, Jul 2015 - Mar 2018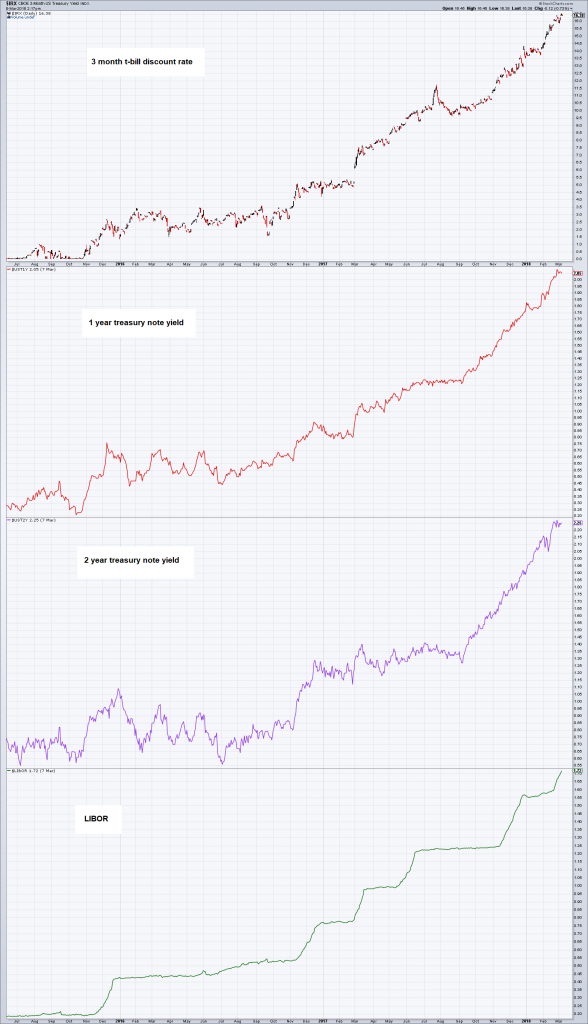 Since late 2015, LIBOR has increased by 10 times, from roughly 17 basis points to 172 basis points. - Click to enlarge Hundreds of billions in interest-rate related products, including variable rate loans are continually adjusted based on the level of LIBOR (rates on bonds and loans tied to LIBOR often have coupons in the form of “LIBOR + X%”). The last time LIBOR was at today’s level was in late 2008, on the way down. The cost on every still outstanding variable rate loan taken out since then has increased; and every variable rate loan or bond that needs to be refinanced will be far more costly as well now. |
The Problem with Warning SignalsA noteworthy development since the establishment of the Fed is the lengthening and increasing amplitude of business cycles – when credit expansion was solely the province of commercial banks, economic downturns were far more frequent than today, but they were also much shorter and were usually quickly overcome. In fact, if one looks closely at the crises of the 19th century, they were often far less pronounced than the less frequent downturns of the 20th century. One problem is that major turning points represent a fairly small sample size. It is not necessarily the case that things that have “always” happened in a certain way will happen again. Sometimes it turns out that notable exceptions have already occurred in the past (for instance, margin debt always peaks before stock prices do – except when it doesn’t, such as in 1937 and 1973). And lastly, while signals warning of impending recessions often also warn of impending stock market peaks, stocks often decline well ahead of the (later backdated) beginning of recessions, and sometimes the stock market can even crash without the event being followed by a recession (this happened in 1987). Let us consider two well-known warning signals: significant turns in initial unemployment claims and the turn from a flattening to a sharply steepening yield curve. Peaks and troughs in initial claims normally tend to precede both tops and bottoms in the stock market, as well as recessions and economic recoveries. In the year 2000, the low in initial claims occurred right after the 36% crash in the Nasdaq that served as the kick-off to the subsequent bear market. There was no advance warning for investors whatsoever, except for the crash itself. The recession started several months later (according to NBER) and the S&P 500 Index retested its March 2000 peak on the final trading day of August by putting in a high that was a few points lower. It took the Nasdaq 15 years to revisit its high of March 2000. Things were different in the next iterations of the cycle: at the lows of 2002 – 2003, the peak in initial claims came far too early to be of use for stock market investors; and the low in claims preceding the 2007 market peak came in early 2006, which was just as useless (arguably, the acceleration in claims in late 2007 was a strong sign that the economy was coming off the rails). In short: there will be no timely warning about an impending market crash from initial claims, but they are likely to work as a leading indicator of a recession. |
Unemployment Claims - Initial Index, 1998 - 2018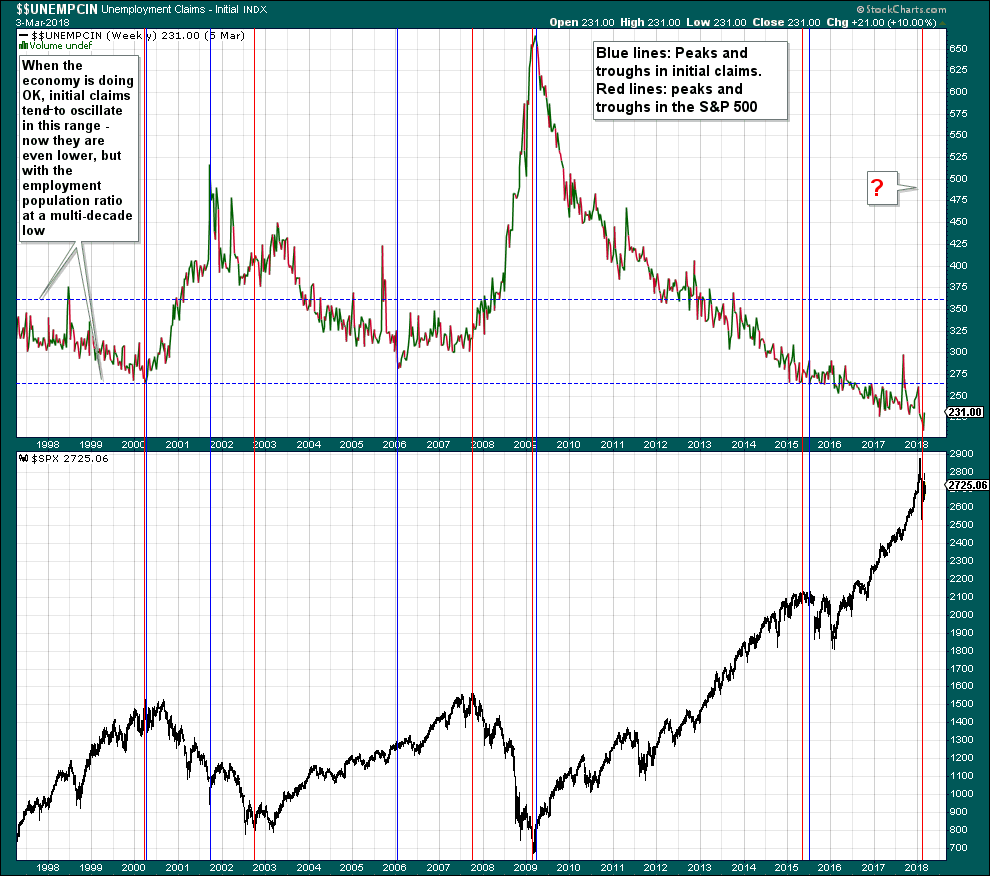 - Click to enlarge |
| What about the yield curve? The yield curve tends to flatten dramatically as an economic boom enters its final stages. In the past it regularly inverted some time before the beginning of recessions (usually with a lead time of about 6 months or longer). As we have seen in Japan though, once interest rates reach the zero bound, yield curve inversions no longer necessarily happen ahead of economic downturns. But the flattening of the curve followed by a sharp turn toward steepening is still a reliable warning signal of an impending recession. Below we compare the 2-year/10-year spread as a proxy for the shape of the yield curve to the stock market. |
Yield Curve 2 Year Bonds, 1997 - 2018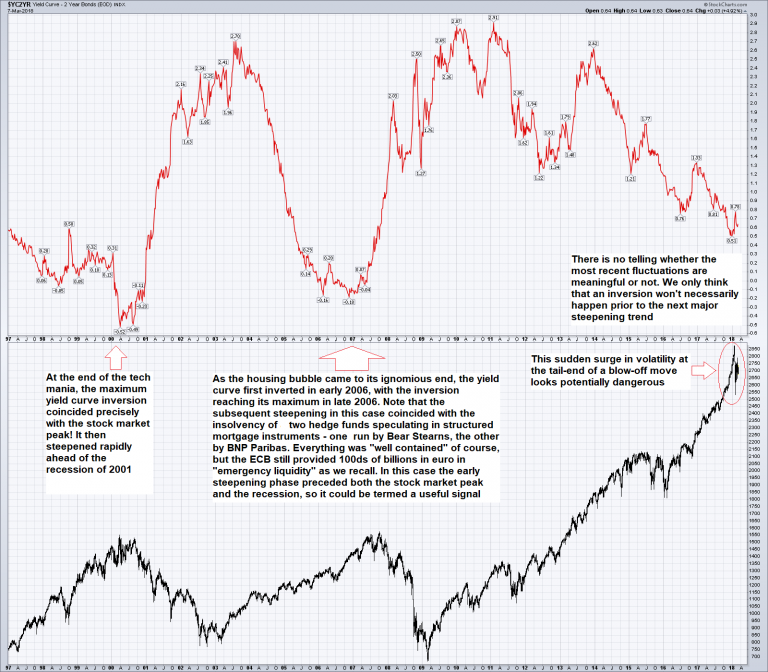 Yield curve flattening and steepening at the end of a boom – sometimes the signal is useful as a leading indicator for the stock market, sometimes less so. - Click to enlarge It did not warn investors in time of the Nasdaq crash in 2000. |
ConclusionIt seems to us people may be too sanguine about the prospects for risk assets. We don’t know this for certain of course, and there are just as many good arguments that support the idea that there is still plenty of time before the party truly ends. In Dirty Harry terms, some of us will be lucky punks, and some won’t. Or in St. Augustine terms, the question is if it will be enough when fund managers add qualifiers to their prayers. As far as we know, markets rarely do what is widely expected of them. In theory that opens the possibility of both more negative and more positive outcomes relative to expectations. Considering the downturn in US money supply and credit growth and the market’s more than generous valuation levels (actually, these are bordering on insanity) one should probably err on the side of caution in this case. |
Total Bank Credit at US Commercial Banks, Jan 2004 - 2018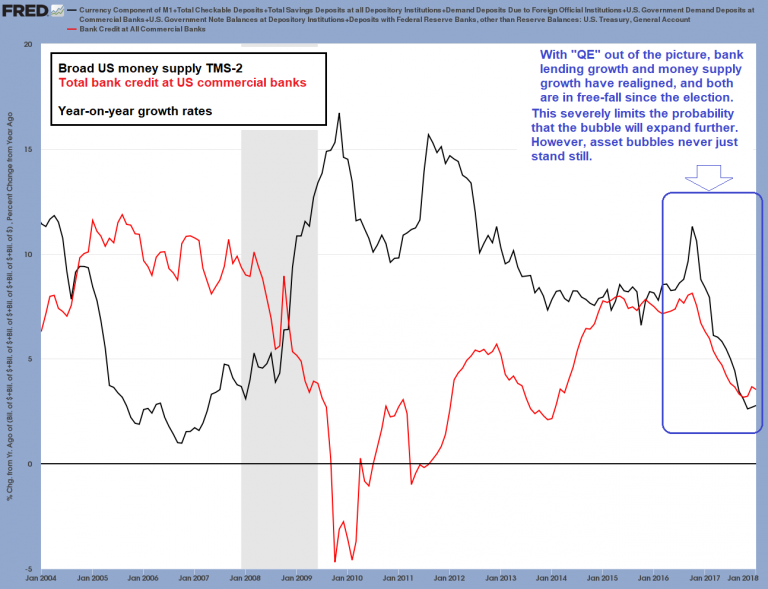 - Click to enlarge |
Shiller P/E Rato, 1890 - 2018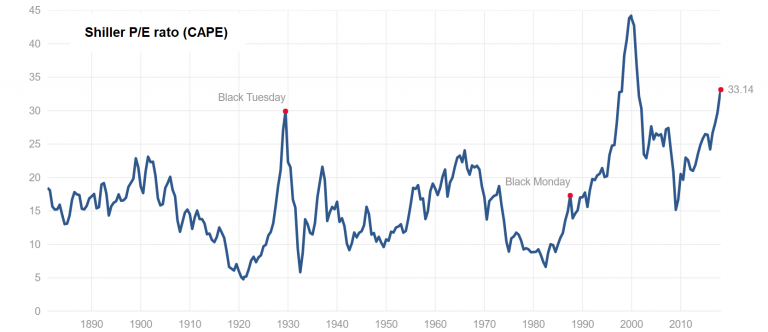 Cyclically adjusted P/E ratio (CAPE) or Shiller P/E: well past the peak of 1929 – and why not, we have bested it in every other respect after all. - Click to enlarge |
Full story here Are you the author?
Tags: Chart Update,Credit Markets,newslettersent,The Stock Market