


The Strongest Seasonal Stock Market TrendReaders may already have guessed: when the vibrant colors of the autumn leaves are revealed in all their splendor, the strongest seasonal period of the year begins in the stock market – namely the year-end rally. Stocks typically rise in this time period. However, there are questions, such as: how often does a rally take place, how strong is it, and when is the best time for investors to enter the market? I will answer these questions for you below. |
 Will Santa wake up this year? Last year he was clearly missing in action – but that is actually the exception, not the rule PT |
The “Golden Season” in the S&P 500 Index Begins Now!The first illustration below represents a seasonal chart of the S&P 500 Index. The chart was created by calculating the average returns of all years since 1950 and thus shows the typical seasonal pattern of the S&P 500 Index in the course of a calendar year. The horizontal axis denotes the time of the year, the vertical axis the level of the seasonal index. The arrows mark the year-end rally between 26 October and 03 January of the next year. In this time span of just over two months, the S&P 500 Index rose on average by 4.27 percent. On an annualized basis this is equivalent to quite a large gain of 24.79 percent. By way of comparison: in the remainder of the year the S&P 500 Index generated an average annualized gain of just 3.58 percent. Evidently, the return generated by the year-end rally is far superior. |
S&P 500 Index, seasonal pattern since 1950.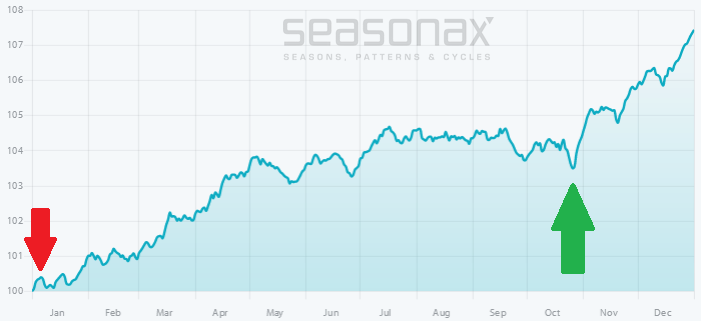 The S&P 500 has typically rallied from 26 October onward - Click to enlarge |
A Very High Win Rate of 82.61 Percent!The seasonally favorable time period between 26 October and 03 January delivered positive returns in 57 out of 69 cases, or in 82.61 percent of the years under review. This is quite a large and statistically significant percentage. Thus, in addition to the well above average gain generated by the year-end rally, the pattern also exhibits a very high win rate. Another positive aspect is that this was calculated for a very long time span of 69 years. The average gain was therefore not merely driven by a few outlier years. On the contrary, a strong rally has taken place quite frequently – what more could an investor ask for? Let us take a closer look at the details. The bar chart below shows the return of the S&P 500 Index between 26 October and 03 January for every year since 1950. Green bars denote years in which a positive return was achieved, red bars years in which losses were recorded. As you can see, the green bars denoting positive returns clearly predominate. However, there were also a few years in which the S&P 500 Index declined during this time period. One of these declines occurred last year, as indicated by the last red bar on the chart. |
S&P 500 Index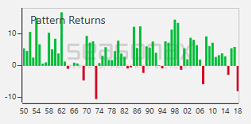 S&P 500 Index, percentage return achieved between 26 October and 03 January in individual years since 1950. Gains clearly predominate - Click to enlarge |
A Particularly Favorable Seasonal Pattern
There exists no stock market rule that always works. Nevertheless, the high win rate and the well above average gain represent strong evidence that the year-end rally is a particularly favorable seasonal pattern.
If you want to know how your favorite stocks tend to perform during the year-end rally, you can find out with just a few mouse clicks at www.app.seasonax.com or with the help of the Seasonax app at Bloomberg or Thomson-Reuters Eikon.
Charts by Seasonax
Chart & image captions (where indicated) by PT
Full story here Are you the author?Tags: newsletter,The Stock Market


