Well Known Seasonal TrendsReaders are very likely aware of the “Halloween effect” or the Santa Claus rally. The former term refers to the fact that stocks on average tend to perform significantly worse in the summer months than in the winter months, the latter term describes the typically very strong advance in stocks just before the turn of the year. Both phenomena apply to the broad stock market, this is to say, to benchmark indexes such as the S&P 500 or the DJIA. A number of individual stocks have their own “seasons” though, i.e., certain individual stocks have a habit of diverging from the major indexes and exhibit seasonal patterns of their own. I will illustrate this with an example that is relevant for the current time period.
|
 Summer and winter in the stock market… - Click to enlarge |
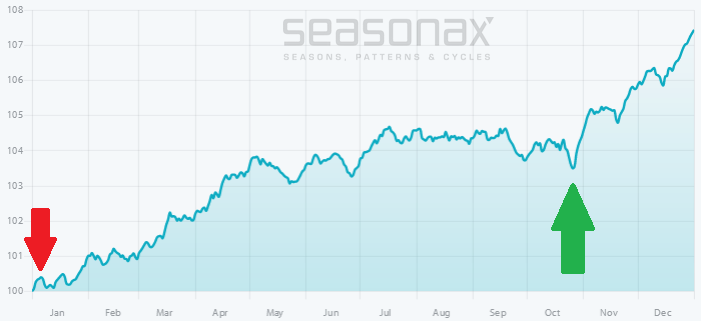
Hasbro: Seasonal Strength from February to AprilI have picked Hasbro, a manufacturer of toys headquartered in Pawtucket, Rhode Island in the US. Our readers are very likely familiar with one of the company’s most famous products: the board game Monopoly, which was originally made by Parker Bros. Below is a chart showing the typical pattern the stock exhibits in the course of a calendar year. These patterns can be discerned at a glance on a seasonal chart, which is calculated by averaging the performance of the stock over the past 20 years. The horizontal axis depicts the time of the year, the vertical axis the level of the seasonal pattern (indexed to 100). As the chart shows, Hasbro typically rallies very strongly in the three months to the end of April. On the other hand, the stock’s seasonal pattern shows that it usually tends to lose ground over the rest of the year. The time period associated with the strongest seasonal performance is highlighted on the chart in blue. It begins on January 31 and ends on May 2. Hasbro’s very positive performance at this time of the year diverges significantly from that of benchmark indexes such as the S&P 500 Index. In seasonal terms, the index barely rises in February, while – also in contrast to Hasbro – it usually displays significant strength at the end of the year. How frequent were rallies in Hasbro during the seasonally strong period? After all, it is theoretically possible that an outstanding gain achieved in just one or two years was responsible for generating this strong average performance. |
Hasbro, seasonal pattern over the past 20 years, Jan 2017 - Feb 2018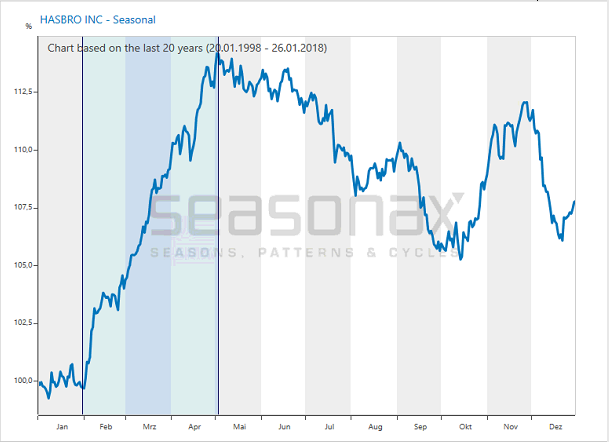 Hasbro, seasonal pattern over the past 20 years. Hasbro typically advances strongly from February to April. - Click to enlarge Hasbro typically advances strongly from February to April. |
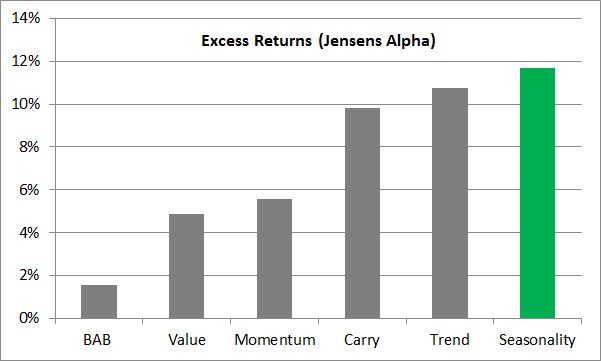
Hasbro Rose in 16 out of 20 CasesThe bar chart below depicts the percentage returns generated by Hasbro shares over the relevant time period from January 31 to May 2 in every year since 1998. Red bars indicate years in which negative returns were posted, green bars indicate years with positive returns. As can be seen, the green bars predominate both in terms of extent and frequency. There were 16 rallies – several of them quite strong – while relatively small price declines were recorded in the remaining four years. In short, the gains were widely distributed and often quite impressive. |
Hasbro Pattern Returns, 1998 - 2018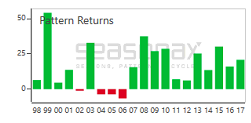 Hasbro, average return in percentage points from Jan. 31 to May 02, in every year since 1998 - Click to enlarge The stock posted relatively small losses on just four occasions. While there was one year with a truly outstanding gain (1999), the positive returns are generally broadly distributed, and include several years with a very strong performance. Even during the severe 2007 – 2009 bear market Hasbro managed to deliver large gains in the seasonally strong phase. Ironically three of the losing patterns occurred during the preceding bull market. |
Take Advantage of the Strongest Seasonal Periods!
As you can see, some individual stocks do exhibit strongly entrenched seasonal patterns of their own. This means that a great many more seasonal patterns exist in the stock market than suggested by the indexes alone.
Detailed information on the seasonal trends of individual stocks can be obtained by calling up “APPS SEASON” on a Bloomberg Professional Terminal, or entering the App Studio in the Thomson-Reuters Eikon menu and calling up the Seasonax app from there. There you can select any listed stock by entering its symbol into the app’s text field and quickly identify the most promising seasonal patterns. You will also be able to examine how your favored stocks typically respond to various events, such as the release of important economic data, elections, monetary policy decisions and so forth*.
Full story here Are you the author?Tags: newslettersent,The Stock Market