


Pater Tenebrarum
My articles My siteAbout meMy videosMy books
Follow on:TwitterSeeking AlphaFacebook
A Surprise Rout in the Bond MarketAt the time of writing, the stock market is recovering from a fairly steep (by recent standards) intraday sell-off. We have no idea where it will close, but we would argue that even a recovery into the close won’t alter the status of today’s action – it is a typical warning shot. Here is what makes the sell-off unique: |
30 Year Bond and 10 Year Note Yields, Nov 2016 - Oct 2018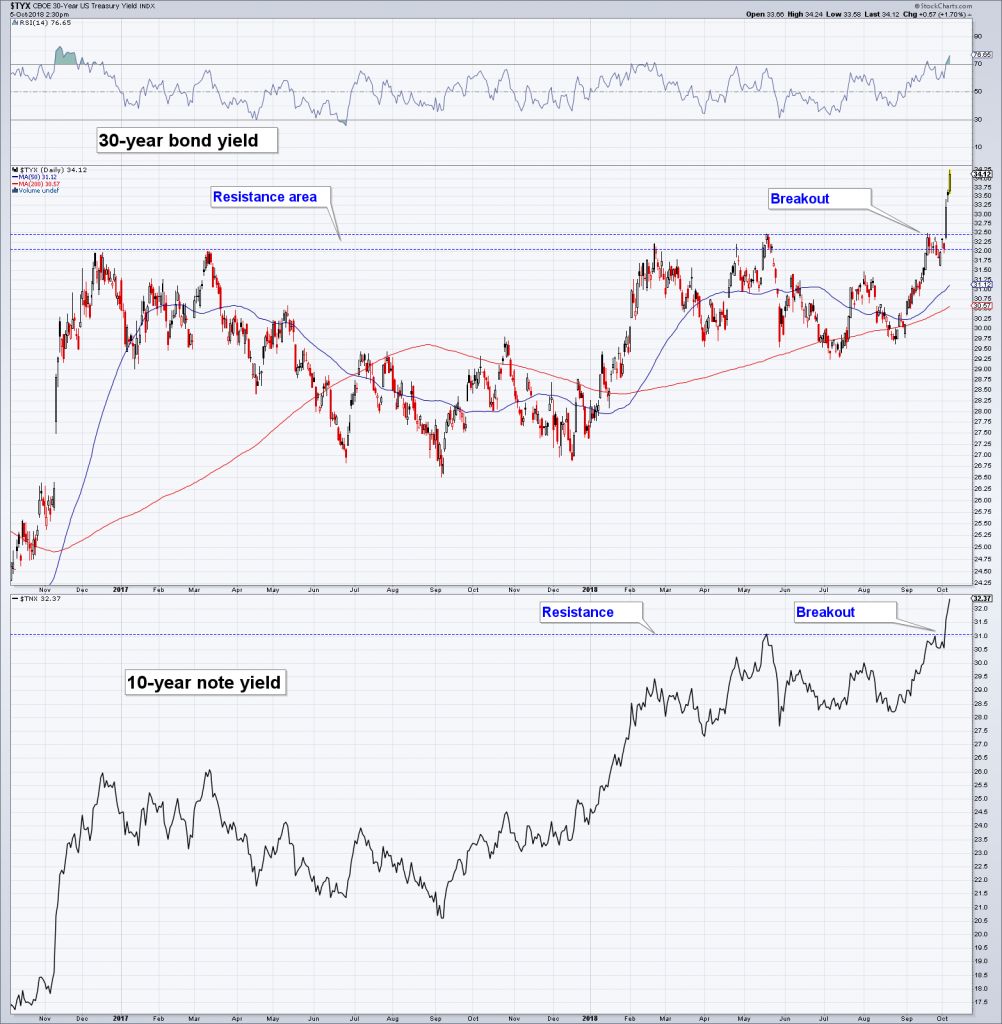 30 year bond and 10-year note yields have broken out from a lengthy consolidation pattern. This has actually surprised us, as we felt that the large speculative net short position in bonds and notes was prone to trigger a short covering rally. Alas, the opposite has happened. - Click to enlarge |
| Since the 1998 Russian crisis, the prices of stocks and bonds have been negatively correlated most of the time (note that they were positively correlated from 1942 to 1998, so the negative correlation is a fairly recent phenomenon from a longer term perspective). We did not really expect bond yields to break out, mainly due to the legacy CoT report, which recently looked as follows: |
Legacy CoT Report, Daily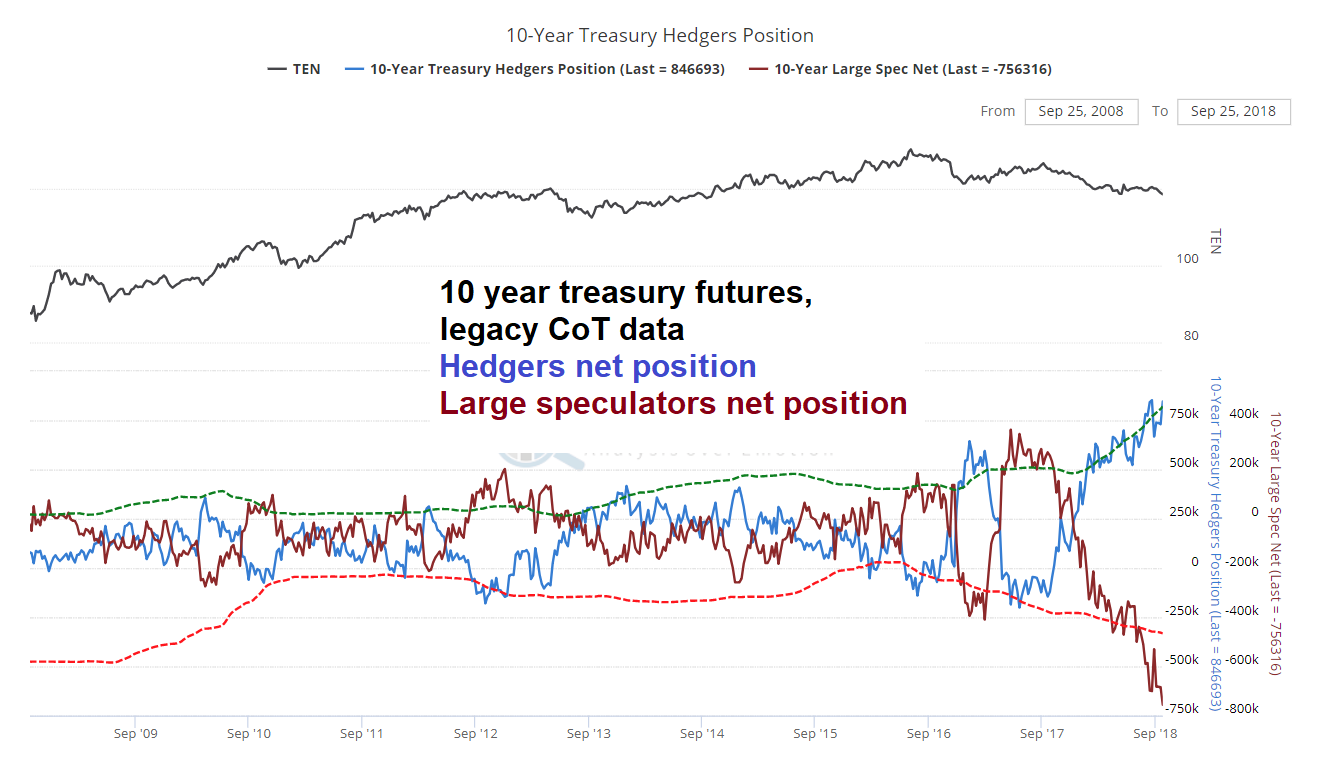 According to the legacy CoT report, large speculators recently held a record high net short position in 10-year treasury note futures. Usually these traders are wrong at extremes. - Click to enlarge |
| It is of course possible that the breakout in yields turns into a “false breakout”, in which case this position would be quickly unwound. However, in a recent post by Macro Tourist (Kevin Muir) it was pointed out that the disaggregated CoT report indicates the situation is not as simple as it appears at first glance. Here is a chart illustrating the disaggregated data:
Net positioning in treasury futures by trader group according to the disaggregated CoT report – asset managers actually hold a very large net long position – only leveraged funds and non-reportables (small speculators) hold large net short positions. In other words, the breakout could easily be “legit” and yields may have even more upside from here (perhaps after a retest of the breakout). |
Disaggregated Positions, 2012 - 2018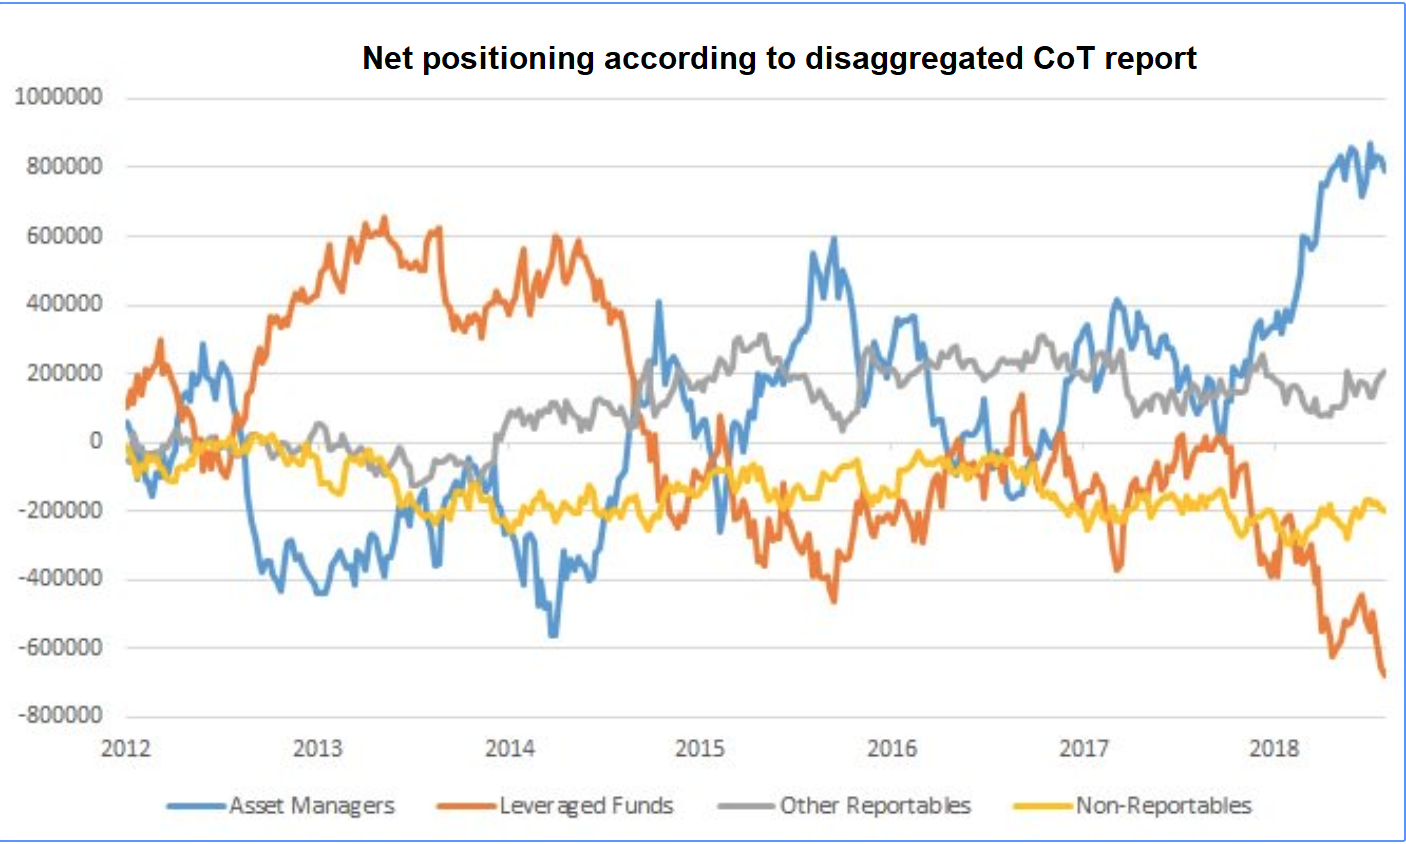 - Click to enlarge |
A Potentially Dangerous SituationIn recent years a popular investment strategy has been built around the negative correlation between stocks and bonds that is in place since 1998. The strategy is known as “risk parity” and has a towering amount of assets under management by now. Funds employing the strategy are reportedly usually leveraged between 1:2.5 to 1:4. The principle behind the strategy is that gains in bond positions are going to counter any downside volatility in equities. One could say it is a very primitive version of the “permanent portfolio”, or better, simply a mixed stock/bond allocation strategy with leverage. Obviously, whenever bonds and stocks suddenly decline at the same time, this strategy can get into considerable trouble. The last time this happened to an appreciable extent was in August 2015. Bonds declined due to capital outflows from China and a sell-off in stocks started at the time, initially driving the major indexes below their 50- and 200-day moving averages. This move very likely caused CTAs and other trend followers to reduce their equity exposure. Their selling in turn seems to have triggered stop loss orders at risk parity funds, which then induced volatility targeting strategies to sell due to the upward spike in the VIX (these funds reduce equity exposure when volatility increases). Trend followers then had even more reason to join the fray. Three days and 10 minutes of mayhem ensued: |
DJIA Mini Crash, May 2015 - Jan 2016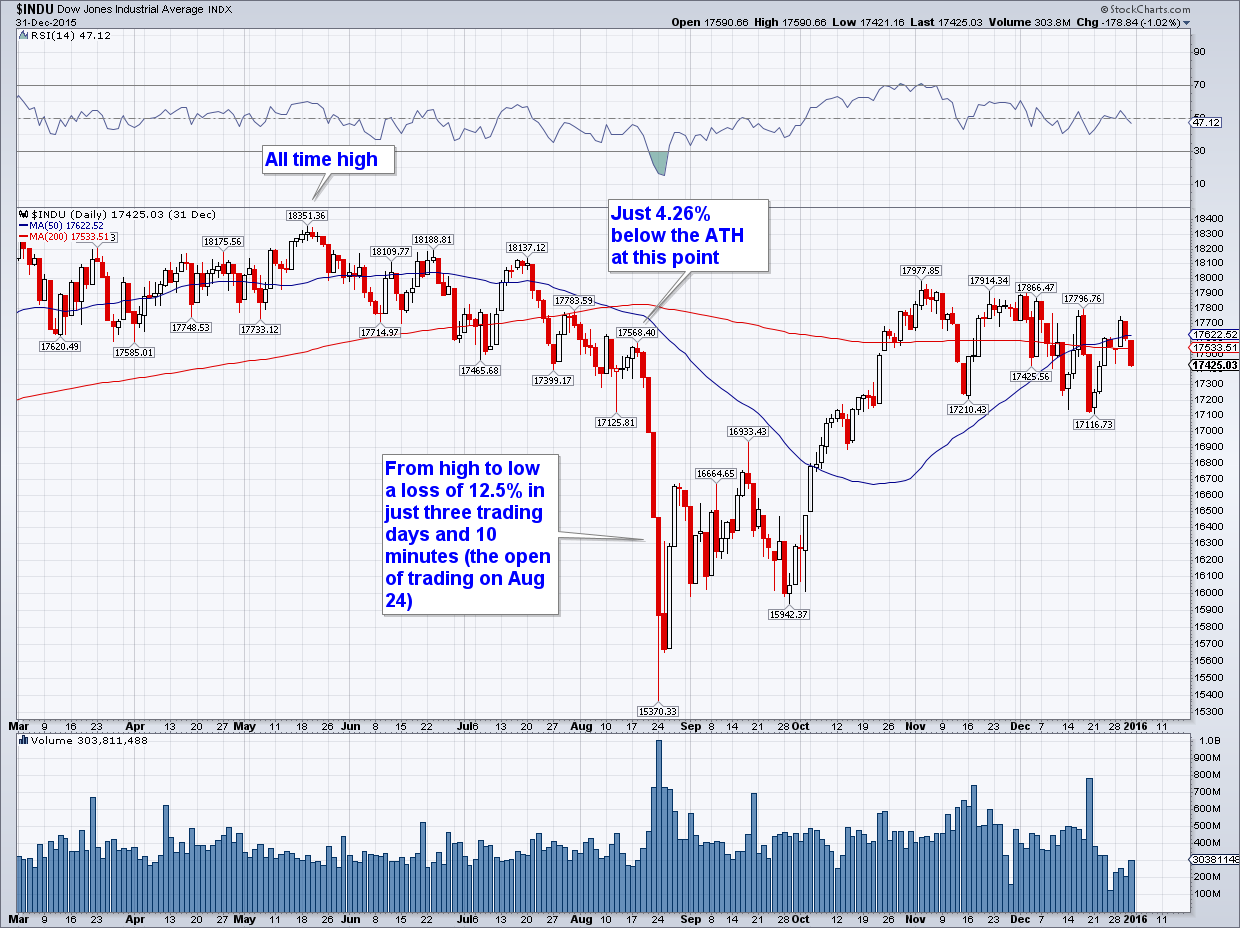 The August 2015 rout in the DJIA – down 12.5% in three trading days and 10 minutes. - Click to enlarge |
| We should point out that the technical position of the market is quite different at present, as most indexes are (or rather were) recently extremely overbought and traded far above their 200-day moving averages. In 2015 the stock market had moved sideways for quite some time – hence it didn’t take much to push prices below the 50- and 200-day moving averages at the time.
In today’s trading the Russell 2000 Index – which is the current downside leader – stopped falling and started to bounce right after hitting its 200-day ma. This moving average has contained every correction in the past two years, so traders (and algos) are now “trained” to buy declines to this level: We would guess that it is probably widely expected based on recent experience that the still relatively mild stock market decline of the past few days is just another buying opportunity. That may well turn out to be true, but the concurrent rout in the bond market is a new wrinkle that should perhaps not be dismissed too lightly. |
Russell 2000 Index, Daily, Nov 2017 - Oct 2018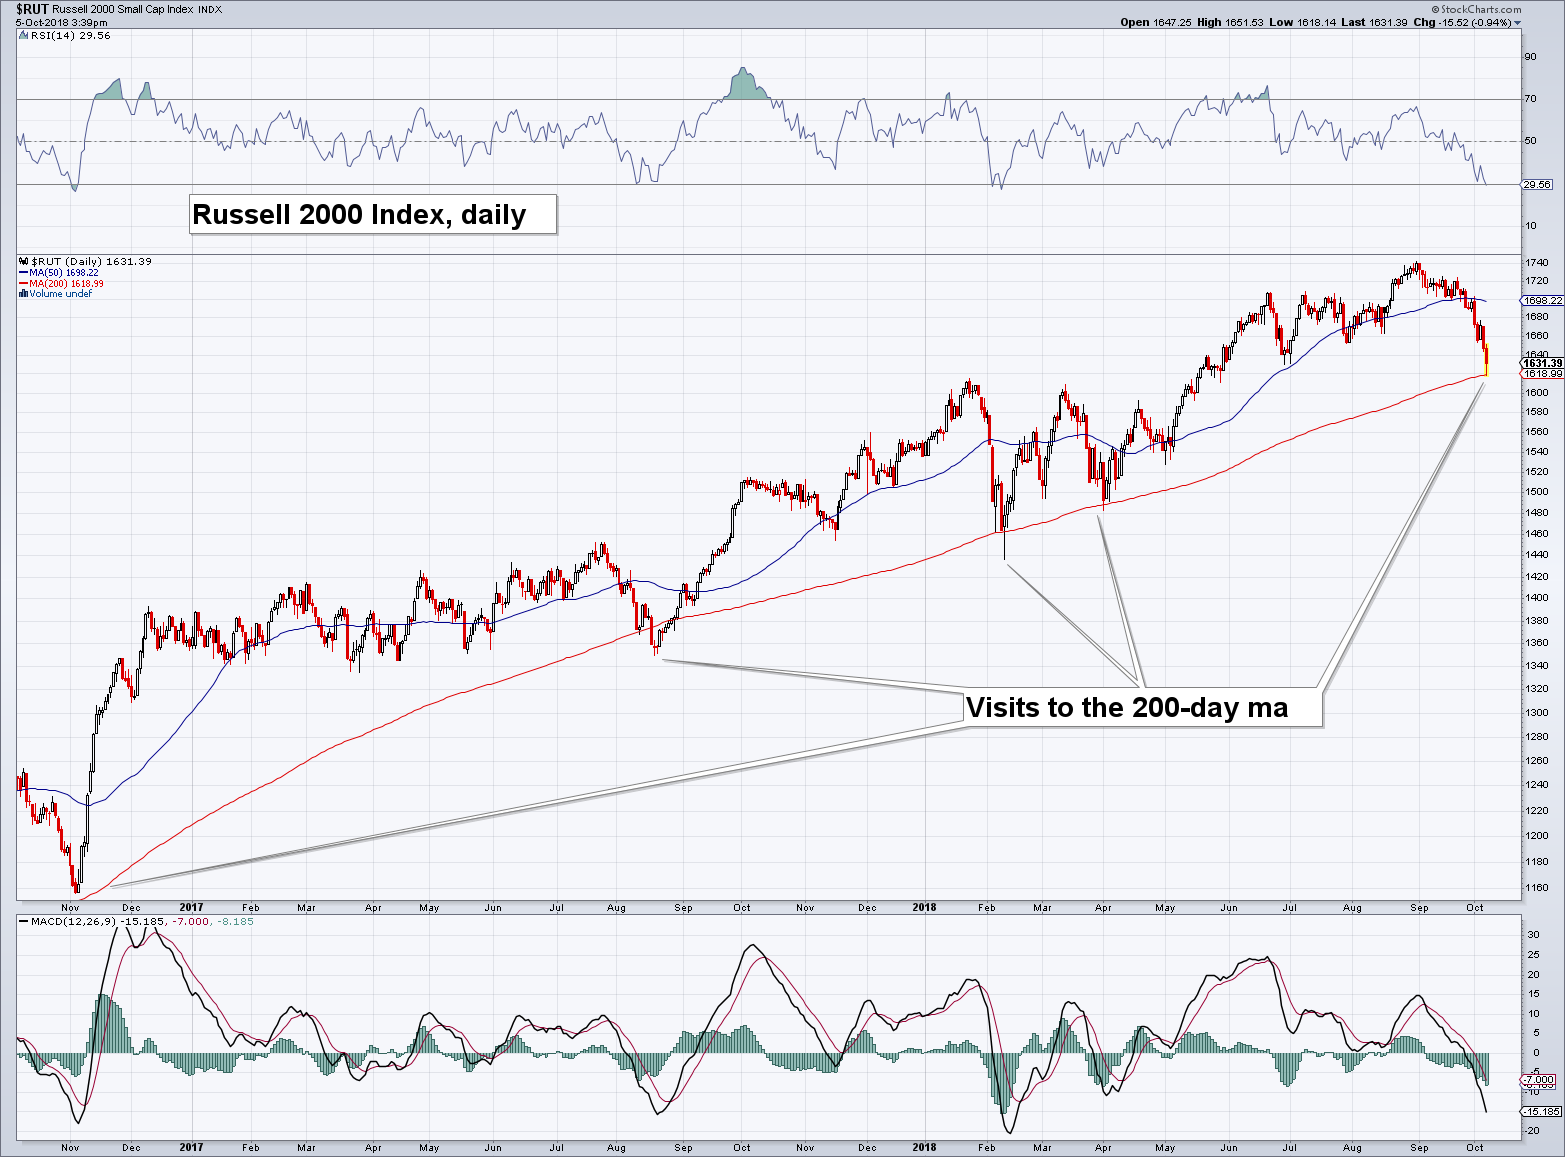 The Russell 2000 and the 200-day moving average over the past two years. - Click to enlarge |
|
There is a good reason why it may be relevant apart from the potential problems posed by issues related to market structure and the positioning of various funds and systematic strategies. We are referring to the effect of the bond rout on the yield curve, which is yet another warning sign: Note that the 10-2 year yield spread last widened this quickly during the sell-off in early February. A steepening yield curve at this late stage of the boom is a clear negative for risk assets and the economy – regardless of the “reason” for the steepening. Possible reasons are either an increase in inflation expectations, or a deterioration in economic confidence (which will tend to lower rate hike expectations). Neither is positive for stocks and the former is negative for stocks and bonds. |
10 Year Note Yield, Nov 2013 - Oct 2018 The 10-year minus 2-year treasury note spread as a proxy for the steepness of the yield curve. After tightening precipitously for a long time, the spread is suddenly widening quite rapidly. - Click to enlarge |
ConclusionThis is not the time to throw caution to the wind. Bonus Chart – Cash AllocationsWe have recently come across the following chart, which shows investor cash positions according to several surveys – this is relevant for the long term outlook: |
Cash Allocations, 1987 - 2018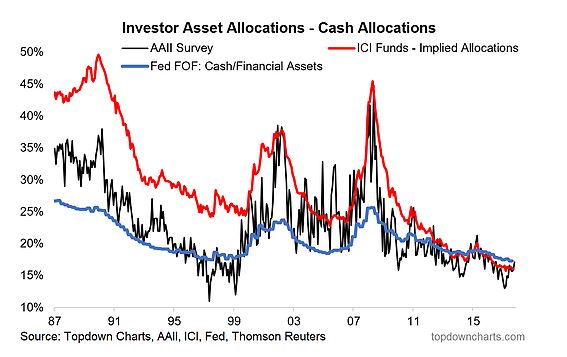 Cash allocations according to several surveys – not what you want to see if you are up to your eyebrows in stocks. - Click to enlarge |
Charts by: StockCharts, SentimenTrader, Macro Tourist, Topdown Charts.
Full story here Are you the author?Tags: Chart Update,Credit Markets,newsletter,The Stock Market


