The Vote Buying MirrorOur readers are probably aware of the influence the US election cycle has on the stock market. After Donald Trump was elected president, a particularly strong rally in stock prices ensued. Contrary to what many market participants seem to believe, trends in the stock market depend only to a negligible extent on whether a Republican or a Democrat wins the presidency. The market was e.g. just as strong under Democratic president Bill Clinton as it was under Republican president Ronald Reagan.
|
 The mid terms specter. |
| From a statistical perspective, the decisive factor for the market trend is not the party allegiance of the president, but rather the year of the presidency. In this context we speak of the presidential cycle, which has a distinct pattern over its four year duration.
The following chart depicts this election cycle, i.e., the average four-year pattern of the Dow Jones Industrial Average over more than a century. On the left hand side you see the pattern during the election year, followed by the first post-election year. Thereafter comes the mid-term pattern – which is highlighted by a red circle – and lastly the pre-election year pattern. In the past 116 years the DJIA delivered the strongest performance during election and pre-election years on average. Post-election years typically also managed to generate gains. The mid-terms were typically the weakest time period. 2018 is a mid-term year. Should we expect weakness in the stock market? Let us take a closer look at the mid-term pattern of the market. |
Dow Jones Index 1900 - 2015 DJIA, presidential election cycle since 1900. The mid-term year is the weakest period of the cycle - Click to enlarge |
The Typical Mid-Term Year Under the Magnifying GlassThe next chart shows the typical pattern in the Dow Jones Industrial Average during mid-term years. In short, it is a close-up of the time period circled in red in the first chart. The average mid-term year starts out with an advance, which is followed by weakness after peaking in mid April. In the final quarter of the year the market rallies again. Over the year as a whole, the market on average barely manages to gain ground. What does this mean for 2018?
|
DJIA, typical pattern during mid-term years since 1900 – a significant decline tends to begin in April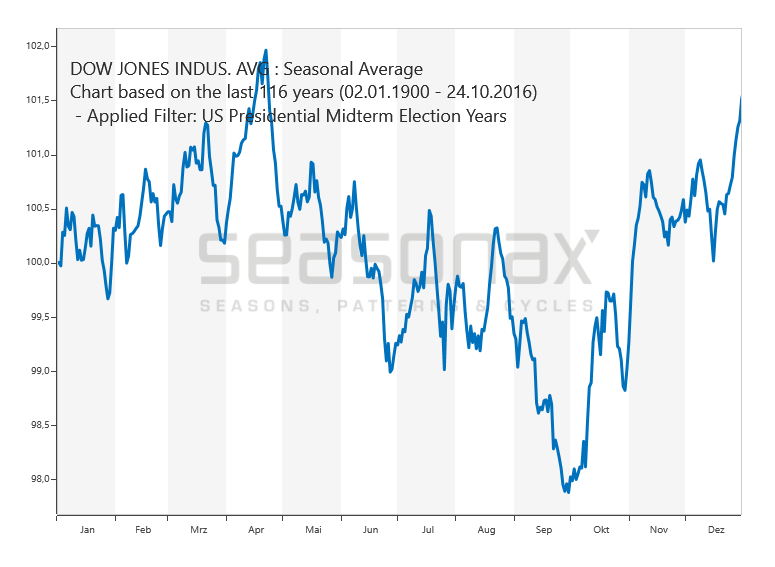 - Click to enlarge |
A Decline Threatens in 2018If the market moves sideways on average, it implies that prices fell in some years and rose in others. In the long run stock prices tend to rise, due to economic growth and particularly due to the continual debasement of money – just as in fact tends to happen in the other three years of the presidential cycle. Given that prices on average barely rise in mid-term years, there is obviously a heightened probability of declines. Thus there is a threat of a sizable fall in stock prices in 2018. And what about other markets, such as the gold market or the foreign exchange markets? Take a Look at the Effects of the Election Cycle on Other Markets as WellSomething you may not be aware of is that the election cycle affects other markets as well. This is something one can definitely take advantage of as a trader, investor or broker. In order to do so, visit my free-of-charge web site www.seasonalcharts.com or call up the Seasonax app on a Bloomberg or Thomson-Reuters system. Nothing is ever guaranteed in the markets, but you should let the probabilities work in your favor!
|
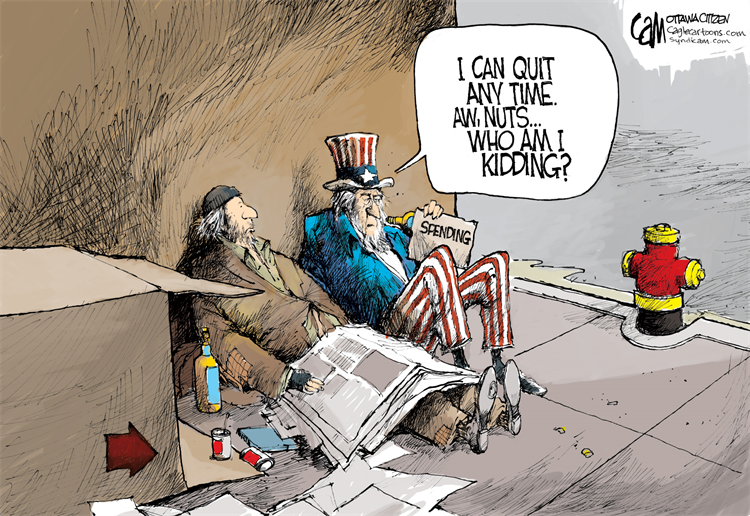
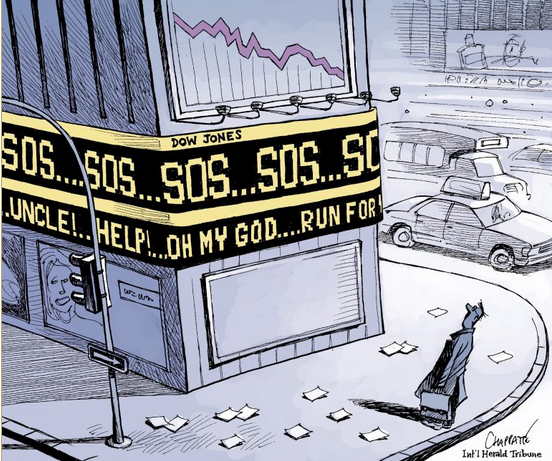
 Prepare, then this cannot happen to you… [PT] |
Tags: newslettersent,On Economy,On Politics,The Stock Market