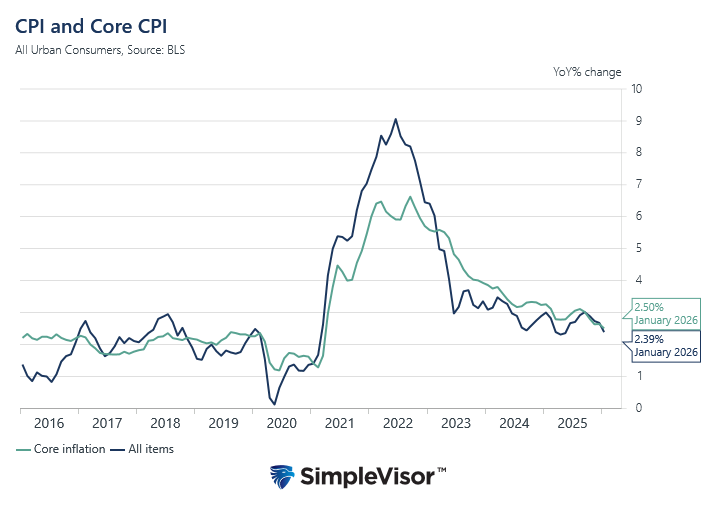
| And just like that, snap of the fingers, it’s gone. Without a “bad” Treasury auction, there was no stopping the bond market today from retracing all of yesterday’s (modest) selloff and then some. This despite the huge CPI estimates released before the prior session’s trading, and now PPI figures that are equally if not more obscene.
The BLS reports today that its main producer price index (PPI), the one for finished goods, was up 9.19% year-over-year in June 2021. That was a bit more than the 8.38% gain in May, but, and you don’t hear this much, still below the peak of 9.42% set back in April. The hot inflation continues, sure, but it’s no longer accelerating in its widest set. |
U.S. PPI Commodities Finished Goods Core YoY, Jan 2001 - Jan 2021 |
|
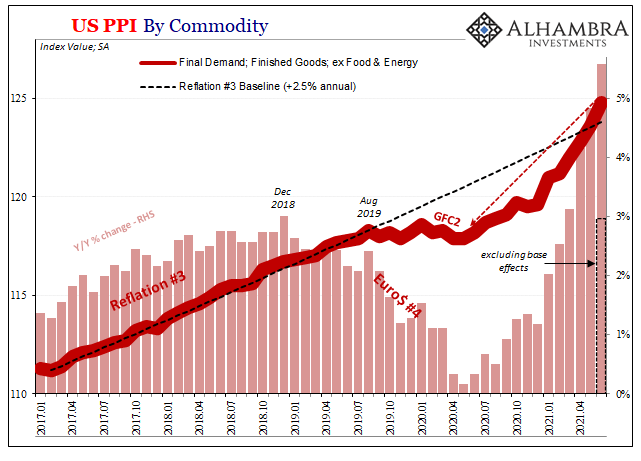
But the core rate continues to do just that. Excluding food and energy costs, the stripped-down version was 5.58% higher in June 2021 than June 2020. This was much faster than May’s already record high 4.83% (the core data doesn’t really go back that far).
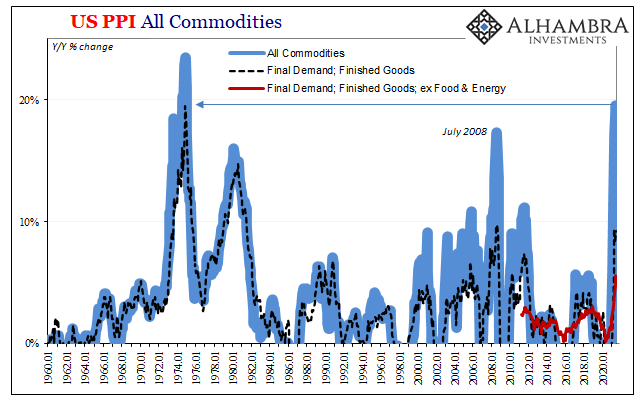
And then there are commodities; the PPI for just commodity prices increased just about 20% last month over the same month last year. The last time this section of the producer cost measurements reached 20%? Beating out the top in July 2008 by a few percentage points, you have to go all the way back to December 1974! |
U.S. PPI All History, Jan 1960 - Jan 2021 |
|
Like yesterday’s CPI, though, the market doesn’t care one bit about these extremes or their extreme comparisons. Why not? To begin with, despite the huge headlines there are a few pieces which indicate that, yes, these price deviations are large but they might already be on their way out. The main PPI, the one for finished goods, is a prime example. In the core index, base effects played a large part in the result; factoring for them, the increase in June “would” have been a bit less than 3%. That would still be an elevated rate when compared to recent years, but in the longer run context you can see that this sort of thing has happened before under much the same circumstances. |
U.S. PPI Core Base Effects, Jan 2017 - Jul 2021 |
|
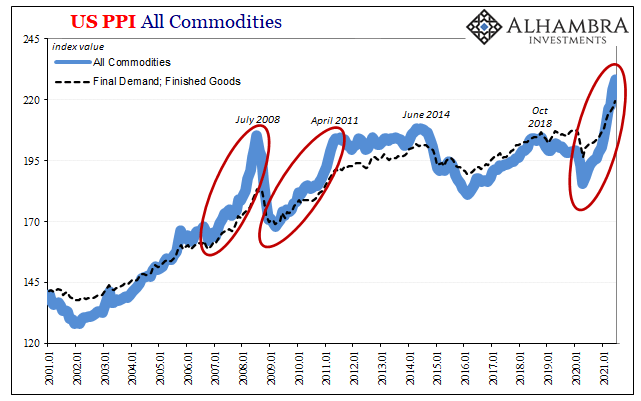
Commodity- or recovery-driven cost pressures were about the same in the first half of 2008 (which is why we keep seeing “highest since 2008” in many of these inflation numbers), give or take. That didn’t lead anywhere other than temporary because the economic background, being determined by the true shape of the reserve currency system, was in no way going to sustain those prices. Major deflationary buildup despite those big CPI and PPI estimates. Same, if to a lesser extent, in the 2010-11 period when recovery in demand outstripped supply particularly in the early days of the post-crisis period. Because it wasn’t actually a recovery, and like 2008 there had been increasing deflationary forces (in the same places as 2008, such as repo collateral), that price deviation proved only a little bit less temporary than the one which had just preceded it. |
U.S. PPI Commodities Finished Goods, Jan 2001 - Jan 2021 |
|
And since these things aren’t really anything new, the bond market has taken the latest one in stride even as some of these constituent indices seem more at home in the 70s and the Great Inflation. Following both the CPI release and now the equally epic PPI parts, yields are effectively lower when compared to two days ago! Much was made of yesterday’s selloff, when the rise in yields was comparatively much larger last Friday after China’s central bank announced the RRR cut which briefly sparked some modest reflationary enthusiasm (stimulus!) Therein lies the problem (and this yield “puzzle”). |
U.S. PPI UST RRP, Jul 2020 - Jul 2021 |
| As I wrote to end last week, you ever find China and RRR together they are not what you ever want to see. It represents an escalation in negative global factors not easily discernable (unless you know what you’re looking at) and not just plaguing China.
It’s not just that the Chinese are struggling with China-specific problems economic or the pandemic; on the contrary, they are, as the RRR saga has definitively illustrated time and time over the decade going back to 2011, perhaps the clearest example of these very same building deflationary eurodollar issues pushing awkwardly out of the shadows and being made into hard policy reactions (by very reluctant central bankers). Accepting the RRR as a warning, an escalation in a series of warnings dating back nearly five months to late February’s Fedwire reminder (of this always-present deflationary potential), the data for outlier consumer and producer price estimates in the US simply don’t make any difference. They are already being superseded by these far more impressive and dangerous negative deflationary factors which are becoming more visible (to those who aren’t captured by QE’s puppet shows) not less, and not receding. Inflationary potential, real inflationary potential, never really got very high to begin with at any point. Sure, the media spun the last reflation selloff as “historic”, but it was nothing of the sort. |
|
|
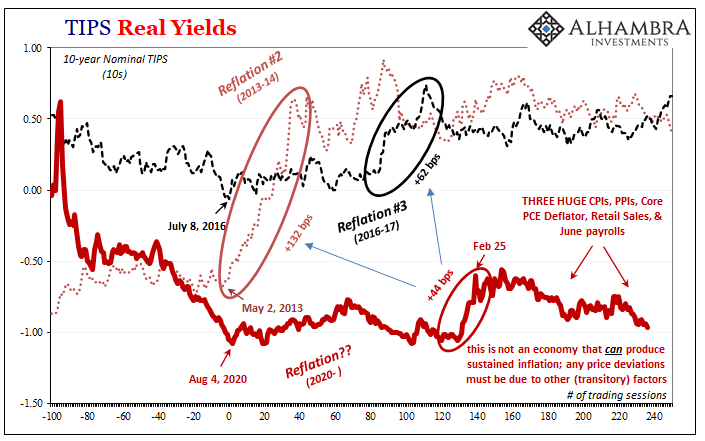
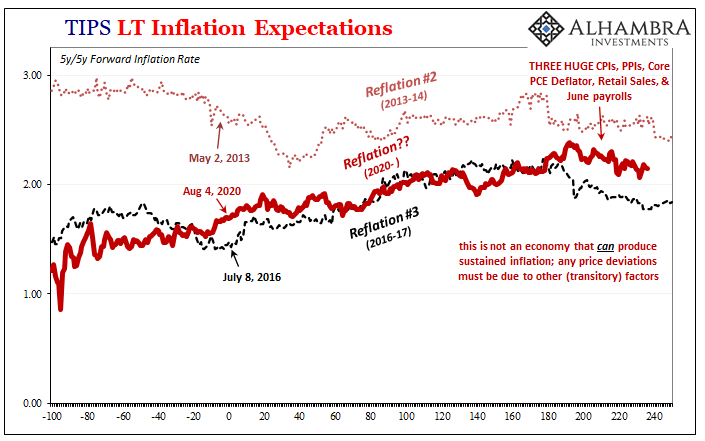
This is how you read something like the TIPS market, the difference between real yields and inflation breakevens (all adding up, by definition, to nominal Treasury rates). The breakevens (inverted) reflect these non-economic transitory influences like temporary supply problems and Uncle Sam’s check-writing which together are boosting US data – but only US data. Real yields, like nominal UST yields, each demonstrate expectations for an exceptionally pitiful economic background, far too much like 2008 and 2011 (and 2015 or 2018). Thus, not at all one which will, which can lead to sustained price pressures. And the balance of probabilities, again never much to begin with even in late February, they’ve continued to tip more and more in the wrong direction. |
U.S. PPI UST 10s Reflations |
| Though it sparked an immediate reflation-looking selloff in UST’s last week, China’s RRR will far more likely than not ultimately prove to be a signpost of caution as this wrong direction gains even more evidence and outcomes as time goes on.
This isn’t to say the market is expecting a big change in the near future, an impending crash right over the horizon. No. As before during these “cycles”, four of them since August 2007, this is a process which plays out over months, potentially more than a year. There will be twists and turns along the way, policy adjustments and heightened media-driven confusion, but if it keeps going in this direction we’d expect more escalating warnings (no matter how the CPI’s come out) and eventually confirmation – clear-as-day collateral days and then landmines. |
U.S. PPI UST 10s Real Reflations |
| I’ll review those next.
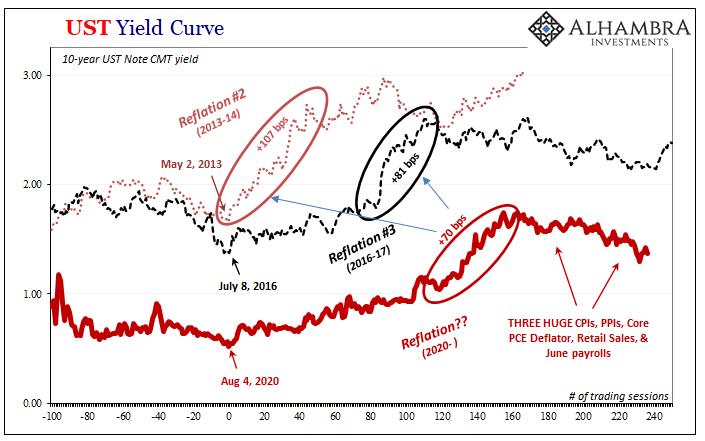
Until then, I’ll say it yet again, the inflation case was always the outlier from the very start (of Euro$ #4, actually). No matter how high each recent index jumps, the inflation case becomes even more of an outlier still because nothing outside of a few non-economic intrusions has really changed. Not for the better, or of the inflationary kind, anyway. And if you needed to see what I’m writing about in a visual format, it doesn’t get any clearer than this: |
U.S. PPI UST Reflations |
Full story here Are you the author? Previous post See more for Next post
Tags: Bonds,China,commodities,Consumer Price Index,CPI,currencies,Deflation,economy,Featured,Federal Reserve/Monetary Policy,inflation,inflation expectations,Markets,newsletter,PPI,producer prices,real rates,TIPS,U.S. Treasuries,Yield Curve


