Swiss FrancThe Euro has risen by 0.07% to 1.0691 |
EUR/CHF and USD/CHF, October 30(see more posts on EUR/CHF, USD/CHF, )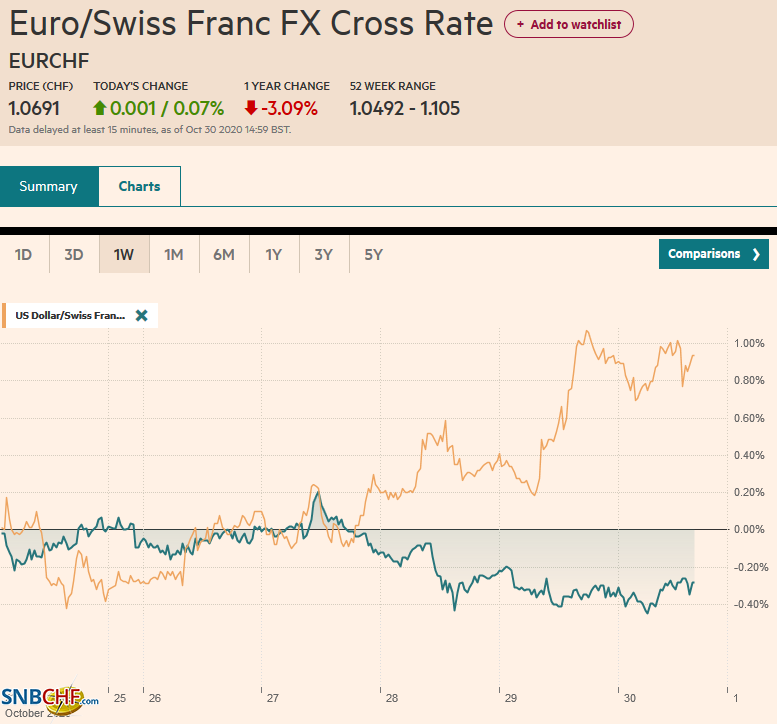 Source: markets.ft.com - Click to enlarge |
FX RatesOverview: Investors punished US tech giants for not delivering perfection as prices apparently had discounted, and the subsequent sell-off coupled with month-end dynamics has rocked global equities. Asia Pacific bourses were a sea of red, led by a 2.5% decline in the tech-heavy South Korean Kospi, but most major markets were off more than 1%. European equities are faring better, and are trying to snap a four-day decline. US shares are lower, and the S&P 500 is about 1% lower in electronic trade. Debt markets are not drawing much of a safe haven bid today. Benchmark 10-year yields are a little higher, and the US Treasury is near 0.81%. Given the rout in the equity markets, the currency market is also subdued. The dollar is mostly firmer but in late European morning turnover but little changed. The dollar is holding above key support near JPY104, while the euro has been unable to resurface above $1.17, as the market looks past the stronger than expected Q3 GDP figures. The liquid and accessible emerging market currencies are mostly lower, and the JP Morgan Emerging Market Currency Index is off for the fifth consecutive session. Gold is steady to firmer as this week’s 1.7% decline is consolidated. December WTI briefly slipped through the $35 a barrel mark yesterday but has bounced back above $36.50 to pare the biggest weekly loss since April. |
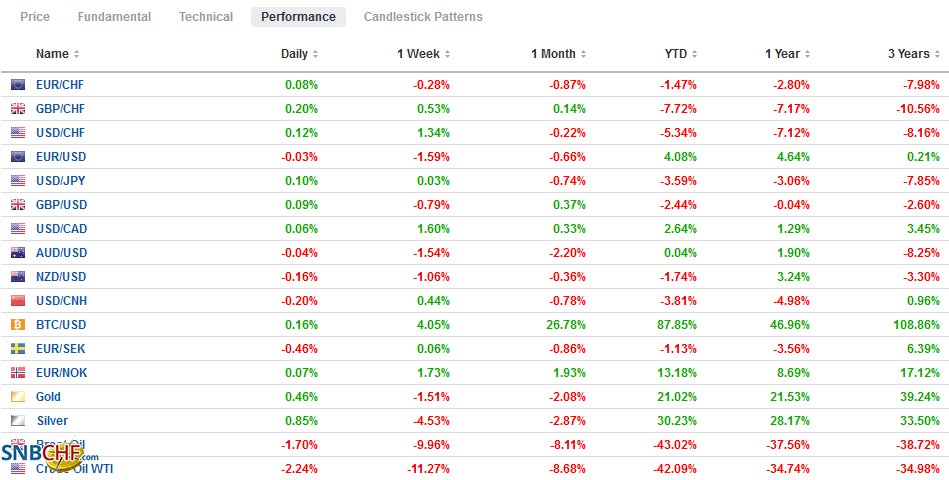
FX Performance, October 30 |
Asia PacificJapan reported a mixed bad of data. September industrial output rose 4% after a 1% gain in August. This was stronger than most expected (~3%), though it is still 9% below year-ago levels. Housing starts were weaker than expected, falling nearly 10% year-over-year, more than in August. The unemployment rate was steady at 3%. The uptick that many expected seems to have been expressed with an increase in the number of employed people but not at work (6.2% vs. 5.8% vs. 5% in January). The job-to-applicant ratio slipped to 1.03 from 1.04. Lastly, Tokyo’s October CPI fell to -0.3% from 0.2% as last year’s sales tax hike dropped out of the comparison. The 0.5% decline in the core rate was in line with expectations, after a -0.2% pace in September. |
Japan Unemployment Rate, September 2020(see more posts on Japan Unemployment Rate, )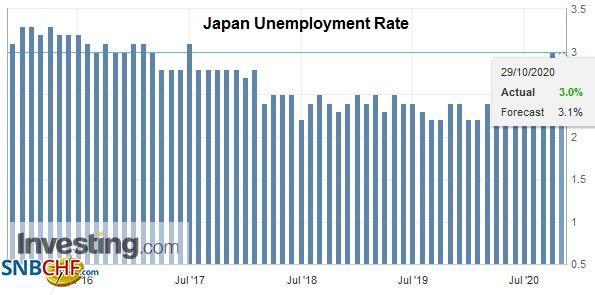 Source: investing.com - Click to enlarge |
China’s 14th Five-Year plan was large as billed. It is ambitious and continues to envision China’s rise, with a focus on technology, productivity, and modernity. Frustrating for many outside observers, the plan does not have a specific GDP goal, but China’s plan to enjoy GDP per capita of developed countries by 2035. China’s GDP per capita is estimated at a little more than the equivalent of $10k. Per capita GDP of high-income countries varies greatly, but the lower end is still 3-4 times China. Since the late 1980s, China’s GDP per capita has increased by around 30x. However, its demographics are moving from a tailwind to a headwind, which means productivity gains are increasingly essential.
The dollar is within yesterday’s range against the yen. It is holding support at JPY104, where a $1.4 bln option expires today. There are almost $3 bln in options at JPY104.50-JPY104.60 that may have already been neutralized. The next set is for around $1.7 bln is struck at JPY104.80-JPY104.85. The Australian dollar is also inside yesterday’s range and is holding support at $0.7000. Resistance is seen in the $0.7060-$0.7080 area. Net-net, it is little changed on the month, having settled in September near $0.7030. The PBOC set the dollar’s reference rate at CNY6.7232, a little stronger than anticipated, though a little lower than yesterday. The yuan rose for the second session today and appears poised to finish the week little changed after last week’s settlement of CNY6.6867.
EuropeECB President Lagarde was clear at yesterday’s press conference. The ECB will ease policy in December, and it likely will be on more than one channel as officials respond to the loss of economic momentum. Most market participants have been focused on the extension of its bond-buying programs. There has been some attention to the scope for lower rates. |
Eurozone Consumer Price Index (CPI) YoY, October 2020(see more posts on Eurozone Consumer Price Index, )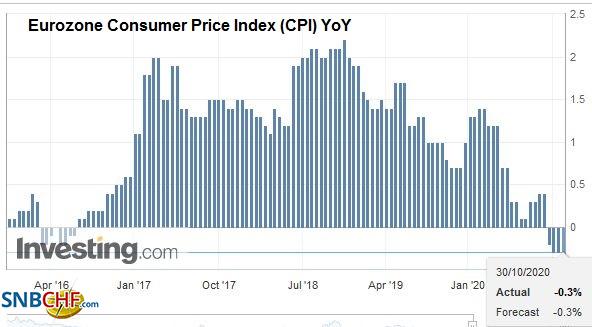 Source: investing.com - Click to enlarge |
| With the more negative rate on ECB loans (TLTRO) and belief that the so-called “reversal rate,” the level at which negative rates are counter-productive, is lower than the -50 bp deposit rate, plus the tiering (exclusion, so all deposits at the central bank are not hit with the negative rate) gives room to reduce rates. |
Eurozone Core Consumer Price Index (CPI) YoY, October 2020(see more posts on Eurozone Core Consumer Price Index, )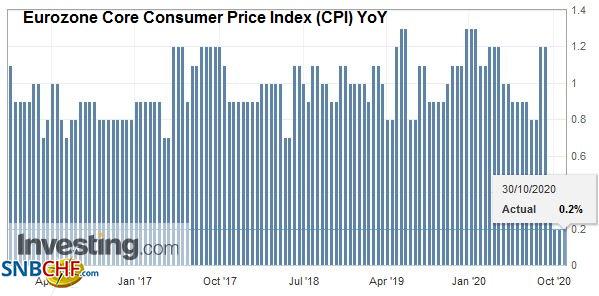 Source: investing.com - Click to enlarge |
| Also, the ECB may consider new long-term cheap loans. Although the Eurosystem is awash with excess liquidity, banks have reportedly begun tightening credit standards. |
Eurozone Unemployment Rate, September 2020(see more posts on Eurozone Unemployment Rate, ) Source: investing.com - Click to enlarge |
| The four large eurozone countries beat Q3 GDP expectations. Germany grew by 8.2%, more than the 7.3% forecast. France expanded by 18.2%, surpassing forecasts for a 15% expansion. Spain’s activity increased by 16.7%, besting the Bloomberg median forecast of 13.5%. Italy grew by 16.1%, well above forecasts for an 11% expansion. These reports translate into a 12.7% expansion in Q3 for the eurozone in aggregate. |
Eurozone Gross Domestic Product (GDP) YoY, Q3 2020(see more posts on Eurozone Gross Domestic Product, ) Source: investing.com - Click to enlarge |
| It follows an 11.8% contraction in Q2 and leaves the overall economy about 4.3% smaller than a year ago. The market is mostly looking past it as the data has been superseded by the spread of the contagion and the ECB’s commitment. Separately, the October CPI was slightly firmer than expected, rising by 0.2% on the month. |
Spain Gross Domestic Product (GDP) QoQ Q3 2020(see more posts on Spain Gross Domestic Product, )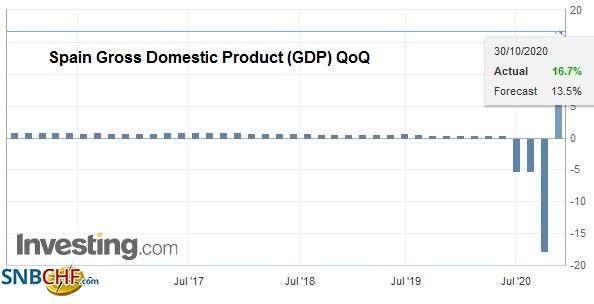 Source: investing.com - Click to enlarge |
| Still, the year-over-year figures were unchanged at -0.3% for the headline and +0.2% for the core. The September unemployment rate was unchanged at 8.3% after the upward revision to the August series. |
Italy Gross Domestic Product (GDP) YoY, Q3 2020(see more posts on Italy Gross Domestic Product, ) Source: investing.com - Click to enlarge |
The euro’s October low was set yesterday near $1.1650. It has held today, but the upside has not been impressive. The $1.1700 area, which was previously supported, now is resistance. There is an option for nearly 650 mln euros struck there that expires today. The euro finished last week around $1.1860 and ended September by $1.1720. Sterling was sold to about $1.2880 yesterday and has steadied today. It has recovered to almost $1.2960 in the European morning to approach an expiring option at $1.2965 for GBP200 mln. The intraday technicals are stretched as the North American session is about to begin. It is off about 0.65% this week but up about 0.3% on the month.
AmericaThe sell-off in tech shares is dominating market talk today. Without much of a recovery, the S&P 500 is set for its biggest weekly decline since June (~4.8%) or March. It finished September near 3363 and settled yesterday, about 3310. The ten-year yield is about 15 bp higher on the month at about 0.81%. |
U.S. Michigan Consumer Sentiment, October 2020(see more posts on U.S. Michigan Consumer Sentiment, )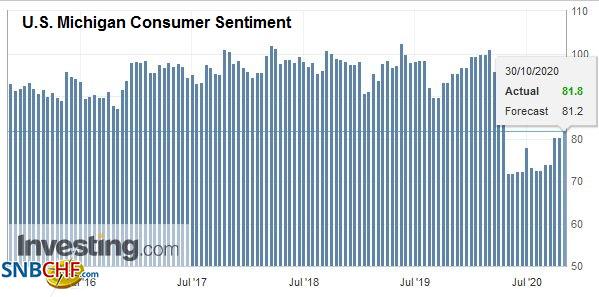 Source: investing.com - Click to enlarge |
| The US reports its GDP figures on a seasonally adjusted annualized rate. These figures were 33.1% for Q3 and -31.4% for Q2. On a quarter-over-quarter basis, to help compare the US report to Europe’s, it equates to roughly 7.4% and -9.0%. The US economy is about 3.5% smaller than it was at the end of 2019 and maybe about 7% smaller than it would have been without the pandemic-induced contraction. Estimates for Q4 GDP appear to be coming in around 0.6%-0.9% on a quarterly basis. |
U.S. Core PCE Price Index YoY, September 2020 Source: investing.com - Click to enlarge |
| The Q3 GDP figures have incorporated in today’s personal income and consumption data, though reactions to the headline cannot be ruled out. Of interest, the monthly deflator is expected to have ticked up to 1.5% and 1.7% for the headline and core rates, respectively. The University of Michigan’s final October consumer confidence report and the Chicago PMI are typically not market-movers. Canada reports its monthly GDP for August, which is too historical to have much impact. Mexico, on the other hand, publishes Q3 GDP today. The Bloomberg survey’s median forecast sees a 12.% expansion after a 17.1% contraction in Q2. If so, the economy is about 9% smaller than a year ago. |
U.S. Chicago Purchasing Managers Index (PMI), October 2020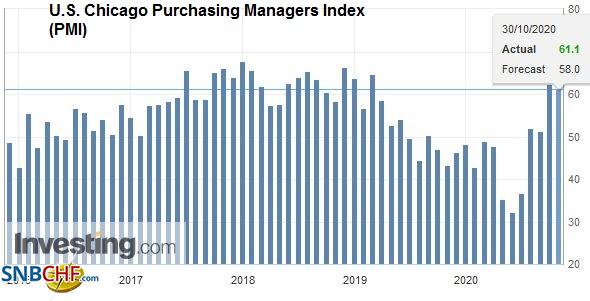 Source: investing.com - Click to enlarge |
| The US dollar almost reached CAD1.34 yesterday to record the month’s high. It settled near the middle of the range (~CAD1.3325) and has been largely confined to 25-ticks on either side. Its sensitivity to the broader risk environment and the intraday technicals warn of the risk of a retest on the CAD1.34-area. The September highs were set late in the month near CAD1.3420, and additional nearby chart resistance is seen near CAD1.3440. |
U.S. Personal Income MoM, September 2020(see more posts on U.S. Personal Income, )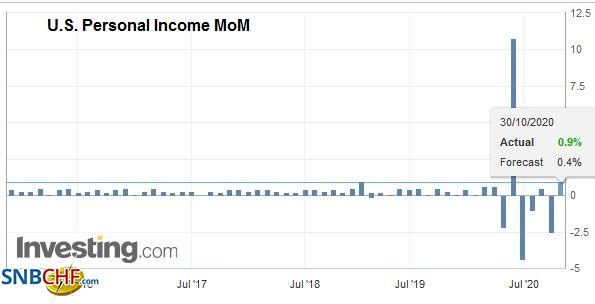 Source: investing.com - Click to enlarge |
| The greenback has firmed to new two-week highs against the Mexican peso of almost MXN21.50, which is roughly the (32.8%) retracement objective of this month’s greenback decline. The next retracement (50%) is nearer MXN21.68. Support now is seen around the 20-day moving average (~MXN21.23). |
U.S. Personal Spending MoM, September 2020 Source: investing.com - Click to enlarge |
Graphs and additional information on Swiss Franc by the snbchf team.
Full story here Are you the author? Previous post See more for Next postTags: #USD,$CNY,China,Currency Movement,ECB,EMU,Featured,newsletter


