George Dorgan
My articles My siteAbout meMy videosMy books
Follow on:LinkedINTwitterSeeking Alpha
CFA SocietyEconomicBlogs
| Rarely in the foreign exchange market is there a V-shaped extreme. Most of the time, the high or low is a process that is carved over time.
Although the explanation of the dollar’s weakness here in H1 vary, we continue to believe that the longer-term cyclical rally, the third since the end of Bretton Woods is intact. The key driver, the divergence of monetary policy broadly understood, may be obscured from time-to-time by other factors, such as positioning, political issues, financial arbitrage opportunities, economic surprises, and the like, but it remains intact. In fact, we would go one step further, and suggest the divergence of policy has not yet peaked. The Federal Reserve will likely raise rates again and begin to shrink its balance sheet, while the ECB and BOJ continue to expand their balance sheets and maintain not just low, but negative rates. Our correlation work continues to find most of the bilateral pairs strongly (relative to their twenty-year history) co-move with nominal interest rate differentials. |
EUR/CHF and USD/CHF, June 17(see more posts on EUR/CHF, USD/CHF, )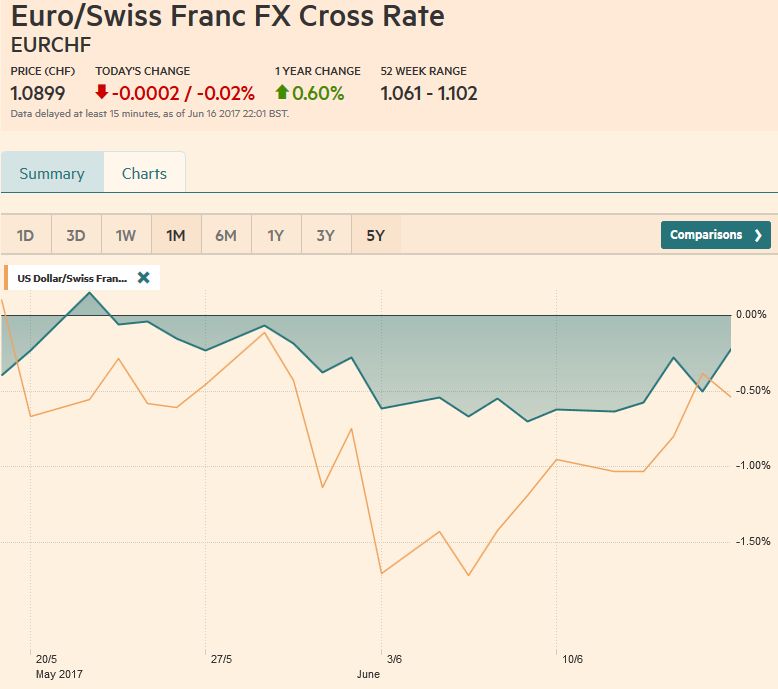 Source: markets.ft.com - Click to enlarge |
Swiss Franc Currency Index (3 years)The Swiss Franc index is the trade-weighted currency performance (see the currency basket)On a three years interval, the Swiss Franc had a weak performance. The dollar index was far stronger. The dollar makes up 33% of the SNB portfolio and 25% of Swiss exports (incl. countries like China or Arab countries that use the dollar for exchanges). Contrary to popular believe, the CHF index gained only 1.73% in 2015. It lost 9.52% in 2014, when the dollar (and yuan) strongly improved. |
Swiss Franc Currency Index (3 years), June 17(see more posts on Swiss Franc Index, )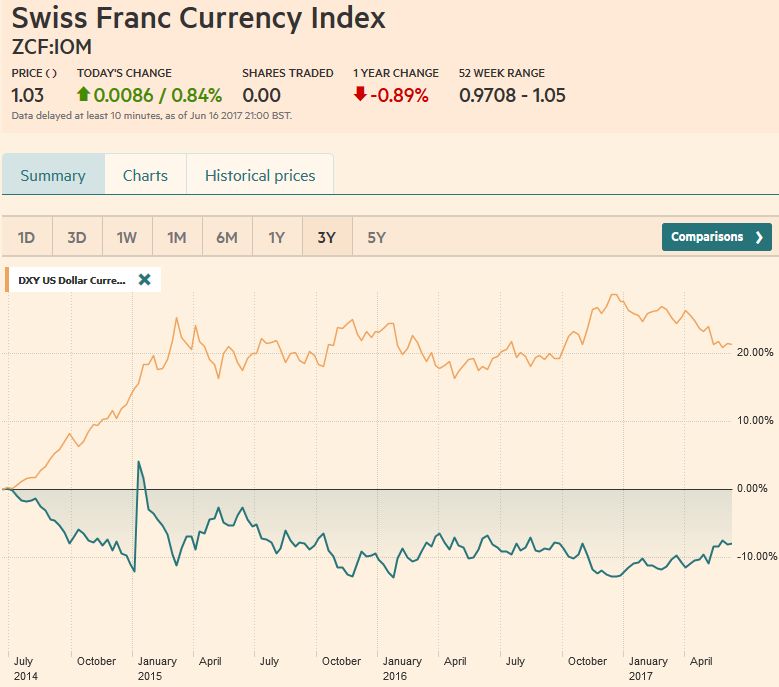 Source: markets.ft.com - Click to enlarge |
Marc Chandler My articles My offerMy siteAbout meMy videosMy books Follow on:LinkedINTwitterSeeking AlphaAmazon USD/CHF |
US Dollar/Swiss Franc FX Spot Rate, June 17(see more posts on USD/CHF, )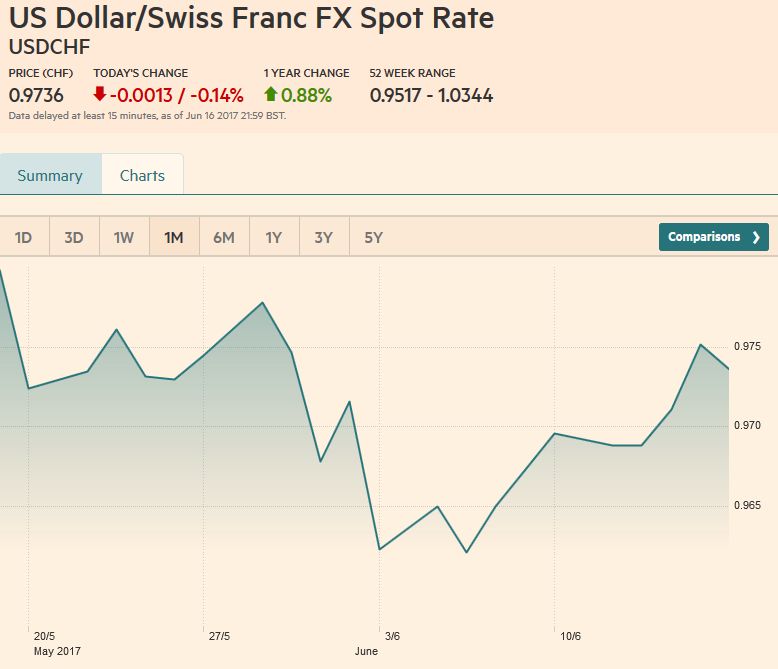 Source: markets.ft.com - Click to enlarge |
US Dollar IndexThe dollar’s technical tone is improving. Looking at the Dollar Index, there have been three favorable technical developments. First, the spike low recorded in the middle of last week; the brought the Dollar Index to its lowest level in the US election last November, was not confirmed by the technical indicators, leaving a bullish divergence. Second, the reason it was not confirmed was that the dollar reversed higher (perhaps a hammer candlestick). Third, the five-day moving average cross above the 20-day average for the first time in a month. The immediate cap is in the 97.70-97.80 area. Overcoming it would target 98.50, the last significant hurdle ahead of 100. A break of 96.80 on the downside warns that more work needs to be done. |
US Dollar Currency Index, June 17(see more posts on U.S. Dollar Index, )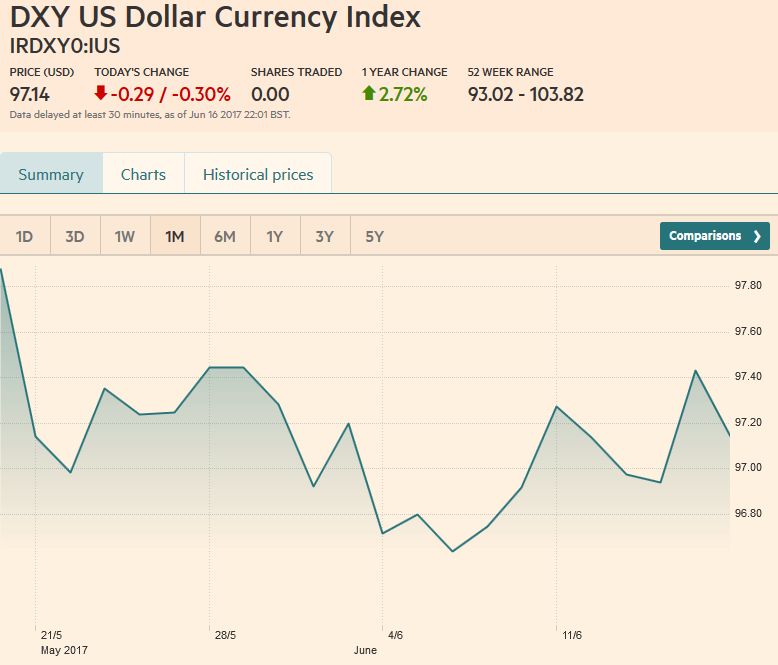 Source: markets.ft.com - Click to enlarge |
EUR/USDThe euro’s technical tone is the mirror image. Bearish divergence with technical indicators moving lower even though at mid-week the euro made a marginal new high. The five and 20-day moving averages crossed for the first time in nearly two months. Our lingering concern is that interest rate differentials, at the two- and ten-year spread has moved to the US. Arguably it is a function of disappointing US economic data (less consumption, subsiding price pressures, fewer inventories), and a backing up of eurozone interest rates, especially in Germany. A break of $1.1110 is needed to signal the morphing of the broadly sideways consolidation to an outright correction. On the upside, a move above the $1.1220 area may be seen as an early signal of a running start at the $1.13 cap. |
EUR/USD with Technical Indicators, June 17(see more posts on Bollinger Bands, EUR/USD, MACDs Moving Average, RSI Relative Strength, Stochastics, )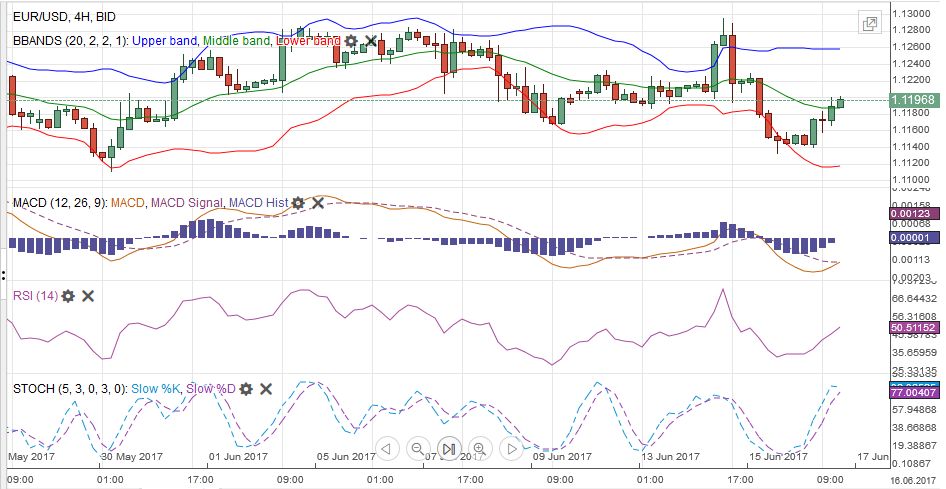 EUR/USD Week Ending June 17 with Technical Indicators - Click to enlarge |
USD/JPY
The dollar popped higher against the yen after making a new two-month low in the middle of last week (~JPY108.85). It finished the week a little below JPY111.00, snapping a two-week drop. It recorded an outside up week, a bullish bar chart pattern. It closed above its 20-day moving average for the first time in a month, and although the five-day moving average has not crossed above, it looks poised to early in the week ahead. Because US Treasury yields, as we shall see, are not so supportive and the upside momentum in equities appears to have stalled as the quarter draws to a close, it may be best take it one step at a top, even if a more durable dollar low is in place. Initial resistance is JPY111.60 and then JPY112.25, before JPY113.00. On the other hand, a move below JPY110.50 would be an initial warning that the dollar bears have not given up. |
USD/JPY with Technical Indicators, June 17(see more posts on Bollinger Bands, MACDs Moving Average, RSI Relative Strength, Stochastics, USD/JPY, )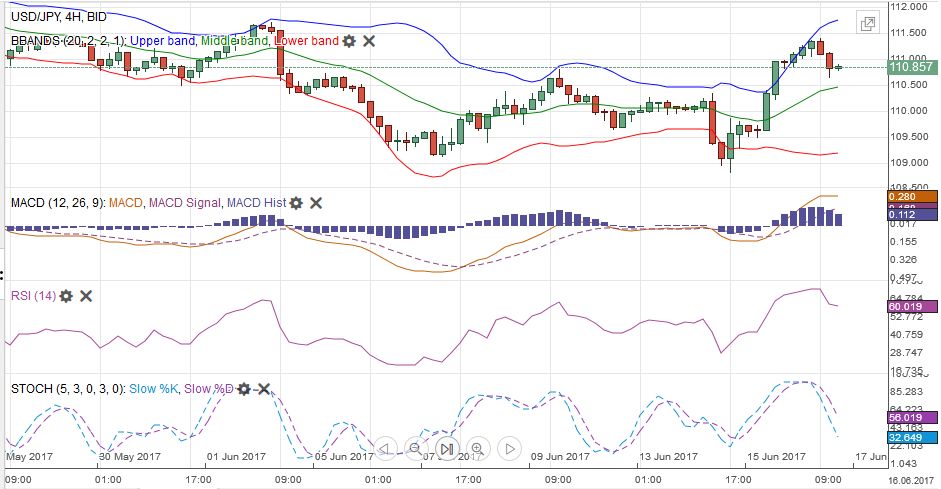 USD/JPY Week Ending June 17 with Technical Indicators - Click to enlarge |
GBP/USDSterling spent last week consolidating the losses seen in the wake of news that the Tories lost their majority. Helped, as we noted by the MPC vote, sterling retraced half of those losses (~$1.2810) before stalling. A narrative of a soft Brexit post-election seems on a weak foundation. The UK’s ask is contradictory from the EU’s point of view. It cannot abandon EU rules on immigration and reasonably expect to have the privileges of the single market. This is the red line beneath the proclamations and declarations.
Brexit negotiation begins next week. The first set of issues is the terms of the amputation. This will mostly revolve around how much money the UK needs to pay to relieve its responsibilities and commitments. The technical indicators are not generating a strong signal which may suggest range-affair between $1.2650 and $1.2850.
When all is said and done, sterling continues to be resilient against the dollar. We suspect this reflects the dollar’s poor performance. The euro made news highs for the year against sterling (~GBP0.8865) early last week.
|
GBP/USD with Technical Indicators, June 17(see more posts on Bollinger Bands, GBP/USD, MACDs Moving Average, RSI Relative Strength, Stochastics, )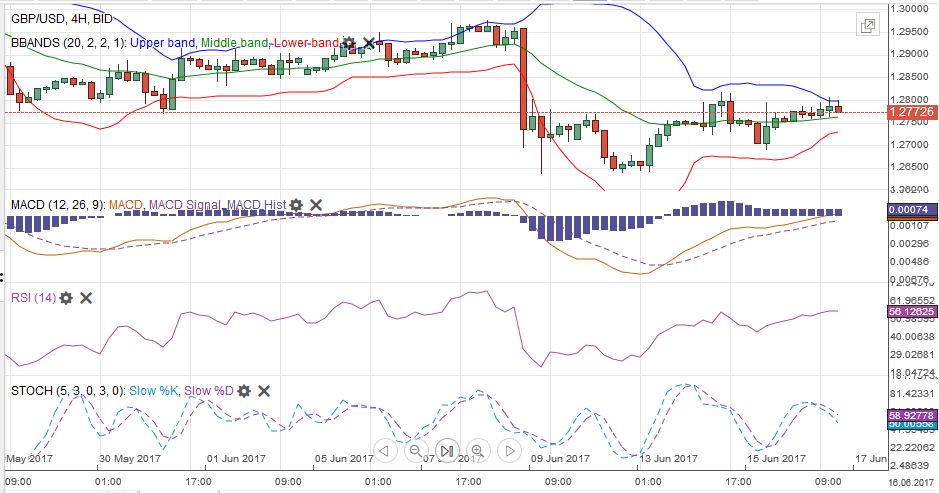 GBP/USD Week Ending June 17 with Technical Indicators - Click to enlarge |
AUD/USD
The strong employment report in Australia may have been flattered by shifting the sample pool, but the market seemed to conclude that it was somewhat less likely that the central bank will cut rates again as many economists thought. The double top we identified in February and March near $0.7750 projected that the Australian dollar would fall to $0.7250. It stopped last month near $0.7330. The weekly close above $0.7600 suggests a running start, with lighter participation, at the old nemesis near $0.7700. |
AUD/USD with Technical Indicators, June 17(see more posts on Australian Dollar, Bollinger Bands, MACDs Moving Average, RSI Relative Strength, Stochastics, )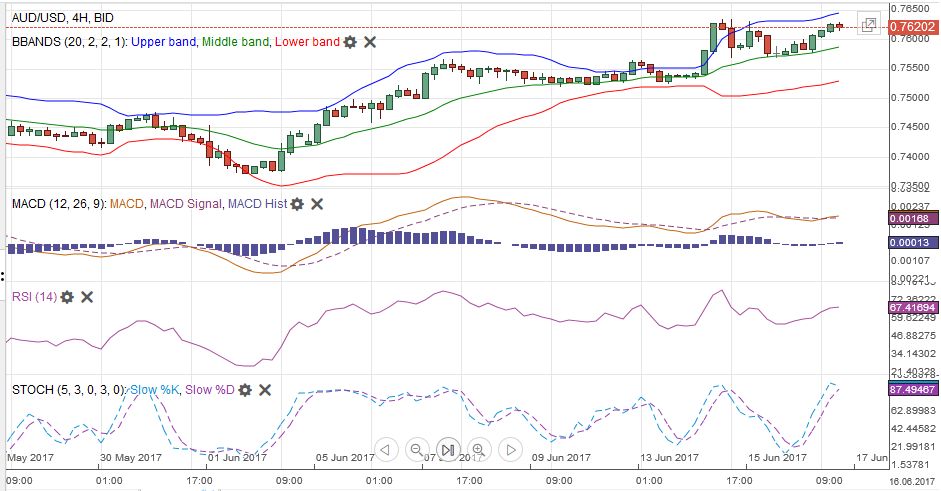 AUD/USD Week Ending June 17 with Technical Indicators - Click to enlarge |
USD/CAD
The Canadian and Australian dollars did well, rising around 1.8% and 1.2% respectively against the US dollar last week. The Canadian dollar’s rally was driven by the change in interest rate expectations. The consolidation pattern (triangle or flag?) may be traced in the near-term, but we expect additional Canadian dollar strength that can see the US dollar fall to CAD1.30-CAD1.31. The market’s response to comments by the Deputy Governor of the Bank of Canada illustrates the power of this force. She suggested that the strength of the recent data (e.g., 3.7% Q1 GDP, 77k new full-time jobs in May and average of nearly 43k year-to-date) may warrant the central bank re-examining the level of accommodation that is appropriate. The Canadian dollar rallied around 2.5% in response (over a few days), as the two-year yield jumped about 20 bp, as did the implied yield of the Dec 17 BA futures. |
USD/CAD with Technical Indicators, June 17(see more posts on Bollinger Bands, Canadian Dollar, MACDs Moving Average, RSI Relative Strength, Stochastics, )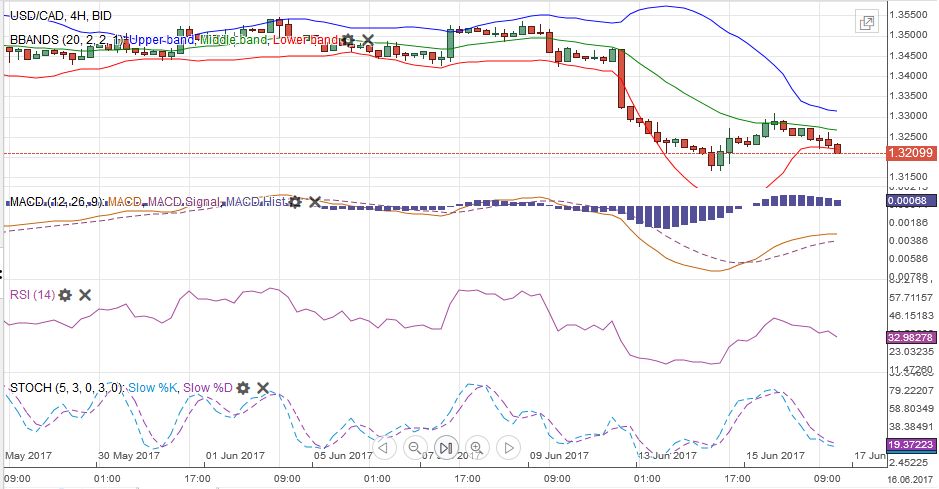 USD/CAD Week Ending June 17 with Technical Indicators - Click to enlarge |
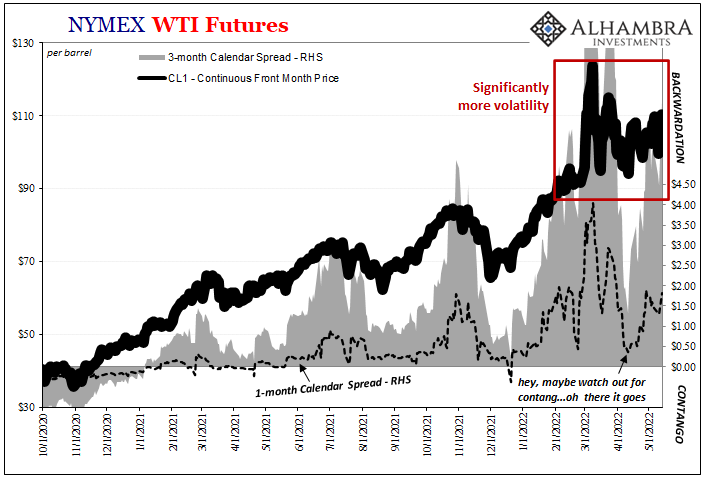
Crude OilThe front-month August light sweet crude oil futures contract came within a penny of the May low ($44.45) before the weekend. It proceeded to reverse higher and closed a little below the previous day’s high. The price action punctuates the four-week slide in prices during which prices have slid around 12%. The potential key reversal requires follow-through buying to confirm it. The $46-$47 area will be the first important hurdle. The MACDs and Slow Stochastics are poised to turn higher. |
Crude Oil, June 2016 - June 2017(see more posts on Crude Oil, )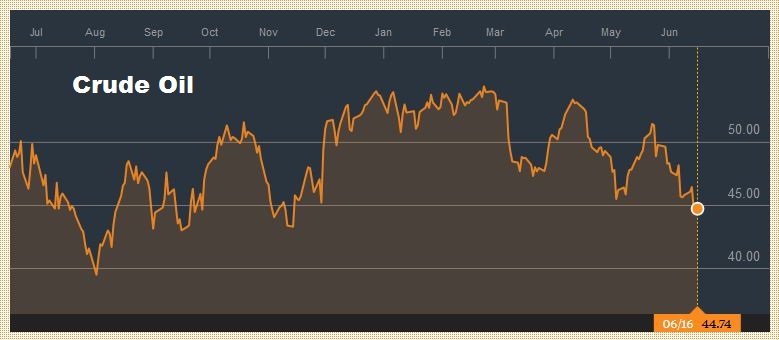 Source: bloomberg.com - Click to enlarge |
U.S. Treasuries
The US 10-year yield fell to 2.10% on the disappointing data. The Fed hike, signaling an earlier than expected begin to allowing the balance sheet to shrink (“relatively soon,” we think means an announcement in September for an October start), saw yields rise but not very convincingly. We fear the 10-year yields may completely unwind what is referred to as the Trump trade. At the end of last October, the 10-year yields were around 1.85%. Recall last July; the 10-year note futures was near 135-00. At 127-10 it retraced 38.2% of the subsequent decline. The next target is 128-20. |
Yield US Treasuries 10 years, June 2016 - June 2017(see more posts on U.S. Treasuries, )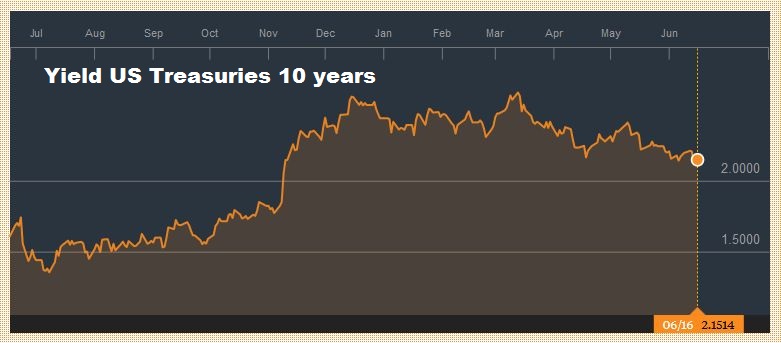 Source: bloomberg.com - Click to enlarge |
S&P 500 IndexThe S&P 500 closed marginally lower for the second consecutive week. During those two weeks, the benchmark has lost less than 0.5%. It is holding above the 20-day moving average found a little below 2422. However, the technical indicators (RSI, MACDs, and Stochastics) have turned down, warning of near-term downside risks. We wonder if into the end of the quarter; there is not some more profit-taking in equities, where the market is up in H1 what it was up for all of 2016 (~9%). However, an informal survey and anecdotal stories suggest that the way many global equity managers made money in H1 (unhedged Europe, EAFE, and/or emerging market equities) was how they expect to make money in the new quarter. |
S&P 500 Index, June 17(see more posts on S&P 500 Index, ) Source: markets.ft.com - Click to enlarge |
Are you the author?
Tags: Australian Dollar,Bollinger Bands,British Pound,Canadian Dollar,Crude Oil,EUR/CHF,EUR/USD,Euro,Euro Dollar,GBP/USD,Japanese yen,MACDs Moving Average,newslettersent,RSI Relative Strength,S&P 500 Index,Stochastics,Swiss Franc Index,U.S. Dollar Index,U.S. Treasuries,usd-jpy,USD/CHF,USD/JPY