


Joseph Y. Calhoun
My articles My siteAbout meMy videosMy books
Follow on:LinkedINTwitterSeeking AlphaAmazon
Note: This update is longer than usual but I felt a comprehensive review was necessary.
The Federal Reserve panicked last week and spooked investors into the worst week for stocks since the onset of COVID in March 2020. The S&P 500 is now firmly in bear market territory but that is a fraction of the pain in stocks and other risky assets. Stocks are now down 10 of the last 11 weeks but the pain was concentrated in the last two weeks. 5 of the last 8 trading days have seen 90% of the stocks in the S&P 500 down on the day and there are only 11 stocks in the index up over the last month. Unprecedented is an overused word but not in this case. Last week was also the second week in a row that saw all the major asset classes down on the week.
And energy stocks led the way down, getting the correction I talked about last week a lot sooner than even I expected. Crude oil and natural gas were both down hard last week (10.5% and 21.5% respectively) and some other economically-sensitive commodities were also down last week (copper, palladium, platinum).
But back to the Fed panic. The Fed has, since the Bernanke years, practiced what it calls forward guidance. This basically consists of telling the market what they are going to do before they do it. They always add the caveat that it depends on incoming data but it takes a lot to change their course once it is set. The Fed had prepared the market for a 50 basis point hike at last week’s meeting with Powell explicitly saying that 75 basis points was off the table. And I think there were – and are – very good reasons for that. The end of the Fed/Treasury MMT/helicopter drop experiment pretty much ensures that inflation will moderate over the coming months regardless of what the Fed does. But the market reaction to the CPI report apparently spooked the Fed and they leaked a story to the WSJ early last week that put 75 basis points back on the table.
| Actually, it more than did that since merely leaking the possibility was tantamount to signaling that course. And on Wednesday they did exactly that and I’m sure felt pretty good about themselves as stocks managed to finish the day higher.
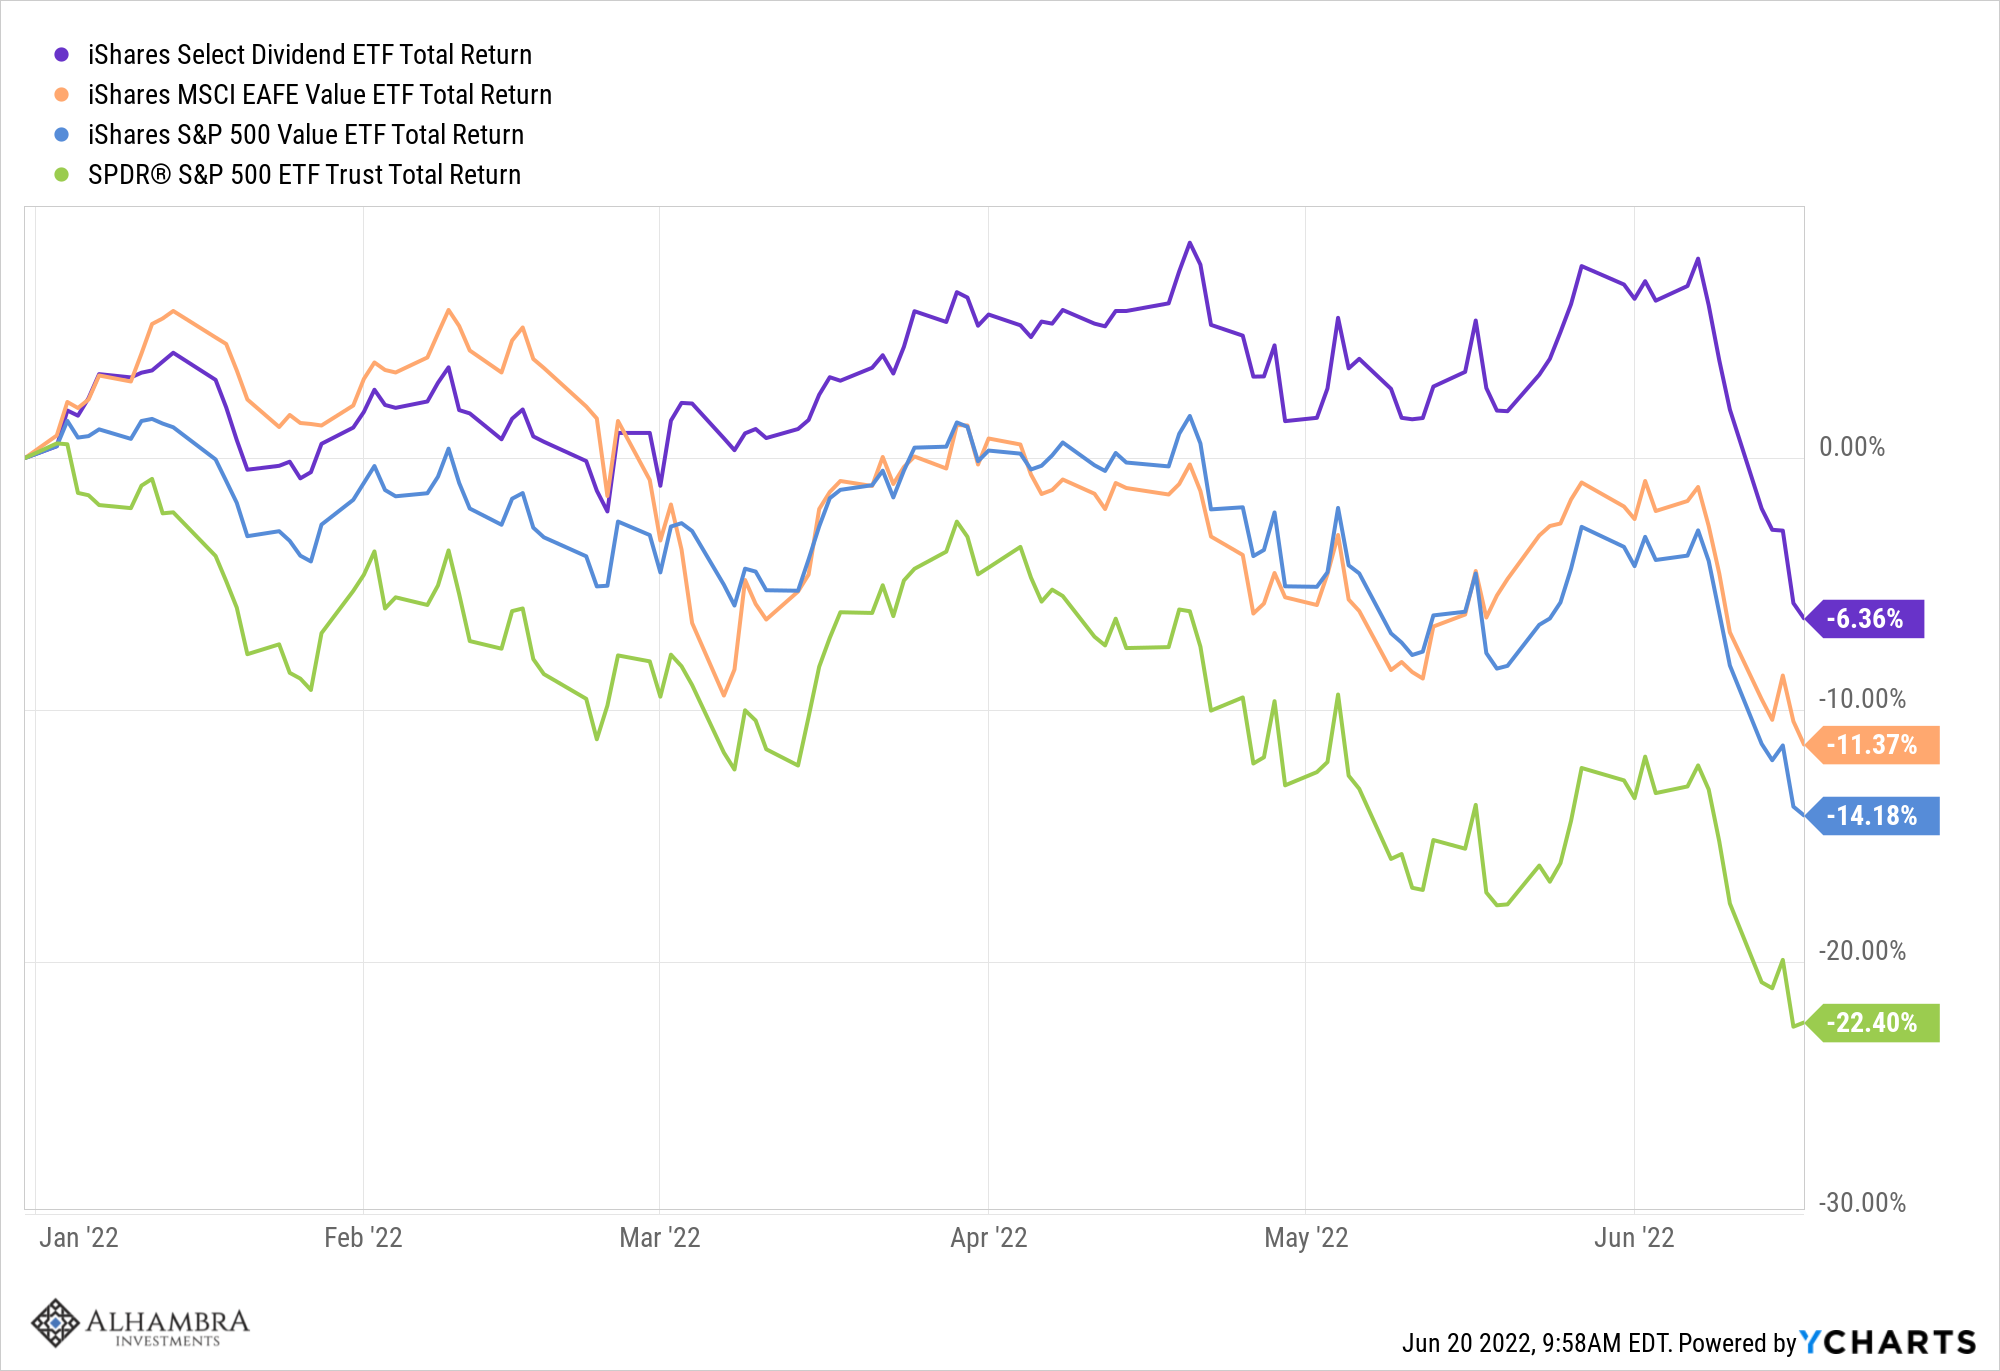
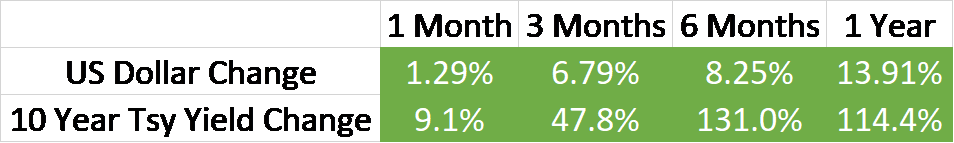
Unfortunately, the celebration of the Fed’s “courage” lasted less than a day and the declines resumed. The Fed thought they could allay investors’ fears about inflation by raising 75 basis points but instead, all they did was raise other fears, now of the Fed doing too much rather than too little. The 10-year Treasury was trading right around 3% but jumped to almost 3.5% by the time of the FOMC meeting. Rates did fall back the rest of the week and closed around 3.24% but the damage was already done. Mortgage rates jumped to nearly 6.25% at one point last week and the housing market is downshifting rapidly. As I said last week, a cooling of the housing market is necessary but slamming on the brakes of an economy is generally not a good idea, as I thought we learned during the COVID fiasco. If rates come back down – and with the economic data continuing to weaken that seems likely – we may avoid a collapse in the housing market but it will be a close call – we need to get some good news on inflation soon. We seem to have reached the indiscriminate selling part of the bear market. We have maintained a defensive equity posture and a cash cushion (10-15%) dating back to last year and that continues to be the case. But, to take one example of babies and bath water, the Select Dividend ETF (DVY, we own) fell from a nearly 8% gain YTD on June 7th to a 6% loss by last Friday. I suppose it is somewhat interest rate sensitive with 26% in utilities but the fundamentals didn’t really change much, if any, over that two-week period. The index now trades for 12.5 times earnings but it wasn’t expensive before the selloff. The S&P 500 value index (IVE, we own) had similar performance, falling from a 3% loss to a 14% loss over the same time frame. The largest holding in the index is Berkshire Hathaway which went from +5% to -10%. I suppose if you’re going to bail on Berkshire Hathaway, you can justify selling just about anything. Our portfolios are still outperforming on the year but losses have now reached double-digits (depending on timing, risk tolerance, etc.; the 60/40 stock/bond portfolio is down 19%) and I am reviewing all of our indicators to see if there is more we should do. It has been a challenging year, to say the least, but we have continued to follow our process. But losing less than everyone else, while admirable, is not our goal. We aim to make money every year – even knowing that is likely an unattainable ideal in the long run – and we still have half a year to go. I think it would be helpful to review where we are and how we got here. |
 . |
Interest Rates/Fixed IncomeWe came into this year expecting the economy to slow. That wasn’t exactly a courageous bet since the growth rate last year was goosed by Biden’s American Recovery Act and an accommodative Fed; neither of those items seemed likely to repeat. Biden’s legislative agenda died in West Virginia. The Fed should have started its tightening last year and everyone knew that except perhaps the folks who run the Fed. Of course, we don’t give the Fed so much credit around here but everybody else does and that is what matters to markets, at least in the short term. So, a slowing economy and a tightening Fed was the outlook at the beginning of the year. But we faced a bit of a dilemma because it was also obvious (at least to me) that interest rates were going to rise. Our normal response to slowing growth would be to extend the duration of our bond portfolio and if it reached recession proportions, actually reduce risk assets and add more bonds. But if rates are rising that plan is off the table. |
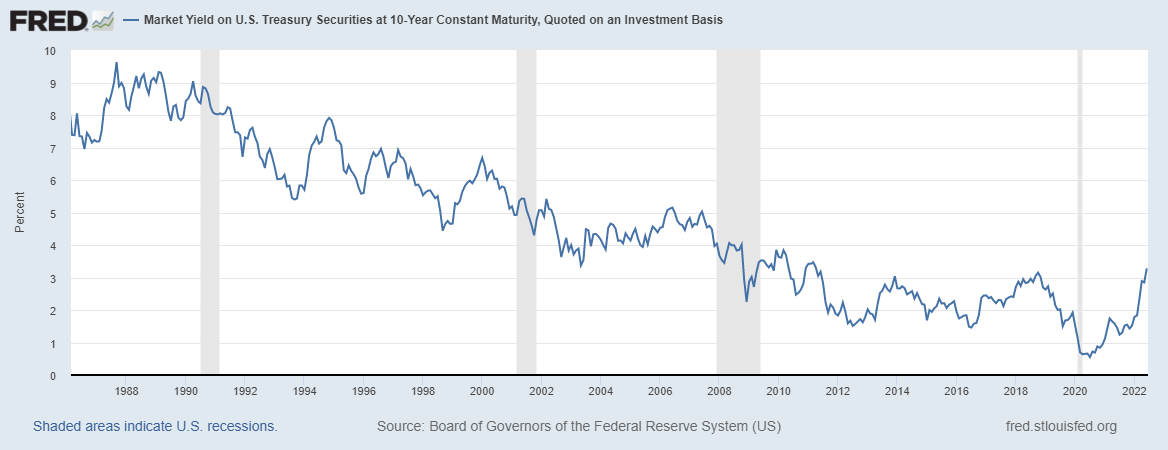 . |
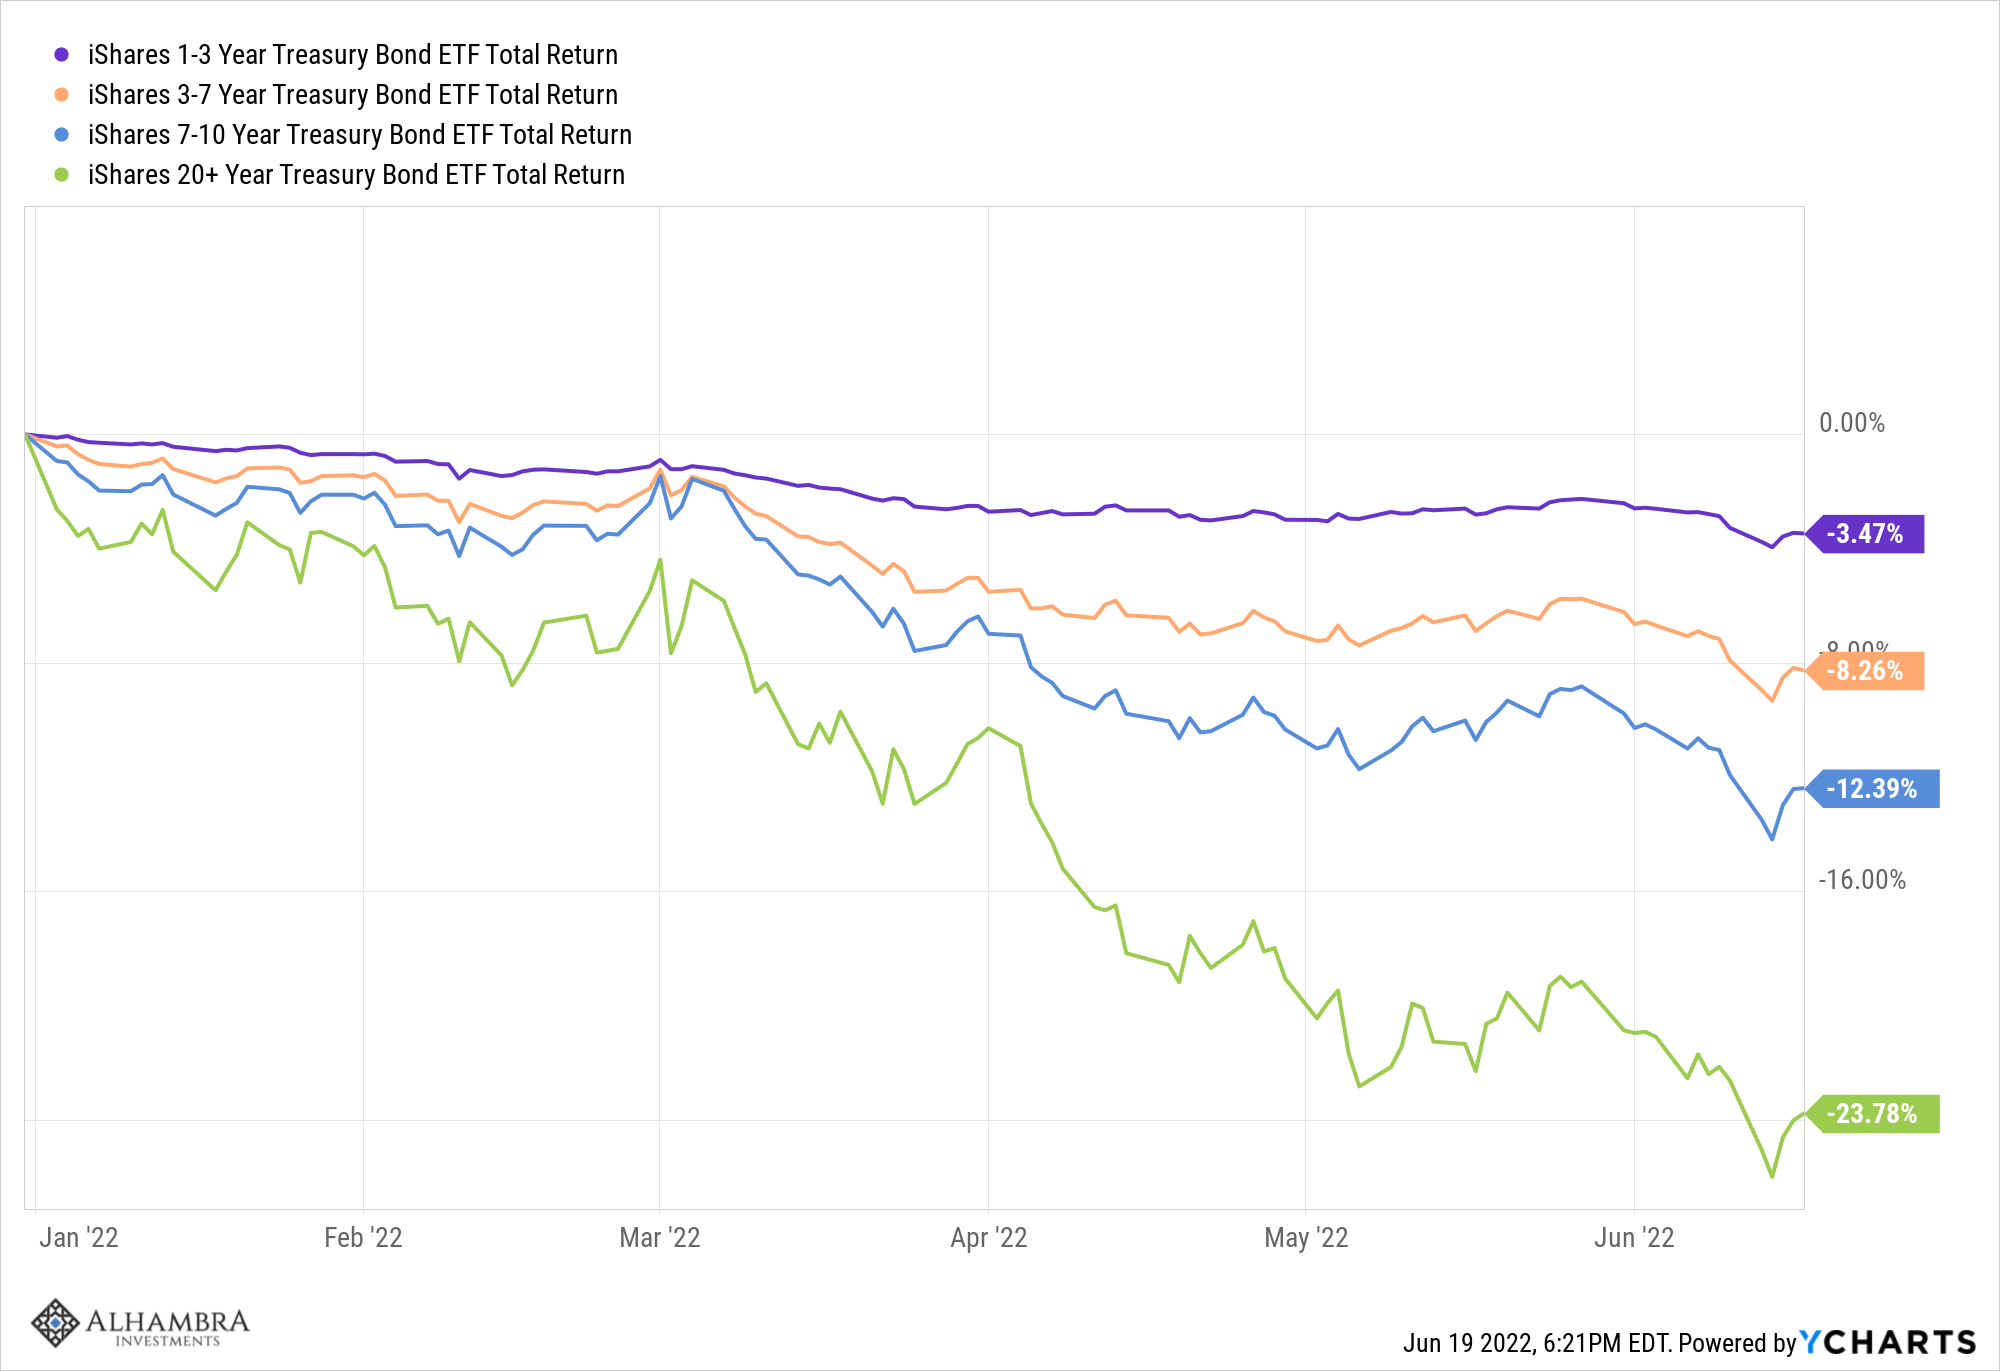
| We entered the year anticipating higher rates with about 50% of our bond portfolio in short-duration bonds (1-3 years) and 50% in intermediate (3-7 years). We shifted our portfolio to a longer duration profile when the 10-year Treasury hit 3%. I believe that was the right choice even though rates have moved modestly higher since but all bond durations are down on the year. We now have 75% intermediate, 12.5% short term, and 12.5% long term (7-10 years). Have rates peaked? The fact that bond yields fell after the Fed hike gets me closer to a yes but I’m not there yet. I continue to think there will be a major opportunity to buy long-duration bonds sometime this year. Note: We don’t own TLT but included it for reference in the below chart.
Being wrong on duration this year has been painful and the wronger you were, the more it felt just like owning stocks. This is why it takes extraordinary conditions for us to buy the very long end. |
 . |
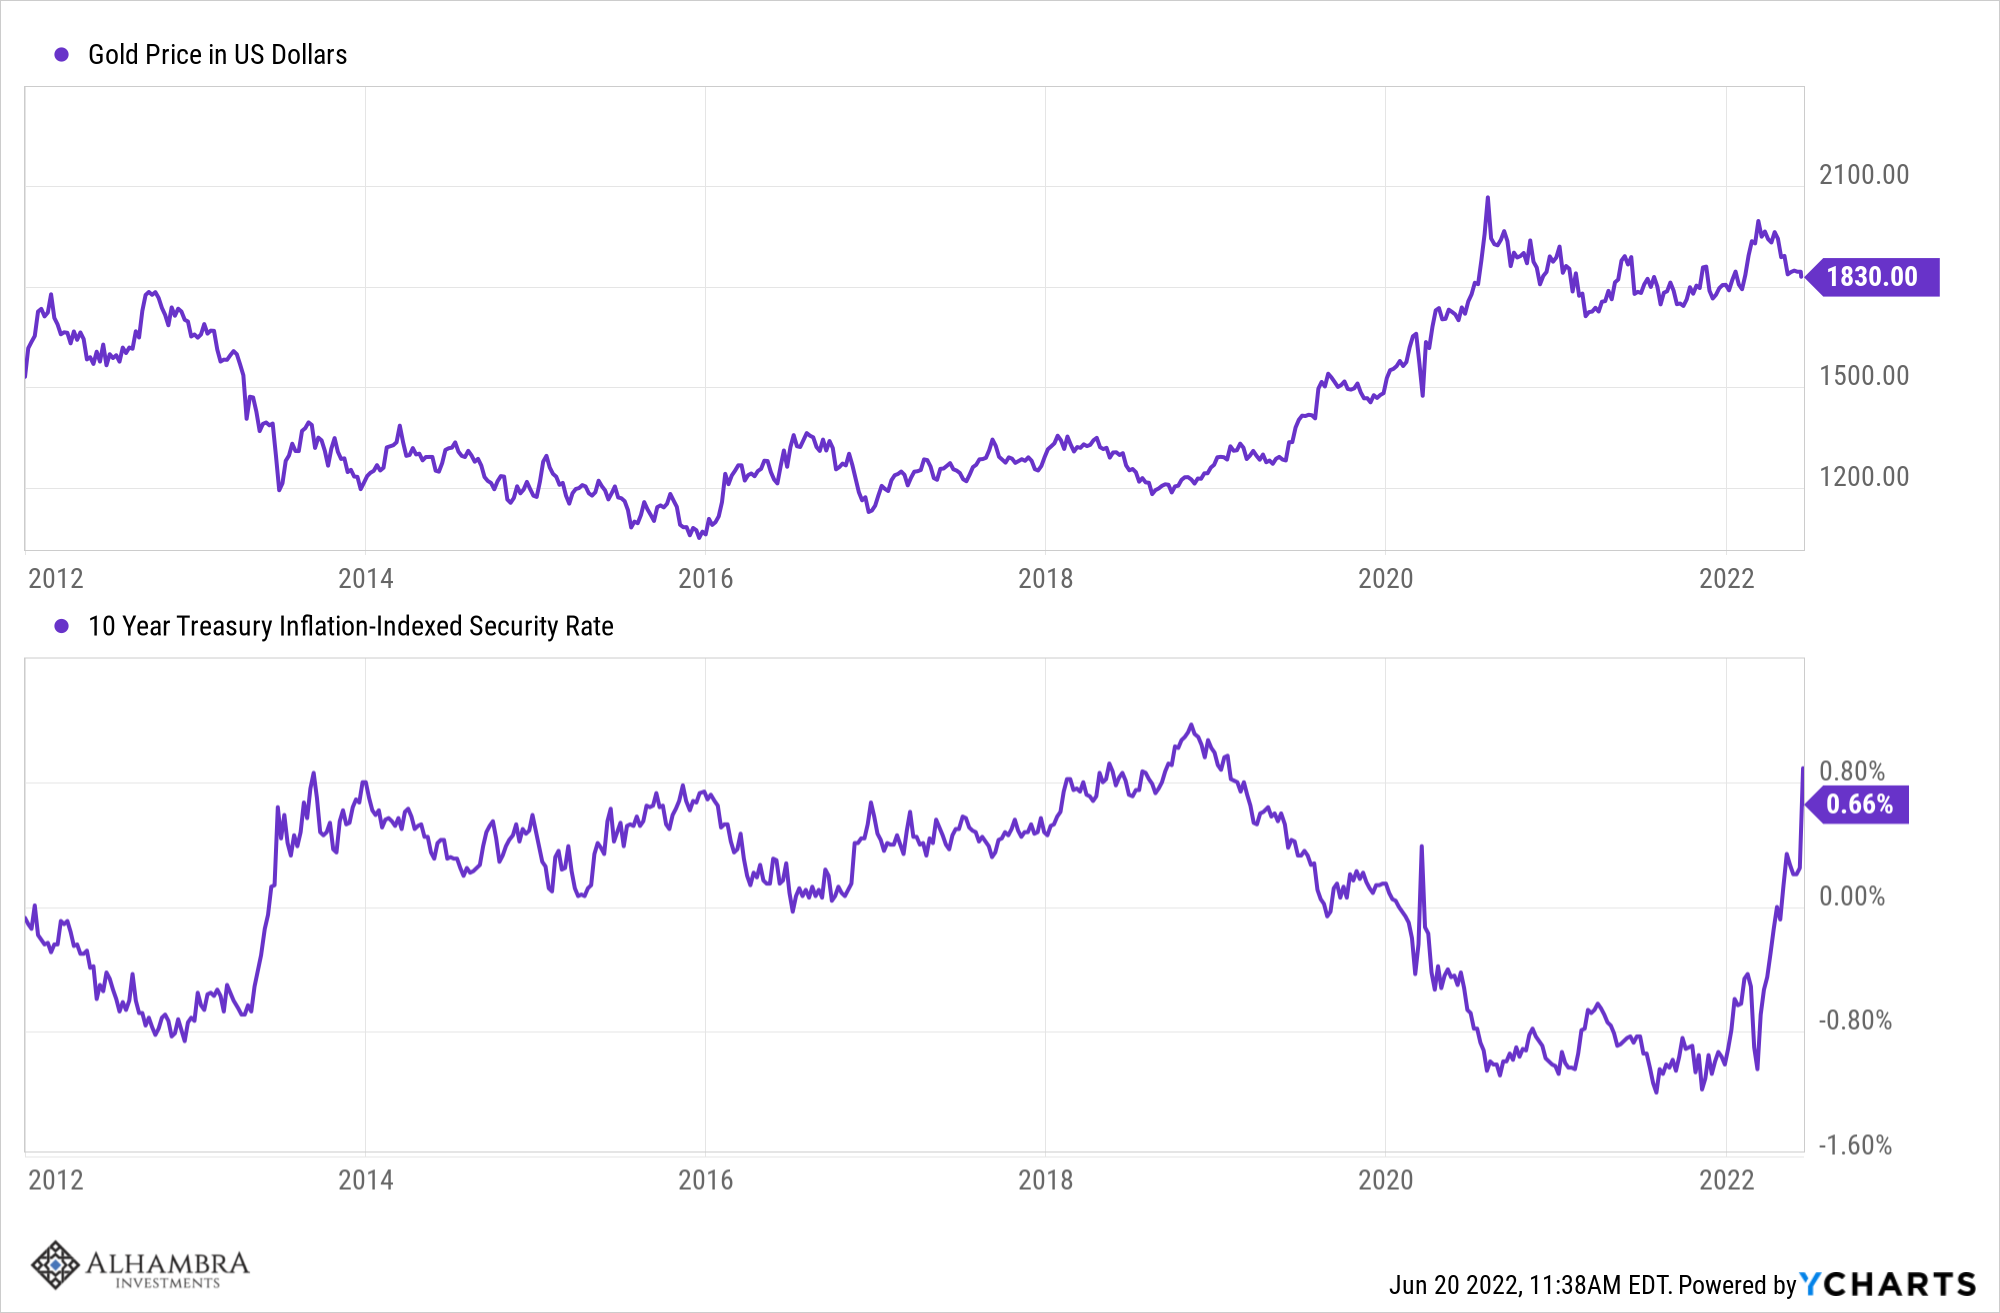
Commodities and GoldRising rates also affected our commodity and gold exposure. We expected real rates to rise and in the past, that has not been a positive environment for commodities. 10-year TIPS rates are up from -1.04% at the beginning of the year to 0.67% Friday. That 171 basis point rise is about the same as the nominal 10-year (176 basis points) but is arguably much more important. Positive real rates are actually a positive sign for quality long-term growth but it will have to rise more and stay that way for it to really impact the economy. And, in general, what is good for growth is bad for gold. |
 . |
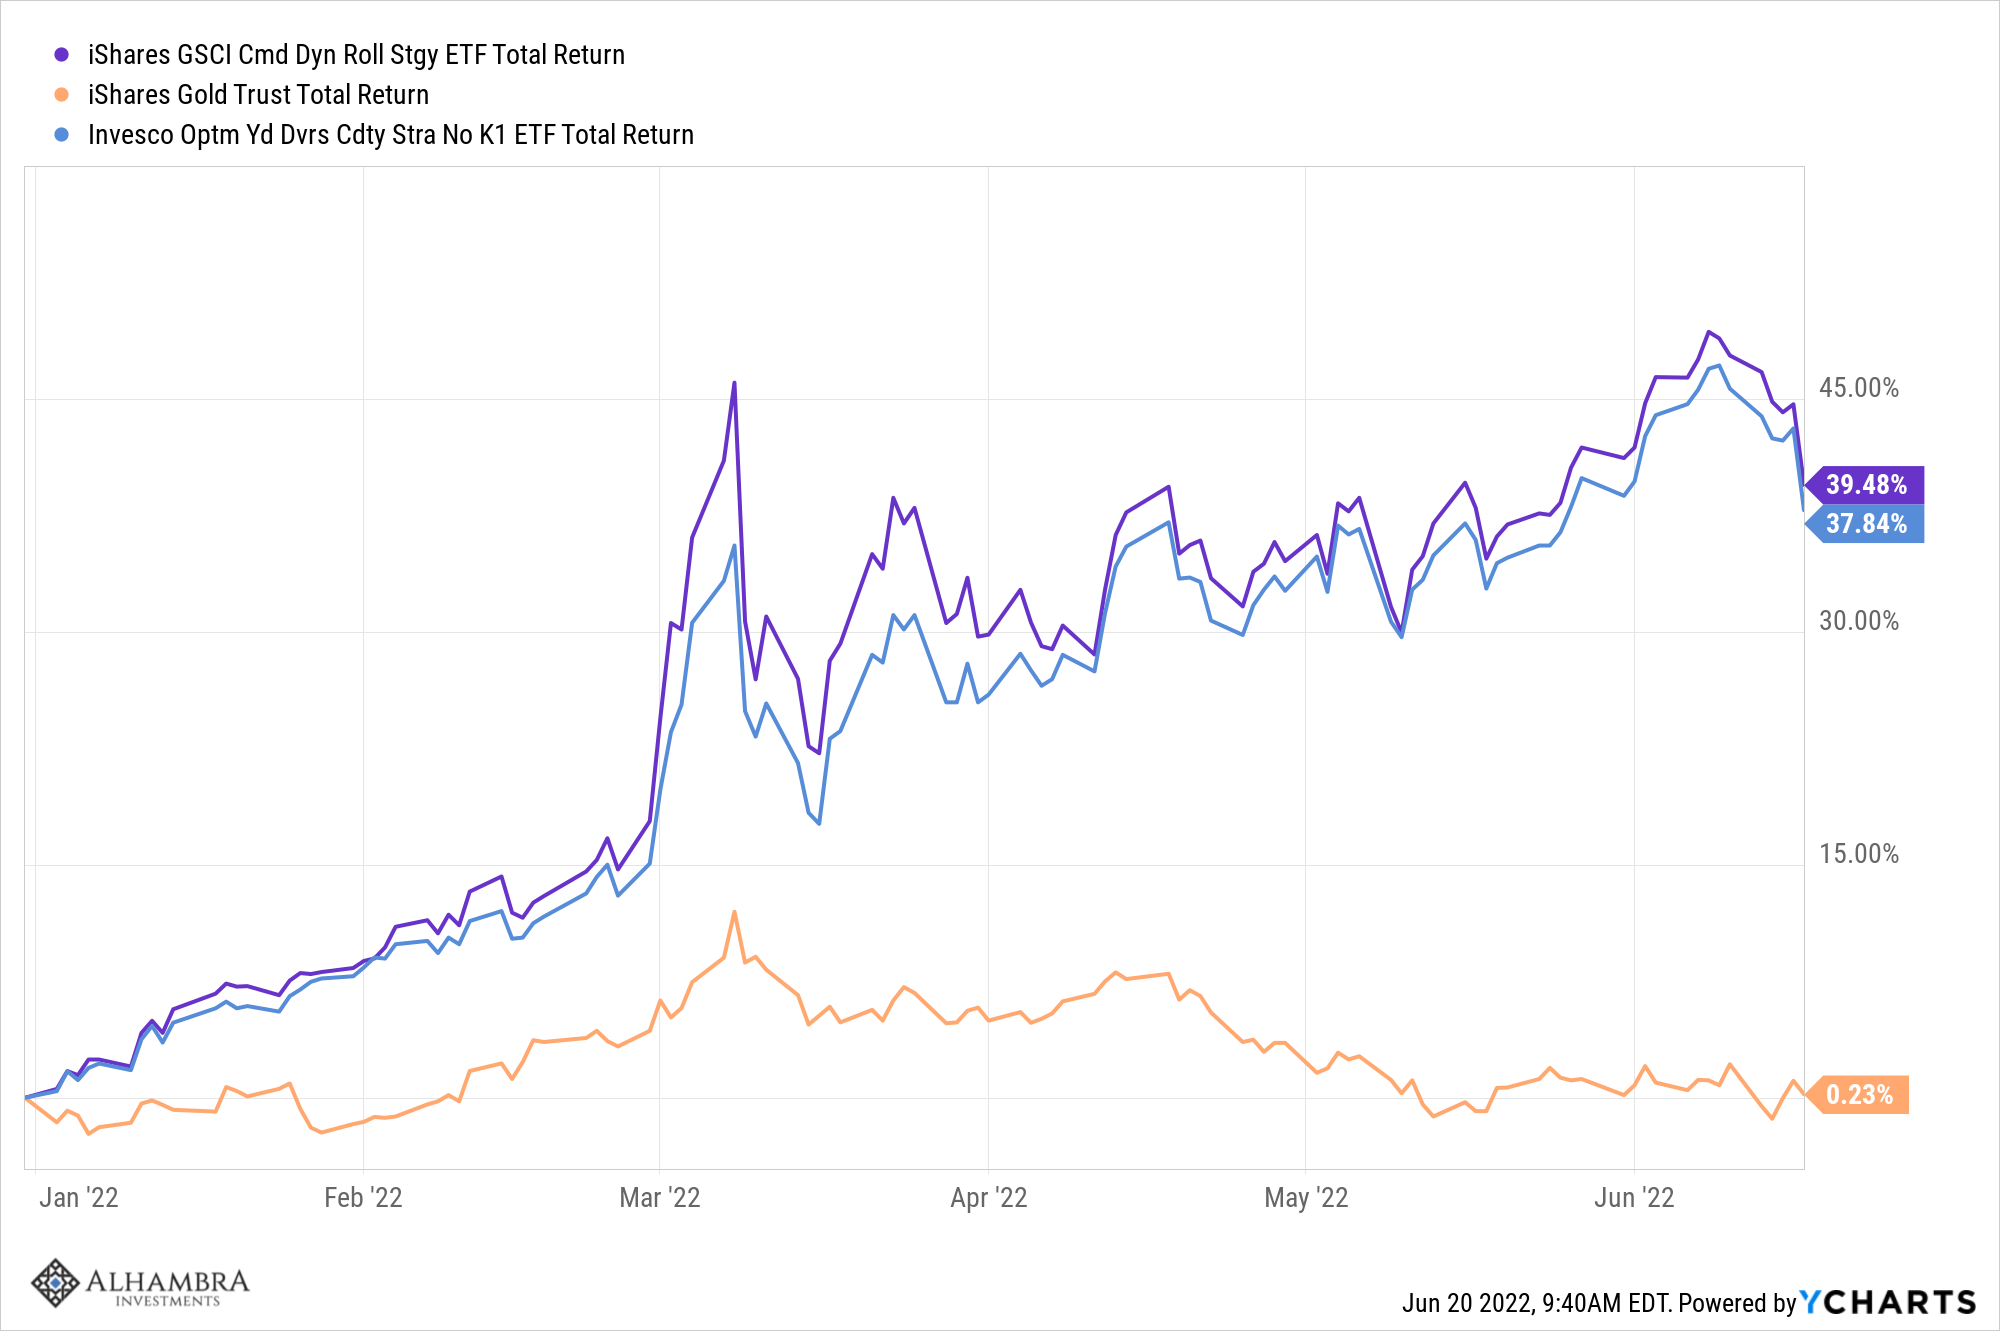
| Our response to rising real rates was to keep our commodity and gold exposure at half our strategic weight. In 2013, the last time real rates rose from negative to positive, gold fell 25% and the GSCI index of general commodities fell 6%. We have positive returns from both this year and a full position would have been more beneficial but we couldn’t justify it based on past experience. We did allow the positions to gain within the context of the portfolio but have more recently been trimming them back to the target (half strategic weight). If real rates start to fall again we will revisit our allocation. |
 . |
EquitiesWe also came to the conclusion last year that the S&P 500, and especially the growth part of that index, was essentially uninvestable. From meme stocks to SPACs to technology stocks to crypto, speculative fever gripped investors last year to a degree I hadn’t seen since the turn of the century dot com boom and bust. I knew there would be a comeuppance but when was a question I couldn’t answer. By the fourth quarter though, we had eliminated our S&P 500 exposure in favor of more defensive positions in Dividend stocks and US and International value stocks. We had and have no exposure to the S&P 500 growth index or NASDAQ index. By the way, we have never recommended any crypto investments and despite the ongoing crash, are not likely to soon. |
 . |
| I am treating this like every other speculative boom I’ve seen in my career which is to wait for the bust and sift through the survivors to see if I can find a pony (if you don’t know that joke send me an email). But I don’t think the crypto comeuppance is done yet.
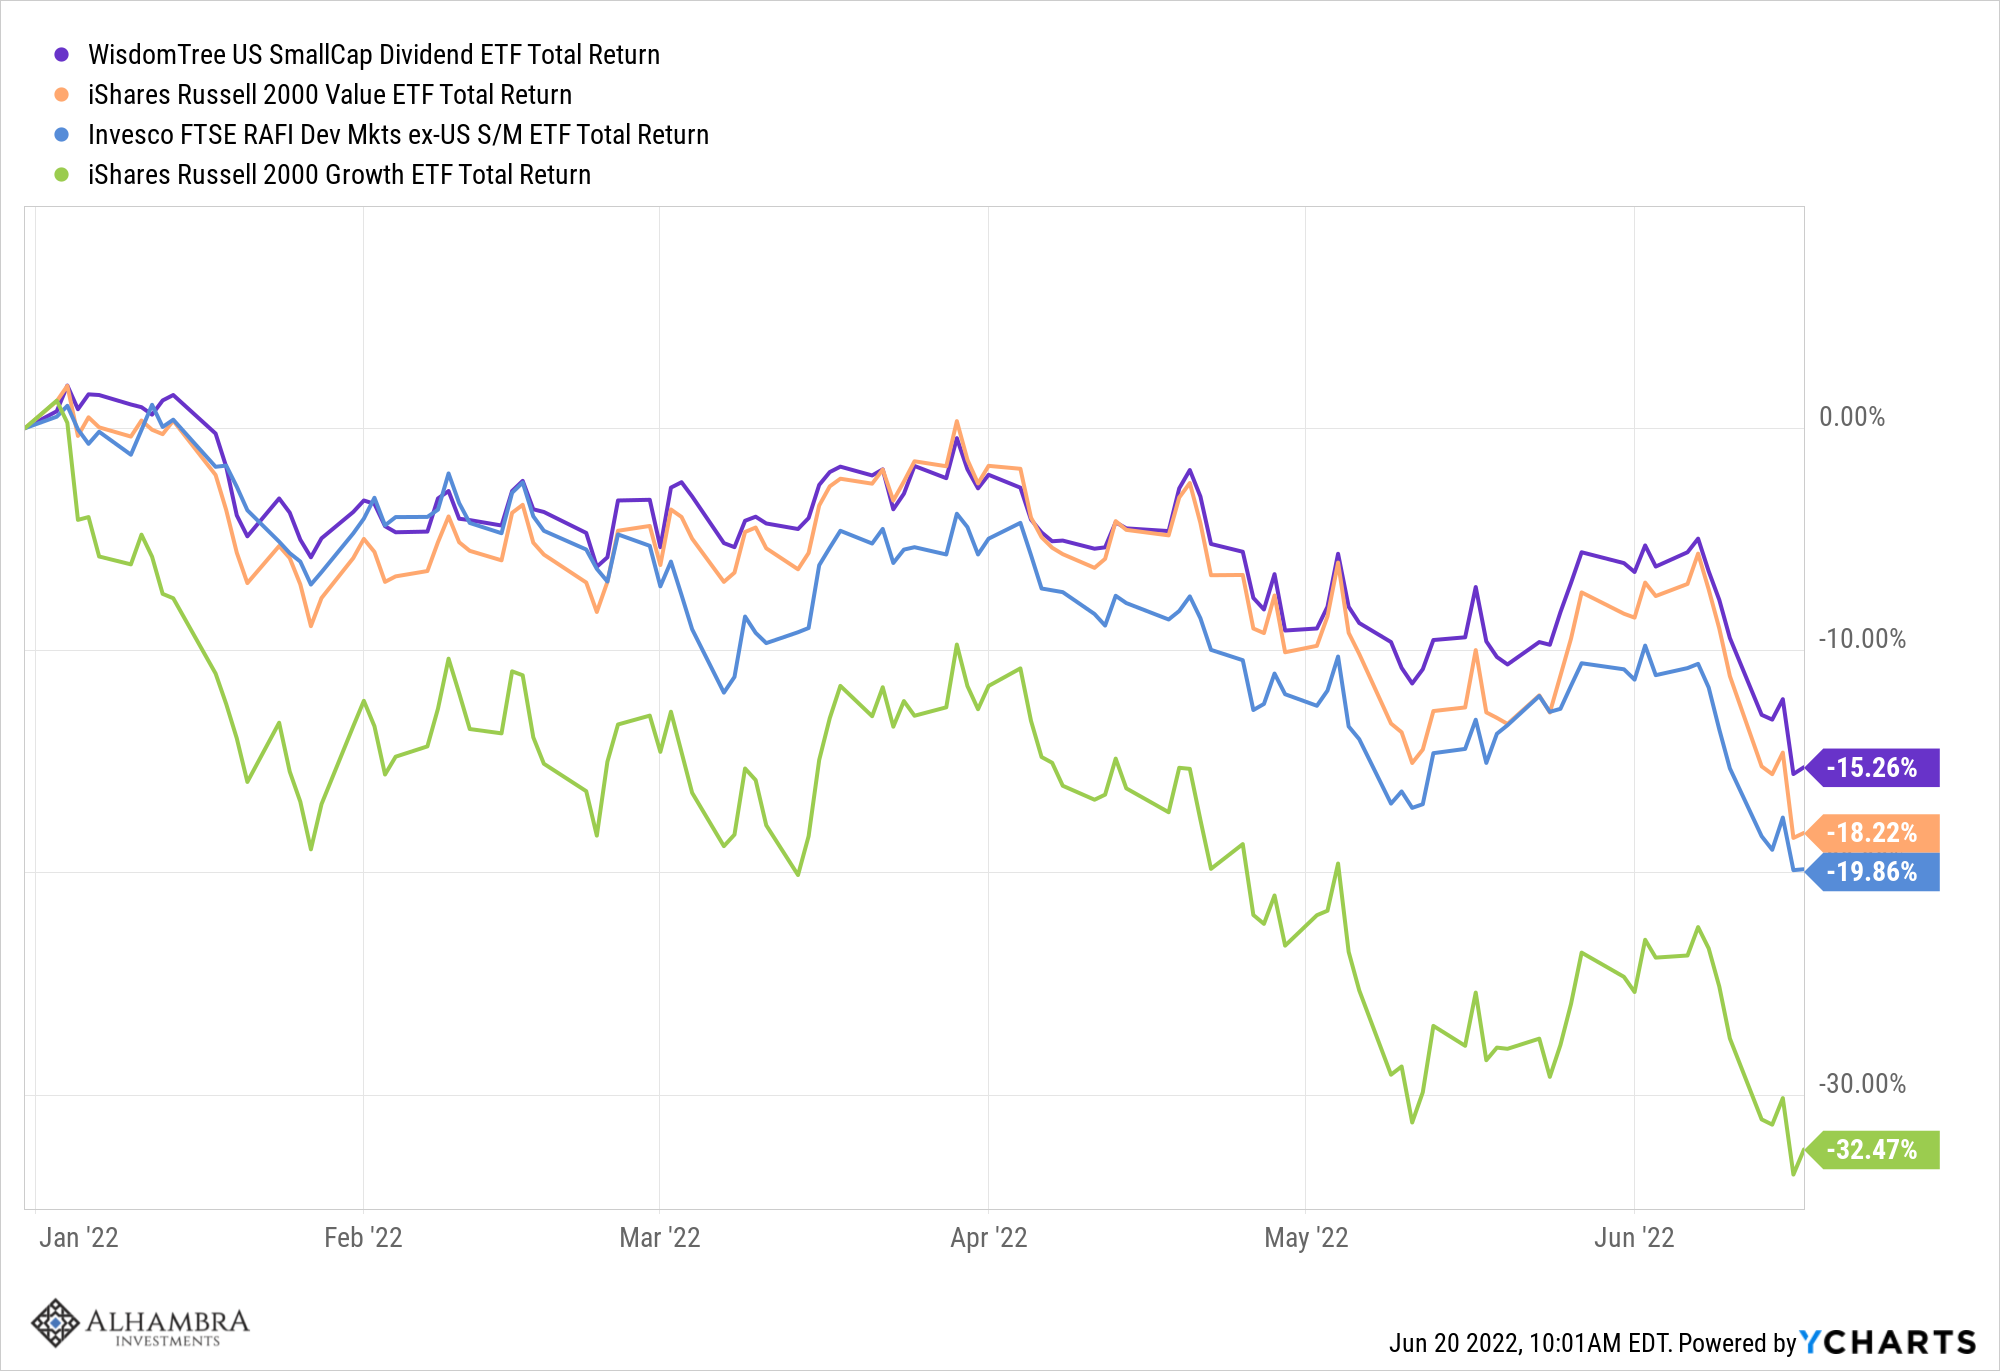
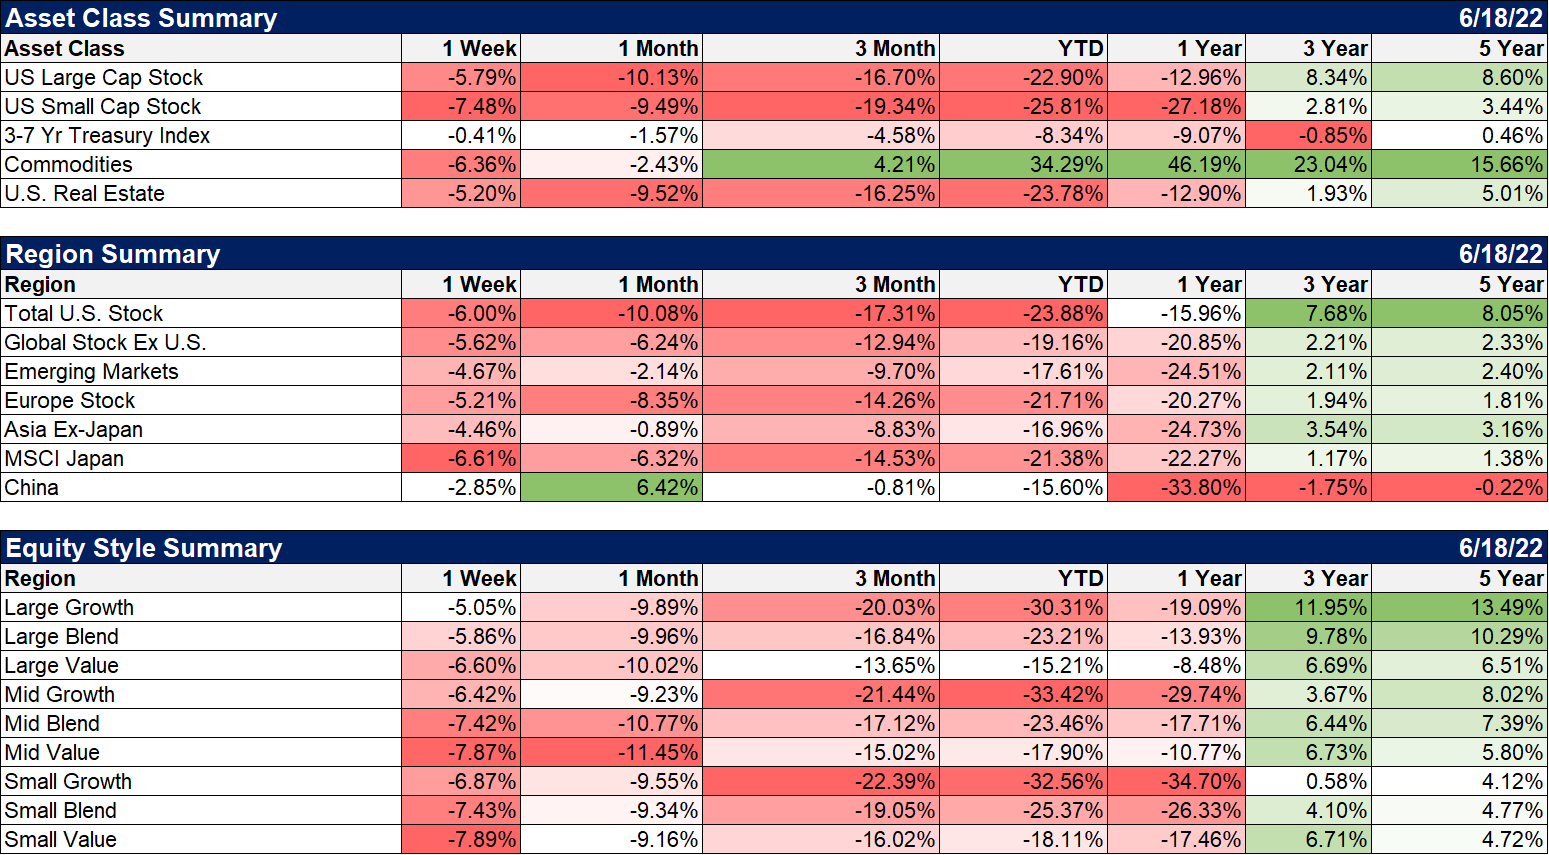
Similar results were seen in small-cap stocks where dividend and value indexes outperformed the growth index: Our allocations to small cap are generally pretty small but we are currently smaller at 75% of our strategic allocation. Strong dollar environments tend to favor small caps over large but with a slowing domestic economy, I didn’t want to make an oversized bet on that. In this case, small-cap and large-cap returns have been quite similar (-25.4% and -22.4% respectively). |
 . |
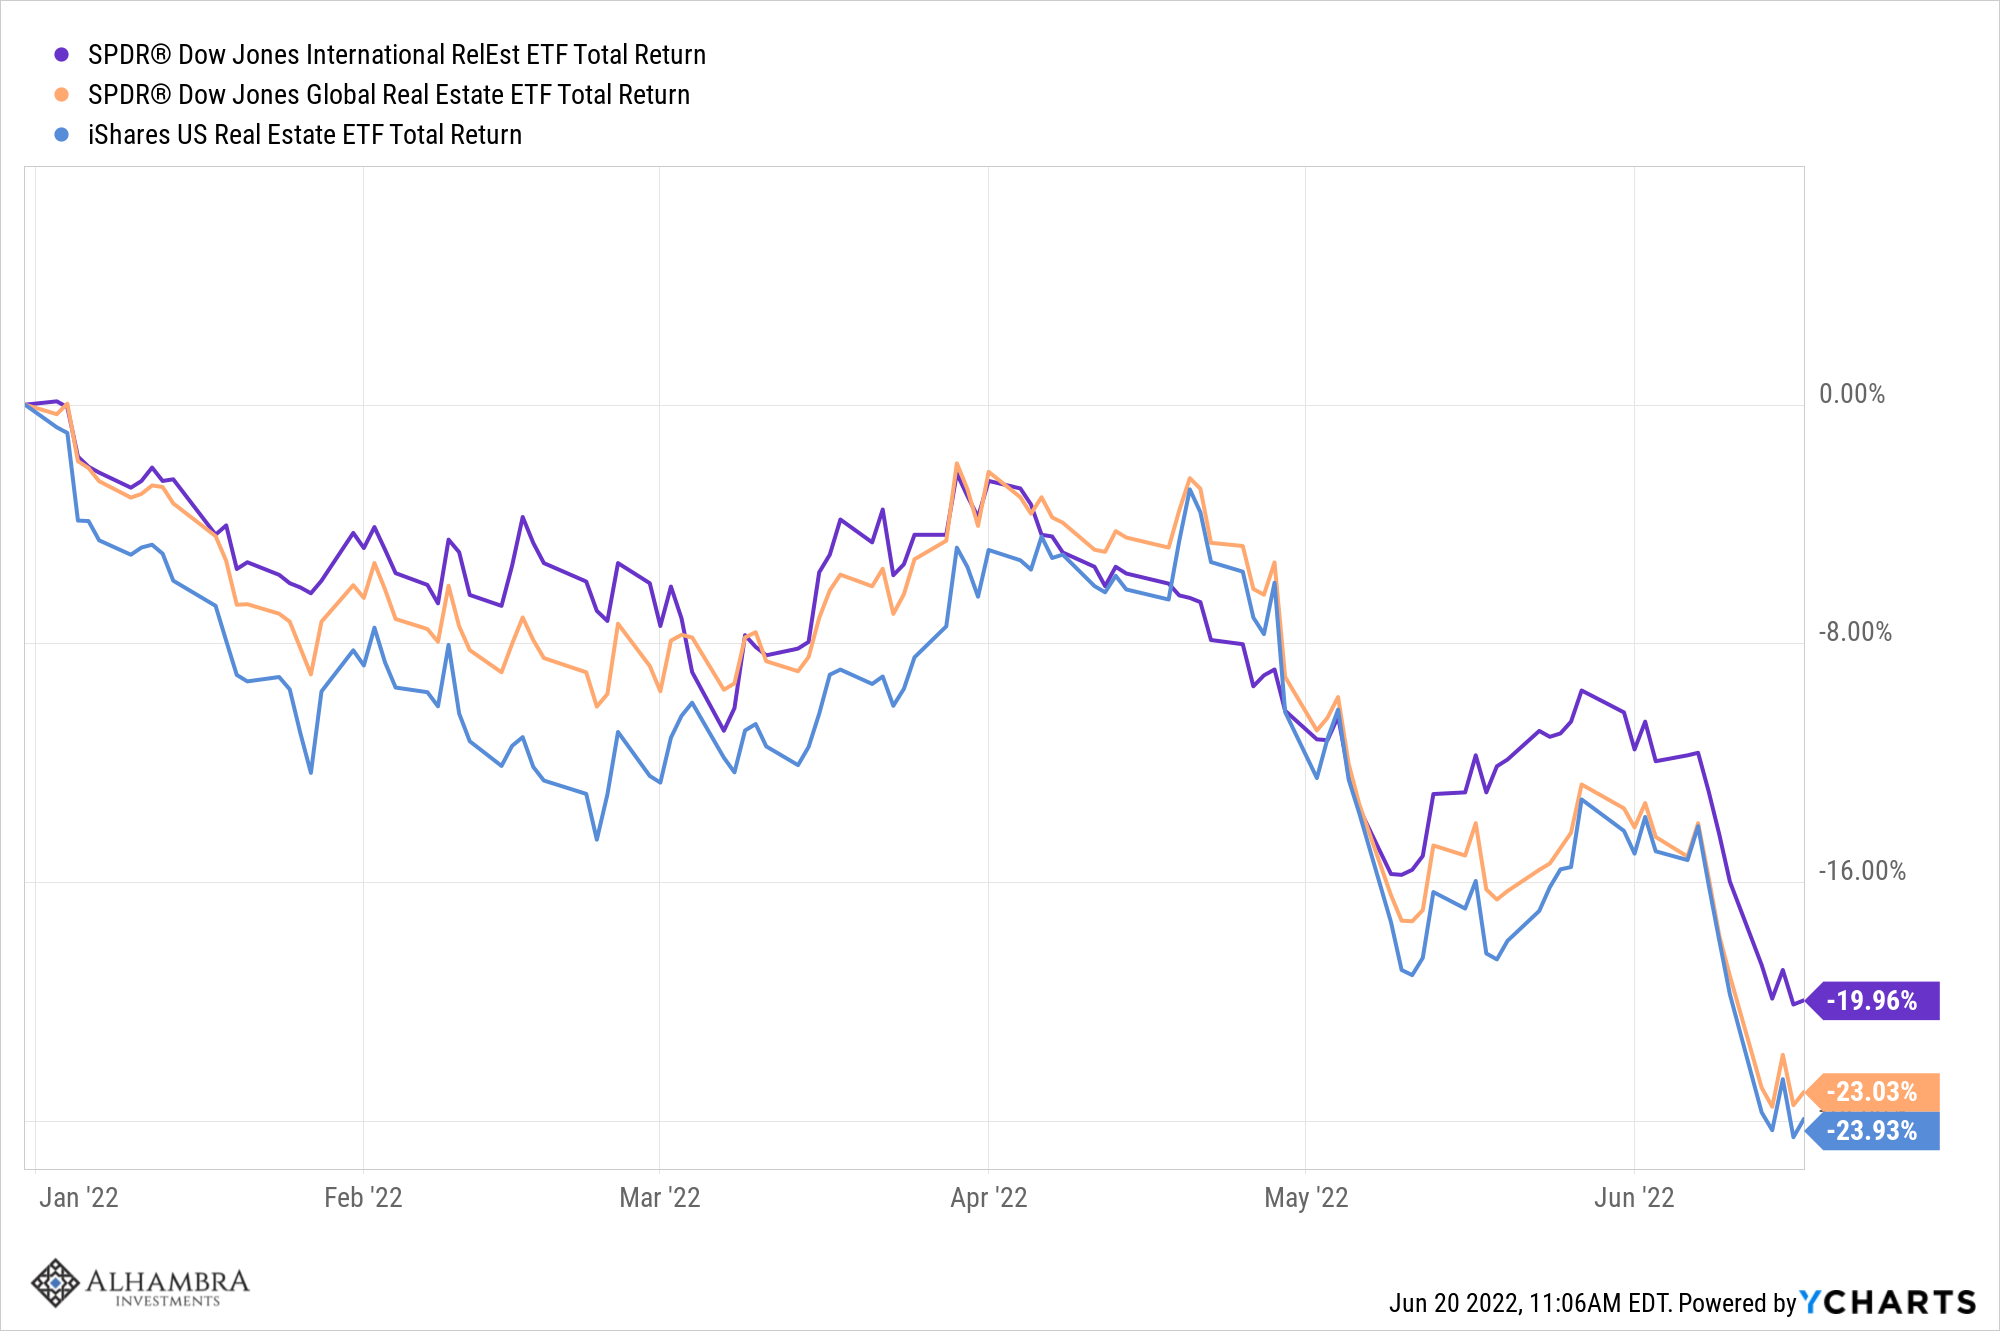
Real EstateReal estate (REITs) has performed in line with large-cap stocks this year. For most of the year, we have maintained an allocation that is 50% of our strategic allocation. We raised that to 75% when we extended the duration of our bond portfolio. REITs are rate sensitive and performance should improve if rates come back down. REITs also perform well in inflationary environments and that might argue for a full allocation. However, truly inflationary environments are marked by a weak dollar which isn’t true today. Interest rates are probably the more important driver of REIT returns going forward. |
 . |
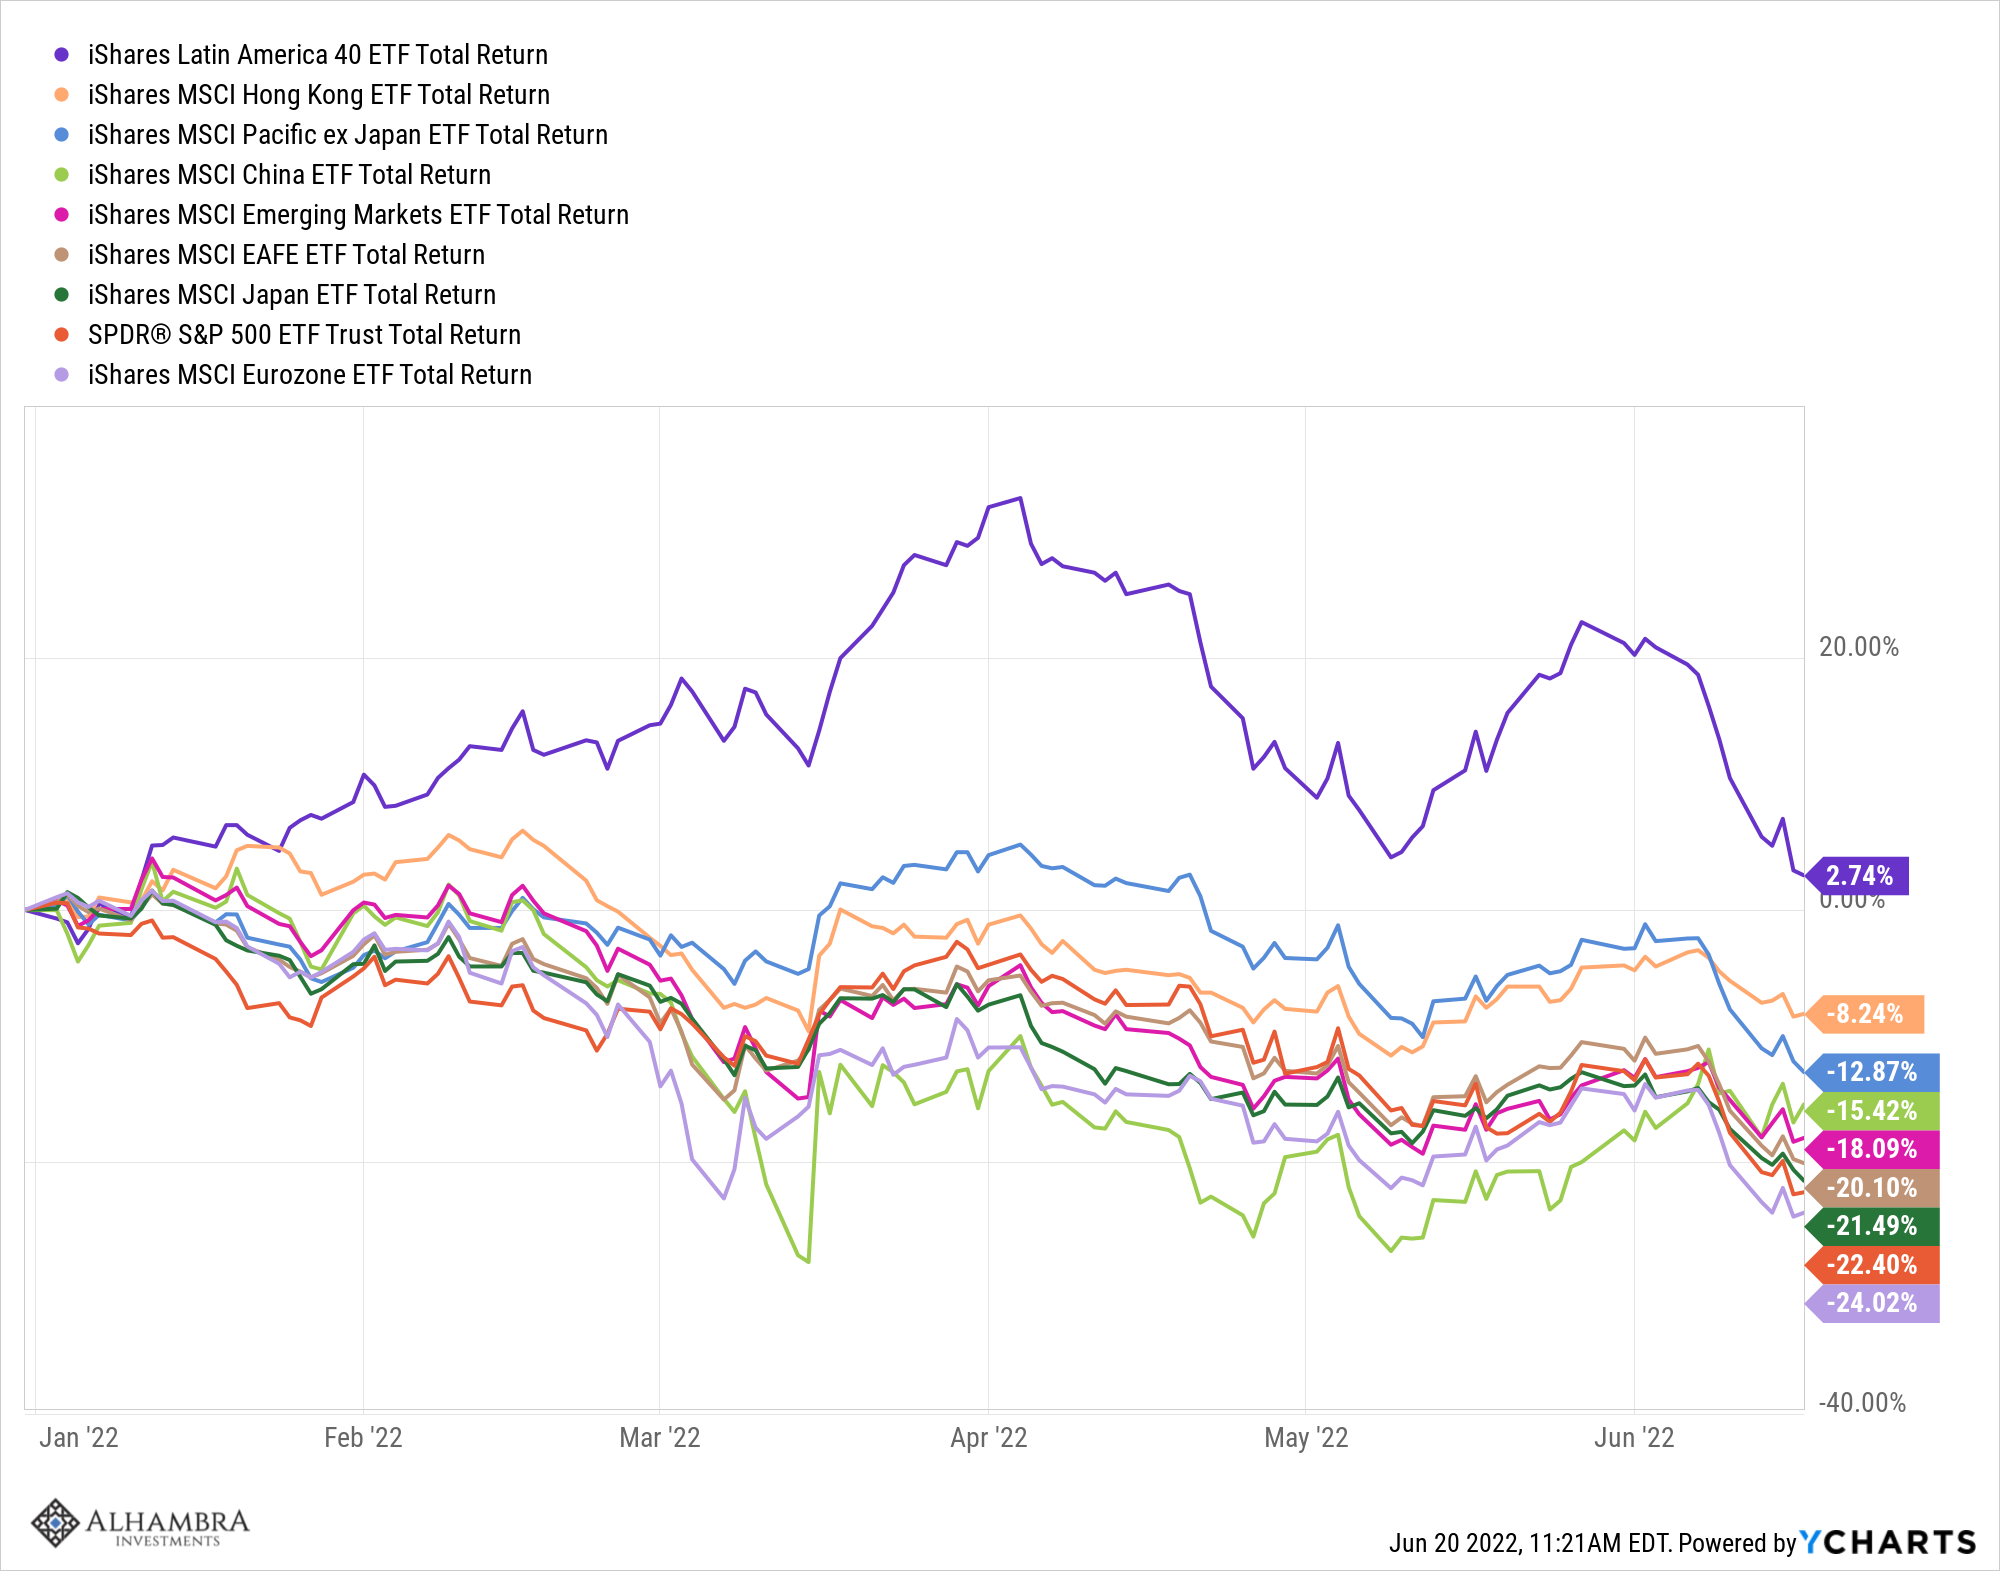
International EquitiesOne of the strangest outcomes in this year of strange outcomes is the outperformance of international equities over US. This is wholly unexpected in a strong dollar environment but even EM equities are outperforming the US this year. We own a small position in Japan and despite the plunge in the Yen (-14.7% YTD), the Japan ETF has managed to slightly outperform the S&P 500. With commodity prices on the upswing, Latin American stocks have led, still positive on the year. That, despite the continuing political swing to the left (Colombia joined the trend yesterday) that may continue in Brazil later this year. Two things come to mind here that investors should take to heart. First of all, the economy is not the market and the market is not the economy. Everyone knows about China’s ongoing economic difficulties and yet its stocks have done better than the US this year. Second, don’t let your politics dictate your investment choices. The leftward swing in LA politics is probably not a long-term positive but it hasn’t stopped those markets from outperforming. |
 . |
Outlook |
 . |
EconomyI have maintained for some time now that once the COVID distortions in the economy are gone, the US economy would settle back to its previous growth trend of around 2%/year. That is based merely on the observation that GDP grew 2.1%/year for the decade prior to COVID and we did nothing during COVID to change that trajectory. Economic growth can be boiled down to just two things: productivity growth and workforce growth. Either workers become more productive and output grows or you add more labor and output grows. Did we do anything to enhance productivity during COVID? Well, there were changes due to COVID – work from home, etc. – but whether those things turn out to be positive for productivity is still an open question. |
. |
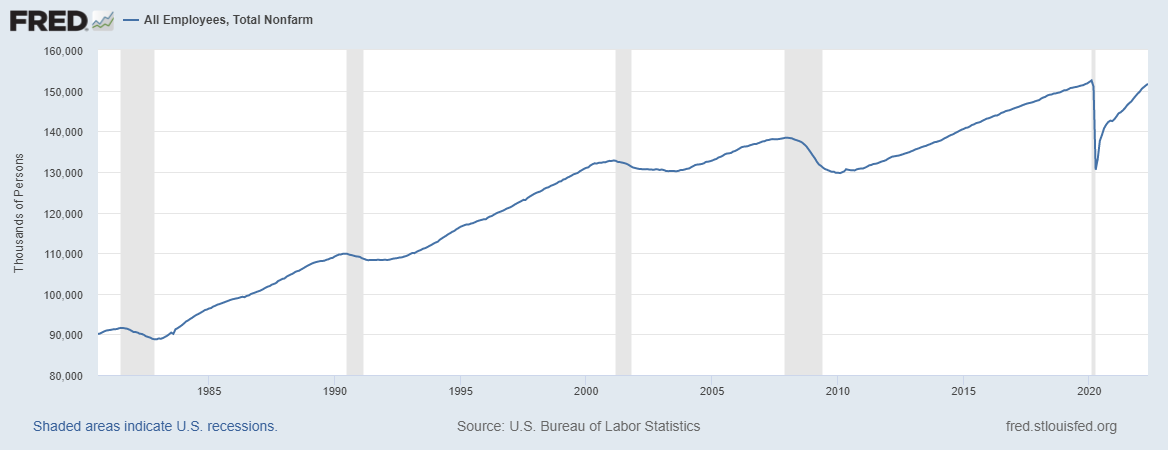
| As for workforce growth, the number of total employees has risen but is still below the pre-COVID high:
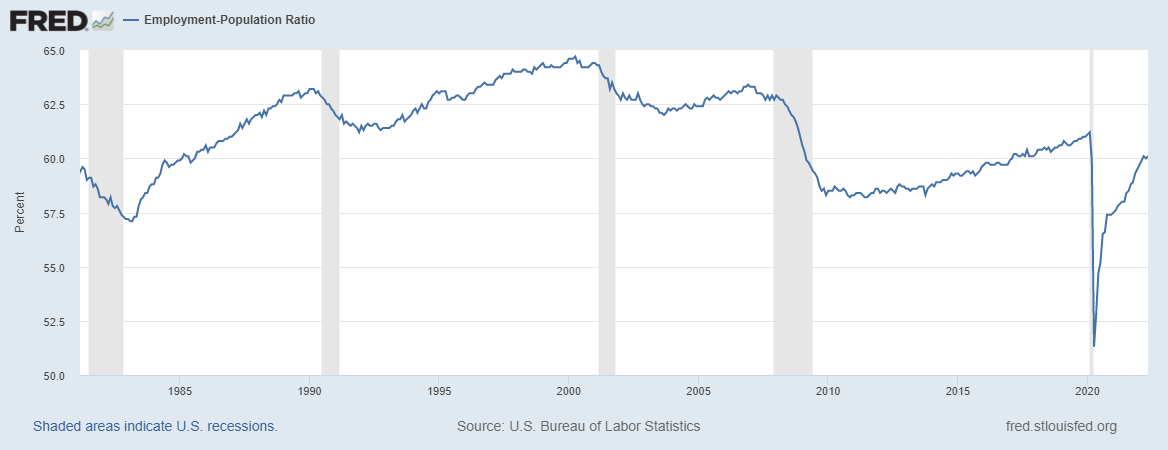
As a percentage of the population we are still a full 1% below the pre-COVID level: |
 . |
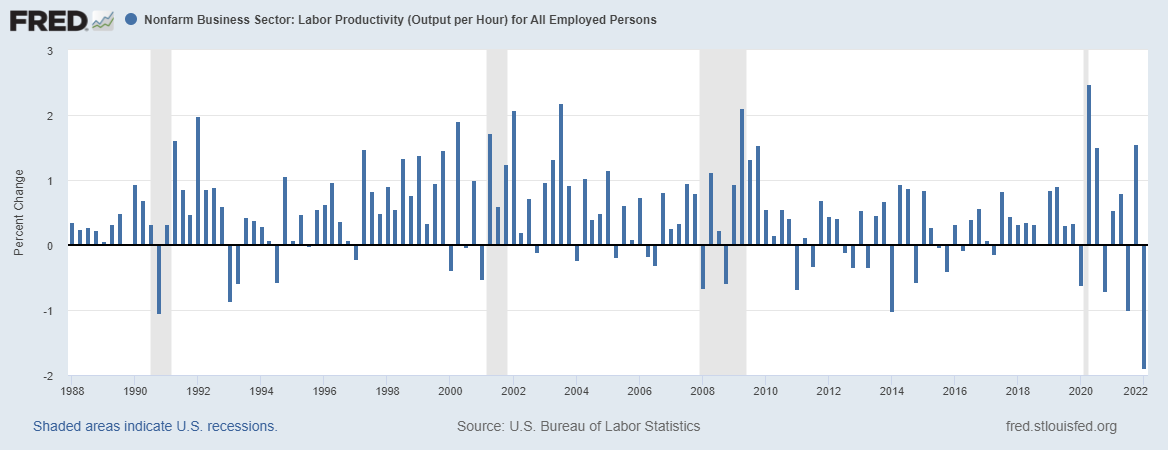
| Productivity rebounded out of the COVID economic low but fell sharply in Q1 ’22 as we added workers and GDP contracted. |
 . |
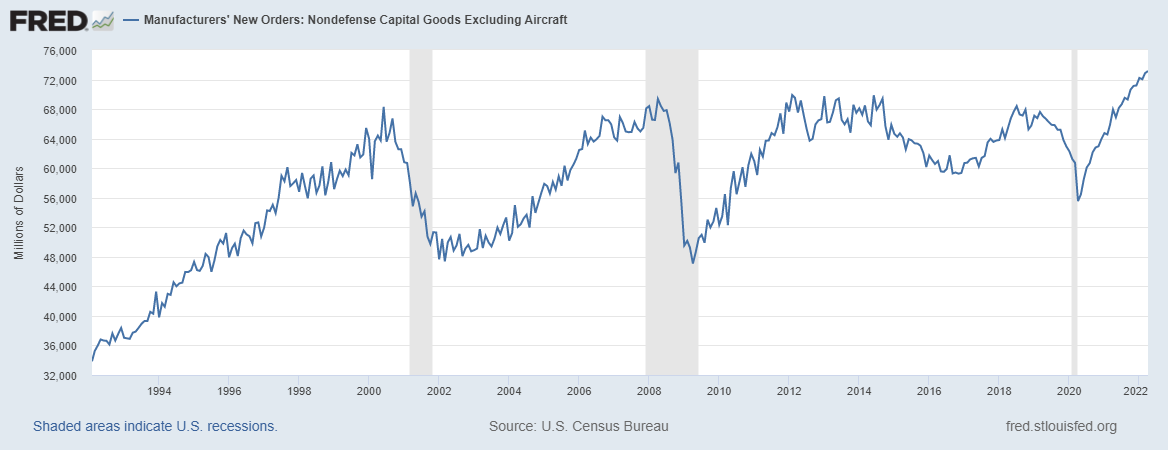
| With Q2 GDP also looking weak, those numbers probably won’t improve soon. If we are headed for a deep recession, you can count on companies to cut workers but that is hardly the best way to improve productivity. Productivity growth is really about investment in the real economy though and there we do have some potential positives. First is that real rates have turned positive and that is generally associated with higher investment and productivity growth. Second is that core capital goods orders have finally broken out of a 20-year stagnation and are still climbing: |
 . |
| But investments take time to pay off so any productivity gains from this investment will take some time to show up in the real economy. And that assumes it isn’t peaking now.
So, with low productivity growth and weak workforce growth, I just don’t think it is realistic to expect something other than what prevailed prior to COVID. If anything, since we added a lot of government debt during the pandemic, we might even assume growth will be somewhat less than the pre-COVID trend. On the other hand, I think that is mitigated by the fact that a lot of the government debt added was merely a shift from household balance sheets to the government’s balance sheet. The savings rate has fallen this year but that doesn’t mean, contrary to a lot of commentary out there, that people are spending the huge pile of savings they accumulated during COVID (flow vs stock). |
 . |
| I’m sure that is true for lower-income Americans and, with prices rising, probably for some middle class as well. But in aggregate, the accumulated savings hasn’t been depleted and that may act as a cushion for any economic slowdown.
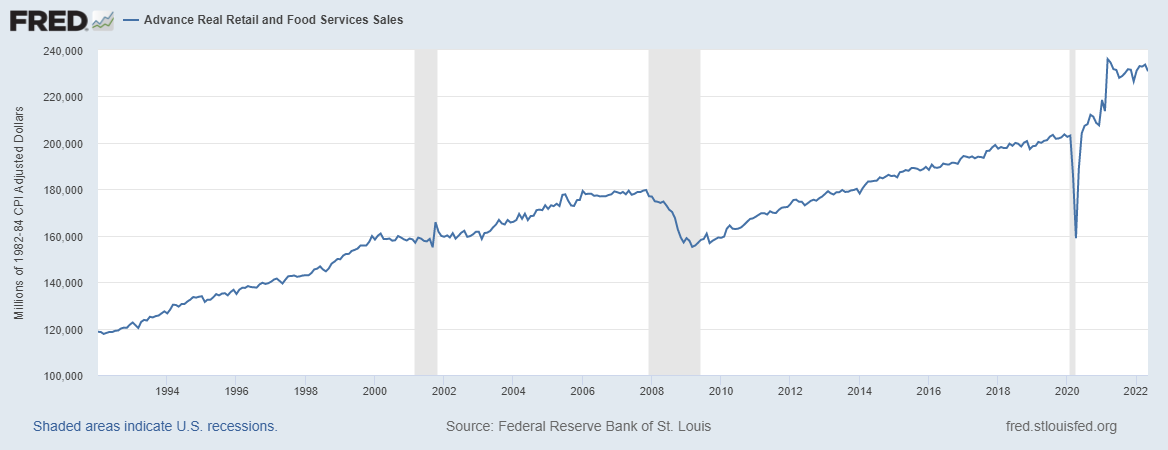
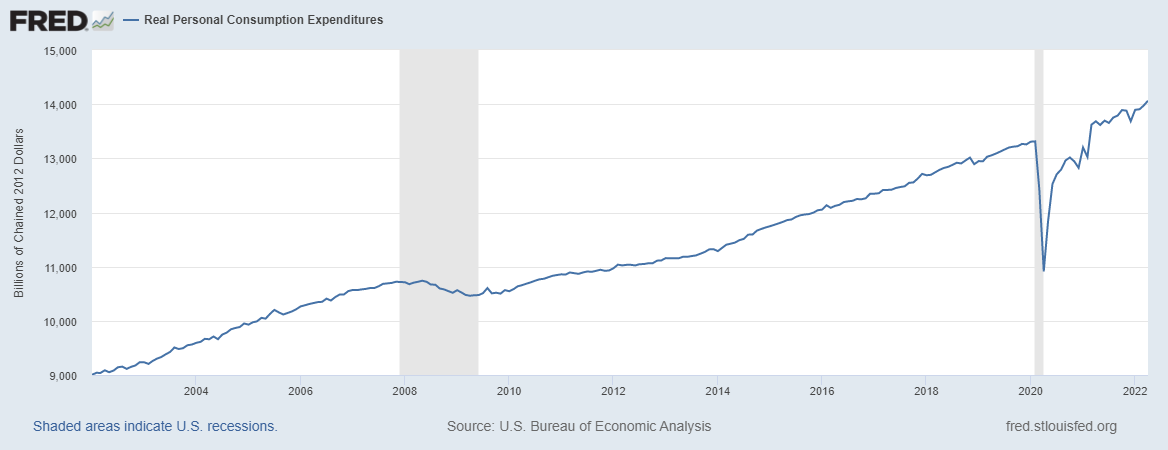
Last year’s 5.7% GDP growth rate was not sustainable, fed as it was from Biden’s spending plan and an accommodative Fed. Growth had to slow this year and it is. What is remarkable so far though is how little evidence we have of that. Real retail sales have been running well above trend and should come down but they remain elevated: If retail sales are going to fall back to trend – and I think that makes sense – the question is how. Will it be a rapid drop or gradual? More importantly, how will this affect overall consumption? Will a rise in services spending offset some of the – potential – drop in goods spending? Will it be sufficient to keep overall real consumption growing on trend? |
 . |
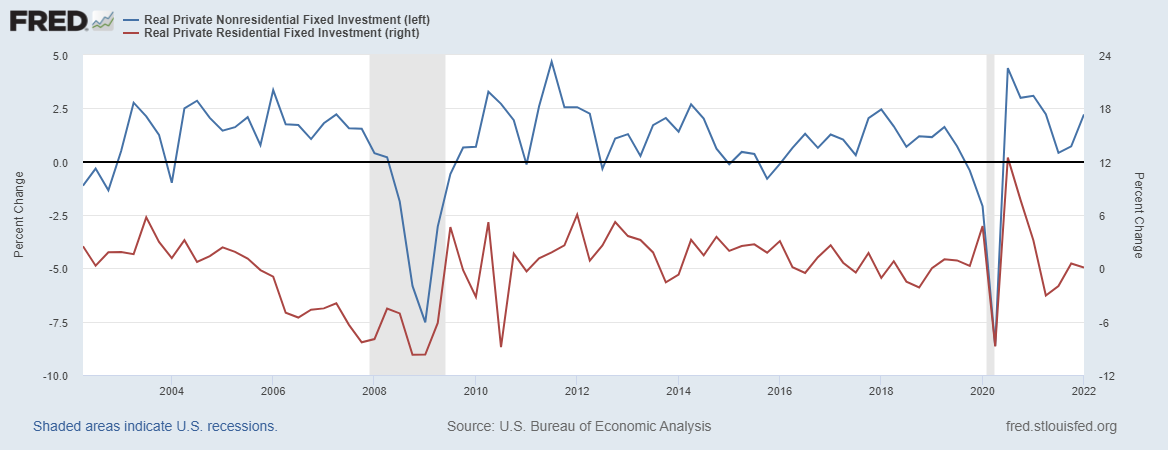
| On the investment side of the economy, can non-residential investment rise enough to offset a drop in residential? |
 . |
| There are plenty of indicators that confirm the recent slowdown but a slowdown isn’t a recession. I’m sure the odds of a recession have risen, especially with the spike in interest rates and the impact on housing but any forecast that goes past the next couple of months is speculative, at best. We could be in recession by the end of the year but you sure can’t make that call right now. Futures markets still point to mid-2023 for the peak in rates although that has moved forward by a quarter.
Example: The ISM surveys have come off their highs but are still well above levels associated with recession. And neither of these is a primary input to our portfolio process because they produce too many false signals. |
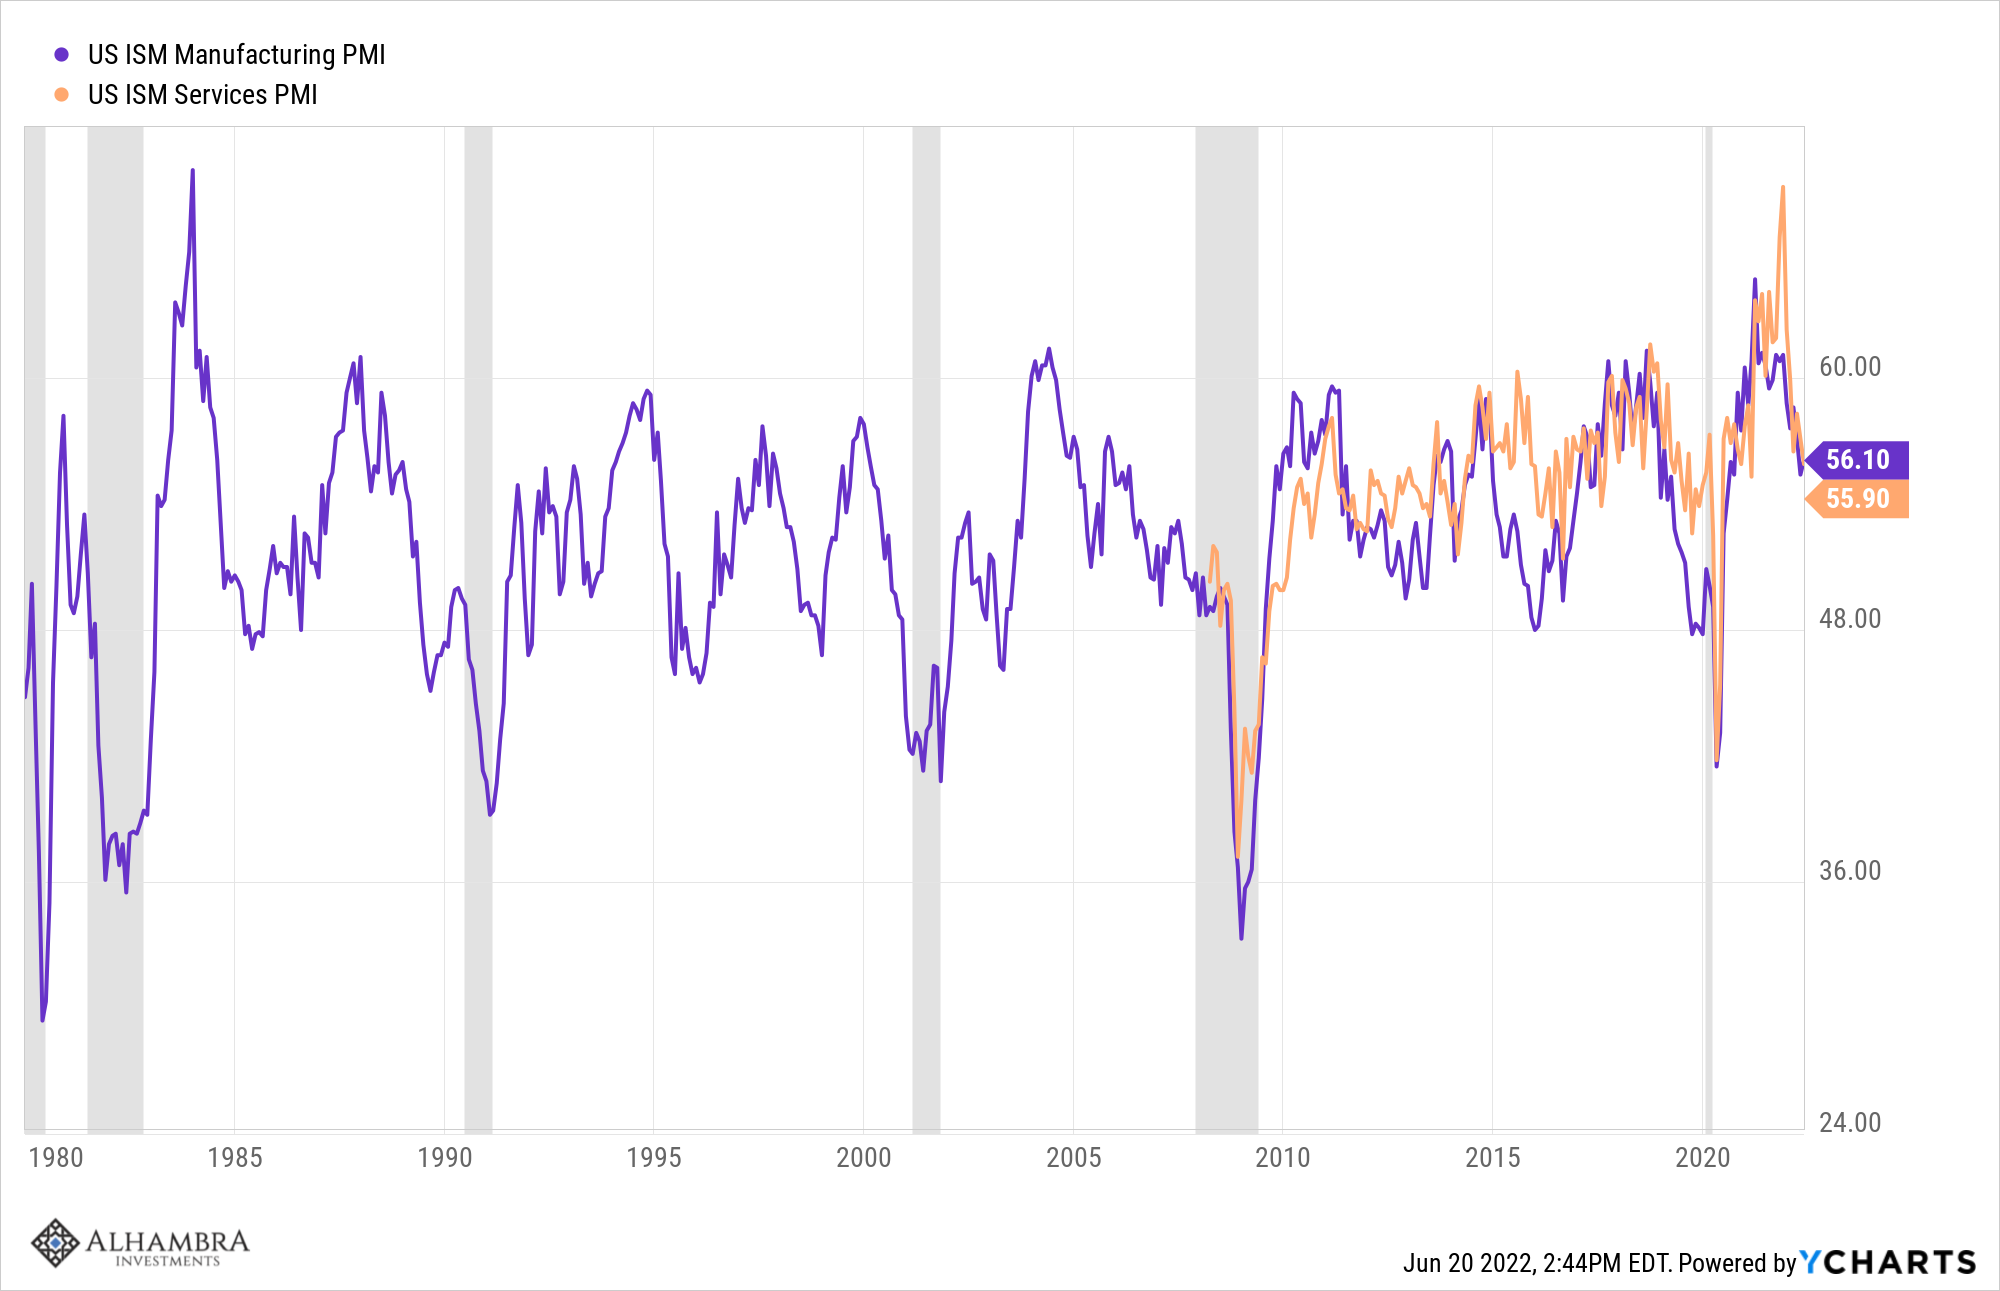 . |
| Readings under 50 happen fairly frequently and don’t lead to recession. It takes a reading under 45 to confirm recession and it has usually started by then. A reading in the upper 50s isn’t anywhere close to recession. It could fall fast but we shouldn’t assume that.
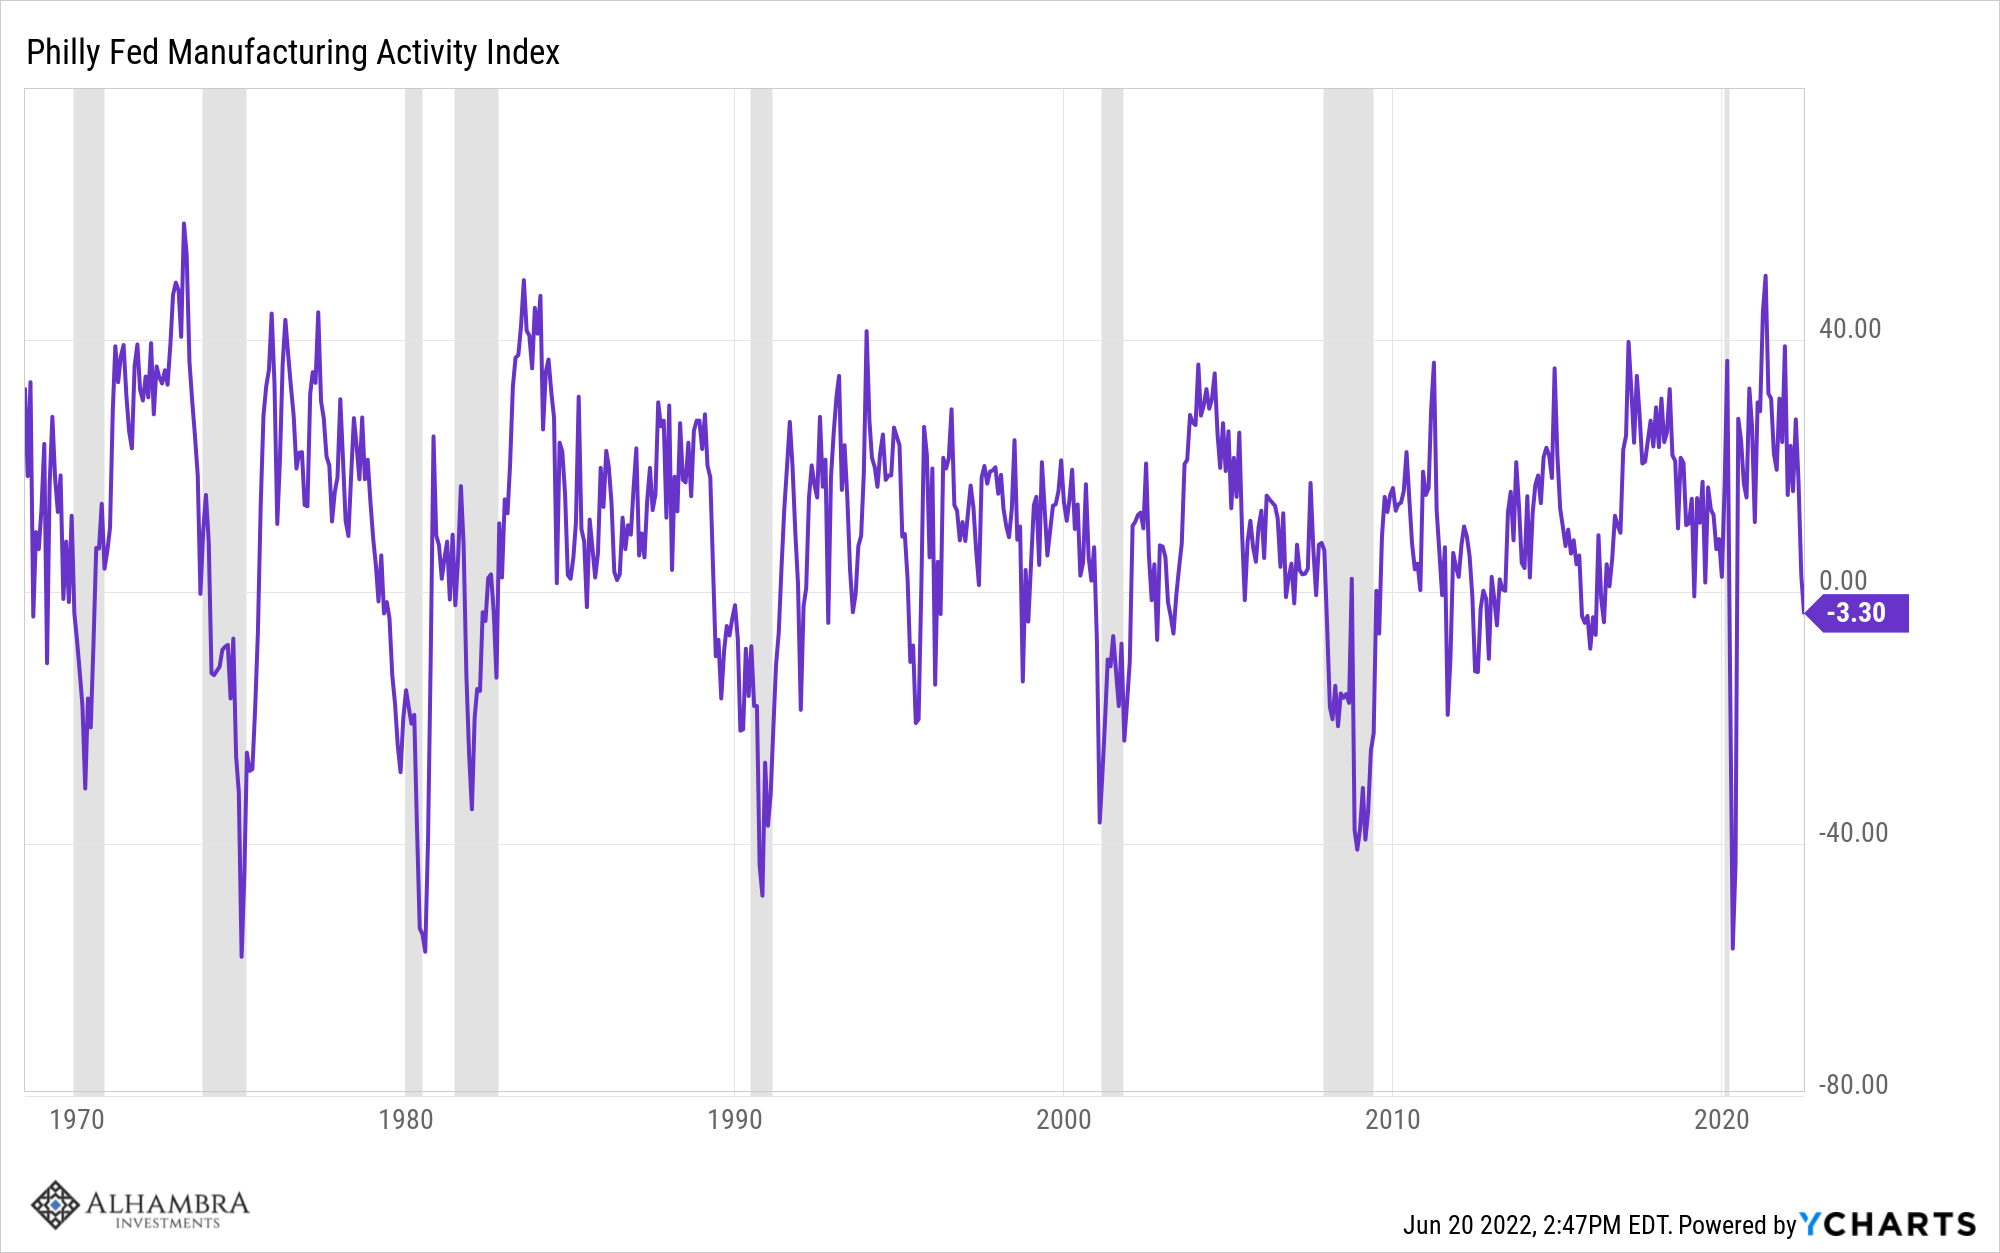
The regional Fed manufacturing surveys also show the slowdown. Like the ISM, these surveys often turn negative without a recession. A negative reading just means things are slowing. We don’t use this as a primary indicator either because of the high number of false signals: |
 . |
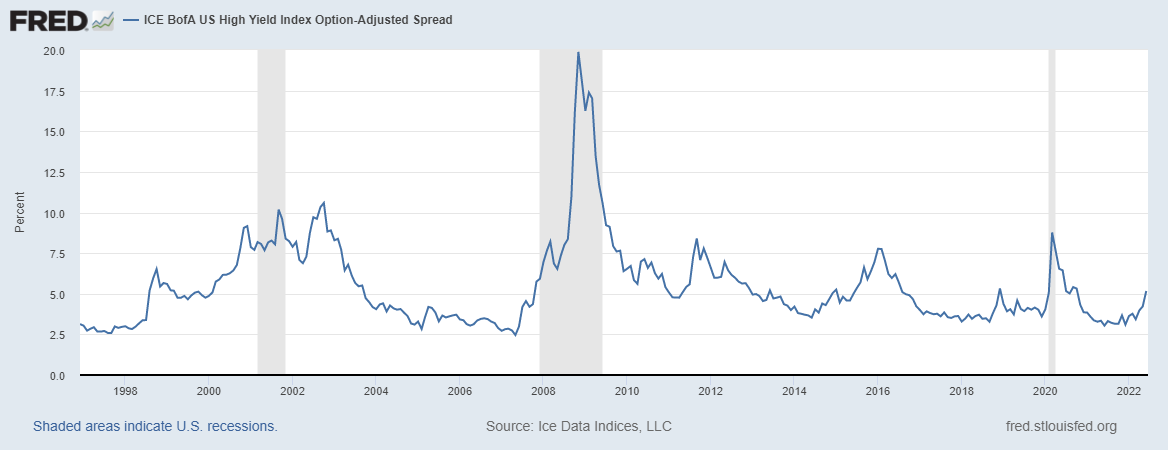
| One indicator we are watching very closely is credit spreads which have recently widened. It is concerning but as you can see there have been numerous higher readings that weren’t associated with recession. Making a big portfolio change based on a spurious reading is exactly what gets investors in trouble. If you sell on a false signal, how do you get back in? This is the one indicator that worries me the most though because risk aversion can have a powerful impact on the economy. Recessions can become self-fulfilling prophecies and economic sentiment is very, very negative at present.
I don’t know how this slowdown will be resolved. There is very little data available right now that points to recession at all, much less something catastrophic like 2008. Yes, credit spreads could keep getting wider, the ISM surveys could get worse, the regional Fed surveys could deteriorate, and retail sales could fall off a cliff while consumers also pull back on travel and other services spending. But we don’t make big portfolio changes based on extrapolating a present trend to its worst-case scenario. We came into this year with our portfolios defensively positioned and we still are. To get even more defensive would require evidence that the economy is doing something more than just slowing from an unsustainable growth rate. |
 . |
MarketsMarket sentiment is at extremes in almost all asset classes. It is profoundly negative about stocks and real estate and, despite a selloff last week, still profoundly positive for commodities. I suspect we are at or near turning points for both but that doesn’t mean either trend is over. The S&P 500 could easily rise by 15 to 20% from these levels and still be in a downtrend (below the 200-day moving average). Commodities could do the opposite and still be in an uptrend. That’s how far away from the long-term trends we are right now. |
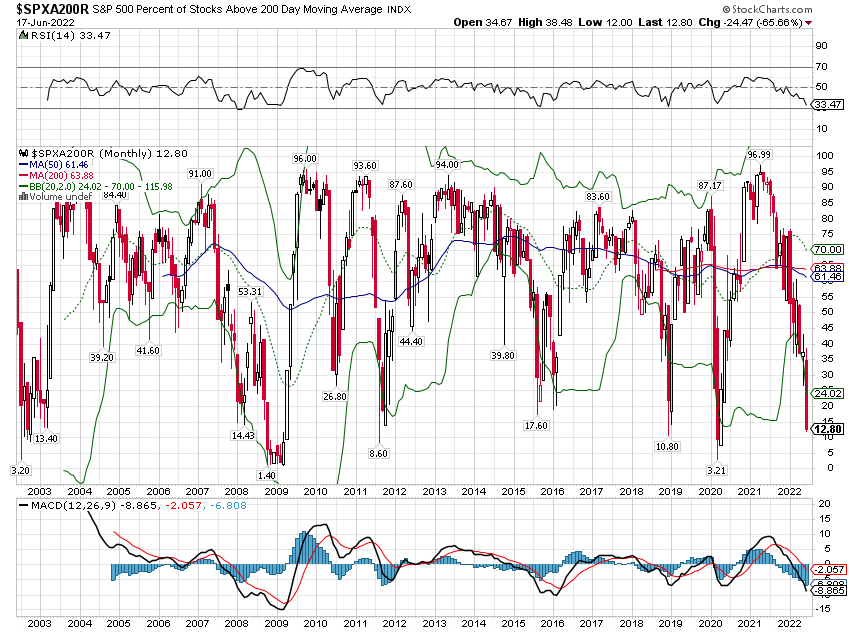 . |
| One measure of sentiment I track is the percentage of stocks in an index that are trading above their 200-day moving average. A low reading would be 20 or less and an extreme reading would be 10 or less. Non-recession corrections tend to bottom above 10 and bear market recessions below. There are extreme situations like 2002 and 2008 when the percentage hit single digits and stayed low for months. In 2002 the % of stocks in the S&P 500 above their 200-day MA first hit single digits in July with the index at 775.68. It rallied and hit a high of 965 in August (24.5% rally), fell and made a new low in October (768.63), rallied again to 954.28 (24.2% rally) in December and retested the low a final time in March of 2003 (788.90). Point being that just because it hits that low doesn’t mean you are off to the races. The bottom can take a while. In 2008, the % fell into single digits in October and the market bottomed at 839.8, rallied to over 1007 (19.9% rally) in November but didn’t make its final low until March 2009 at a low 20% below the October low. The history with the same metric applied to NASDAQ is similar. Where are we today? |
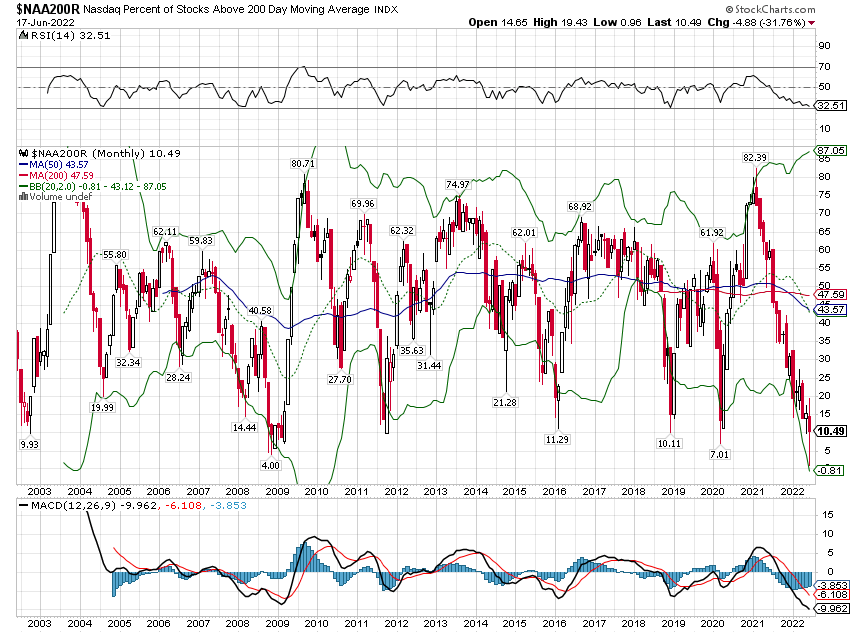 . |
| If this is not a recession or a very mild one, then I’d say we’re very close to making a bottom. If it is a recession, we probably have more time to spend near the lows although new lows are far from a guarantee – a lot of bad news has been priced in already.
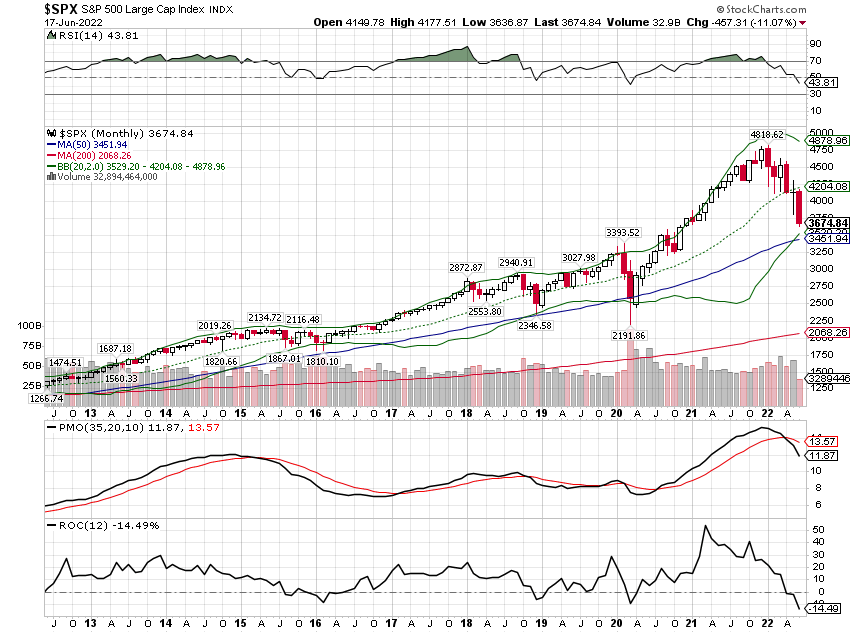
I would also point out that the very long-term trend of the S&P 500 is still up even after this large selloff. The only times we’ve been more oversold was in 2002 and 2008 and in both of those cases the index traded below its 50-month moving average (which it did briefly in 2020 but didn’t close a month down there). If this isn’t another 50% bear market – and those are rare despite us having had two in the last 20 years – then the bottom is probably here or very close. |
 . |
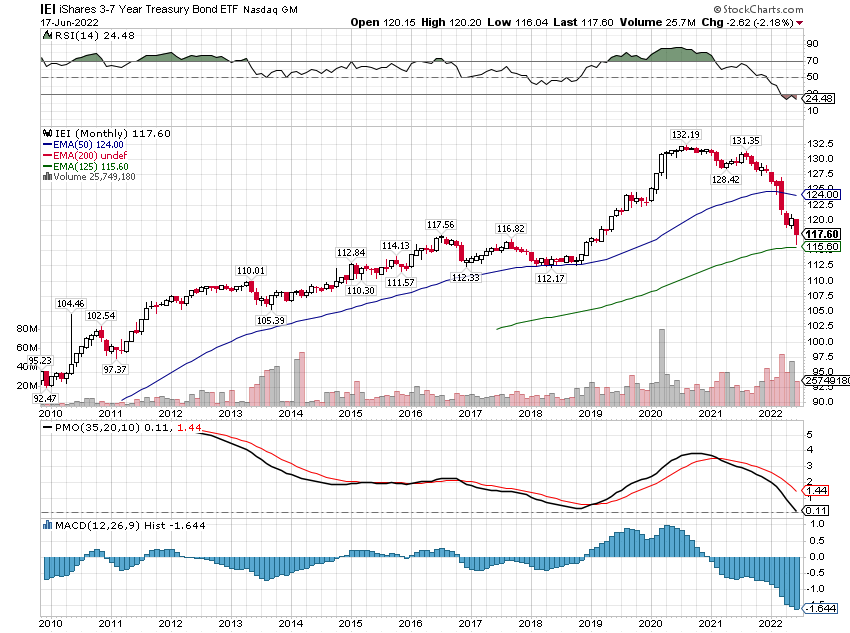
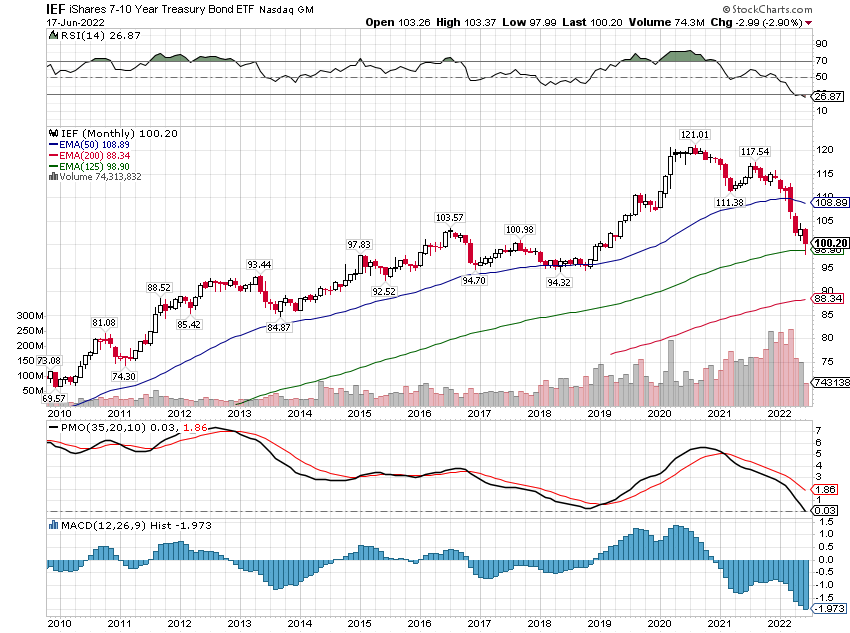
| Bonds are in a similar situation, very oversold and due for a rally. The trend is obviously down since the early 2020 peak: |
 . |
 . |
|
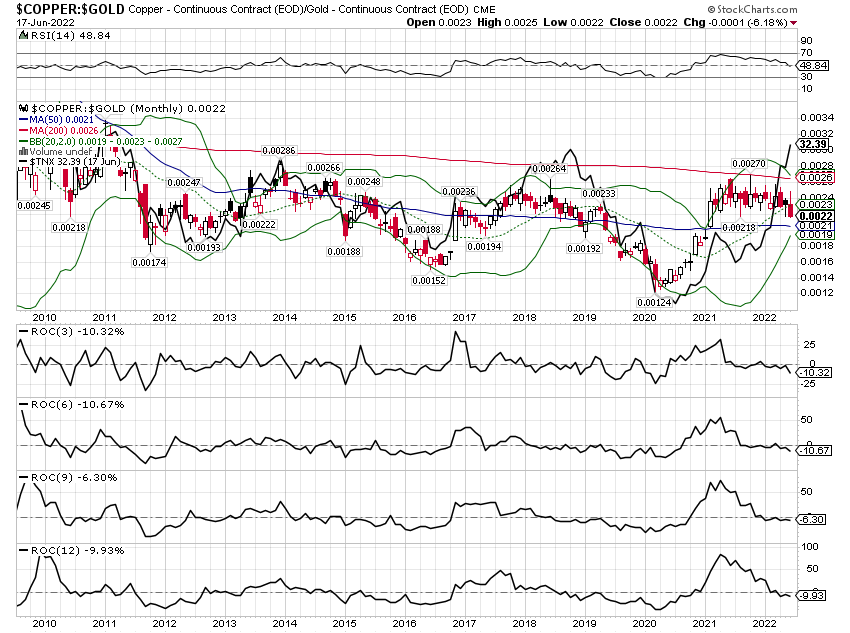
| For bonds to rally, we need rates to fall and that will only come with better inflation news and/or weaker economic data. A helpful market-based indicator is the copper/gold ratio which correlates well with the 10-year Treasury yield. The 3,6,9, and 12-month rates of change on the copper/gold ratio are now negative and if this continues to weaken, the 10-year Treasury yield will likely follow: |
 . |
| A 6 to 8% rally in IEI and an 8 to 10% rally in IEF (we own both) seems quite reasonable. I’m looking for a little more confirmation but I expect to extend the duration of our bond portfolio again soon. Whether it is a short-term or long-term move I don’t know yet; that will be determined by the nature of the economic slowdown.
A rally in bonds – a fall in rates – should also be positive for REITs and the dividend stocks (26% utilities). The bigger question is what a fall in rates would do to commodities, gold, and the dollar. It will be important to see how real rates react relative to nominal rates and how inflation expectations change. Ideally, we’d see a fall in nominal bond yields and steady real rates resulting in a fall in inflation expectations. But ideal may be too much to ask and if real rates start to fall in the context of an economic slowdown, gold should outperform general commodities. As for the dollar, its course is more likely to be determined by what is going on outside the US but in general, a slowdown here relative to the rest of the world would be negative for the buck. The course of the dollar will largely determine if and how we might change our equity allocations. Right now, we have some international value exposure but the rest is defensive US equity. If the economy cools but doesn’t fall apart, we may need to shift to more offense and valuations would point to increased mid or small-cap exposure. The S&P 500 and its growth piece are still expensive, if a lot cheaper than they were, but I would be reluctant to make any long-term commitments to those areas unless we believe earnings will accelerate sharply (which we don’t at present). International stocks are still cheaper than the US and it really doesn’t matter what part of the world you look at. EAFE is 12 times earnings, Asia ex-Japan is 14 times, Japan is 12 times and global stocks are 15 times. The value versions of those are even cheaper. |
 . |
| Shifting to more international exposure though would require that the dollar get into a downtrend and right now it is still sitting near its recent highs.
For now, we are not making any big moves because we don’t have sufficient evidence to do so. We remain defensive because the economy is slowing but we also think inflation is peaking (example: Philly Fed manufacturing prices paid component is down 20% over the last 3 months). We are likely to soon extend the duration of our bond portfolio again to take advantage of what we think could be a significant rally in bonds. I would expect too that better inflation data and softer economic data should put the Fed on a less aggressive path. But Powell seems uniquely clueless in the recent string of lousy Fed Chairmen so who knows? If the market starts to price out some of the currently expected rate hikes, I would also expect a positive response from stocks. Whether that is a temporary reprieve, the calm before the recession storm, or a new bull market I can’t say yet. The rising dollar, rising rate environment continues although the ascent of both slowed at the end of last week. This means nothing of course; it was just a couple of days. The trend for both is still solidly up and both could pull back considerably and still be considered as such. A first downside target for the 10-year yield is about 2.94%, second down to the May low at 2.71% and a third at 2.25%. For the dollar, first downside target would be 102.6, second @ 98. Anything below that would end the intermediate uptrend. Obviously, there was no place to hide last week but that isn’t even interesting. What is, is that growth stocks outperformed value for the week and since late May. It isn’t enough yet to change the trend but it is potentially a positive sign if the things that were hit hardest are starting to do relatively better. China was again an outperformer but still down on the week. |
 . |
| Energy stocks got clobbered last week, and are now down over 20% from their recent highs. Crude appears to have broken its short-term uptrend last week. A return to the intermediate-term trend line would take it down to about $88. If you get that drop in crude, XLE is going lower. A guesstimate would be another 15% down from here. Utilities were the second-worst performer, on the back of higher rates, I suppose. If bonds rally I’m pretty sure utilities and REITs will too. |
 . |
| It is a very uncertain time for markets and the economy. Of course, it always is; uncertainty is the norm because none of us can predict the future. We have acted defensively this year and that has been the right call but I think we need to be thinking about offense now. Stocks and bonds are both extraordinarily oversold and sentiment is as negative as I’ve ever seen it. In some ways, it feels more negative than 2008 but the economic condition today is a lot healthier than then. Investors seem to want to price in the worst-case scenario when we don’t even have evidence yet of anything other than an economic slowdown. It may turn into something worse but, if the past is any guide, there will be some monster rallies along the way even if that is true. If you don’t feel good about where you are now, use one of those rallies to lighten up. We didn’t go straight down in 2008 and I doubt we will now. Right in the heart of that mess, in November of 2008, the S&P rallied 20%. Yes, it was short term and we went on to make new lows but anyone who wanted to sell some got a chance to do so in a rally rather than selling on the lows. |
 . |
I don’t know where or when this bear market will end. No one does. Will it be a down 50% like 2002 and 2008? Or are we almost at the bottom? There are certainly a lot of similarities between today and the 2000-2002 bear market with crypto taking the role of the dot com stocks. Is Tether the Enron of crypto? Maybe. Are NFTs the Beanie Babies of that earlier time? Could be. Is the crash in crypto affecting the stock market? With so many “hedge” funds out there chasing those returns, my guess is yes. But crypto is down to about $800 billion in total market cap so whatever impact there is should fade from here. But, yes, I can see some parallels between those two periods. On the other hand, comparisons to 2008 just seem a tad overwrought. I don’t see a banking crisis in our future.
I’ve said recently that investors ought to be at least thinking about doing some buying and I stand by that. There are definitely bargains out there and everyone else is scared to death. Last week I quoted Warren Buffett’s maxim to be greedy when others are fearful. Well, they got more fearful last week based on nothing more than a useless interest rate moving up by 0.25% more than previously thought necessary. Is an interest rate a quarter-point higher really going to push us into something as bad as 2008? I have my doubts. Maybe it’s time to get braver.
Full story here Are you the author?Tags: Alhambra Portfolios,Bear Market,Bonds,commodities,consumption,Copper,copper/gold ratio,CPI,credit spreads,Crude Oil,crypto,currencies,economy,energy stocks,Featured,Federal Reserve/Monetary Policy,federal-reserve,FOMC,Gold,inflation,Interest rates,investment,Market Sentiment,Markets,Natural Gas,newsletter,productivity,Real Estate,real interest rates,REITs,Retail sales,S&P 500,speculation,stocks,TIPS,US dollar


