Marc Chandler
My articles My offerMy siteAbout meMy videosMy books
Follow on:LinkedINTwitterSeeking AlphaAmazon
| This Great Graphic, created on Bloomberg show the performance of growth and value stocks since the start of December 2016. The yellow line is the Russell 1000 Growth Index. The white line is the Russell 1000 Value Index. The outperformance of the former is clear.
The Value Index tracks the performance of Russell 1000 companies with lower price-to-book ratios and lower projected growth values. The Growth Index includes the Russell 1000 companies with higher price-to-book ratios and who anticipated stronger growth. We chose to begin at the end the chart at the end of last year to show how they had been moving together and to see the divergence this year. The 60-day rolling correlation on the percentage change in recent years has been very stable between 0.90 and 0.95 with few exceptions. The correlation weakened in toward the middle of last year and slipped to 0.85. It recovered only to break down again toward the end of 2016. The correlation finished last year near 0.75. It briefly dipped below 0.60 in mid-February. It bounced back to 0.90 in early May but has broken down and is below 0.70 today. Before this year, the rolling 60-day correlation was not below 0.80 since 2001. In the bigger picture, in the early stages of the recovery in 2009, value outperformed growth. Since mid-2011, growth has outperformed, with some minor exceptions in the first part of 2013. The divergence has become more pronounced in early 2015 and has continued through H1 17. It is not clear what this means about H2 17. It appears that if convergence is going to take place, it may likely be at the lower absolute levels. |
Performance of Growth and Value Stocks Compared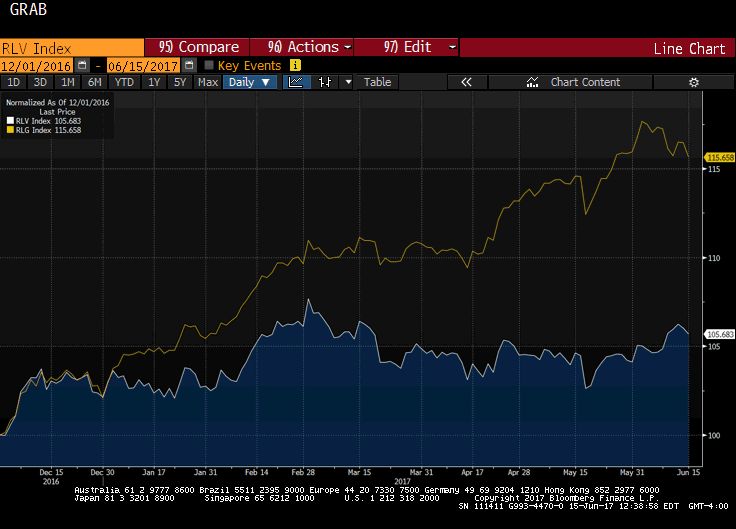 White Line: Russell 1000 Value Index, Yellow line: Russell 1000 Growth Index - Click to enlarge |
Are you the author?
Tags: newslettersent