Marc Chandler
My articles My offerMy siteAbout meMy videosMy books
Follow on:LinkedINTwitterSeeking AlphaAmazon
George Dorgan My articles My siteAbout meMy videosMy books Follow on:LinkedINTwitterSeeking Alpha CFA SocietyEconomicBlogs
Swiss Franc Currency IndexFor the first week since the election of Trump, the Swiss Franc index had a clearly better performance than the dollar index. It improved by 1.5% in the last ten days.
|
Trade-weighted index Swiss Franc, January 14(see more posts on Swiss Franc Index, )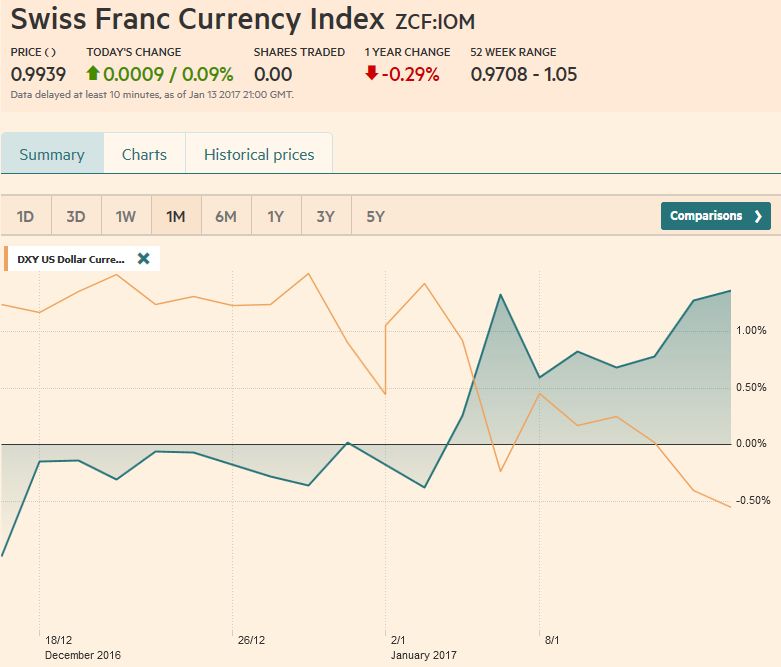 Source: markets.ft.com - Click to enlarge |
Swiss Franc Currency Index (3 years)The Swiss Franc index is the trade-weighted currency performance (see the currency basket)On a three years interval, the Swiss Franc had a weak performance. The dollar index was far stronger. The dollar makes up 33% of the SNB portfolio and 25% of Swiss exports (incl. countries like China or Arab countries that use the dollar for exchanges). Contrary to popular believe, the CHF index gained only 1.73% in 2015. It lost 9.52% in 2014, when the dollar (and yuan) strongly improved. |
Swiss Franc Currency Index (3 years), January 14(see more posts on Swiss Franc Index, )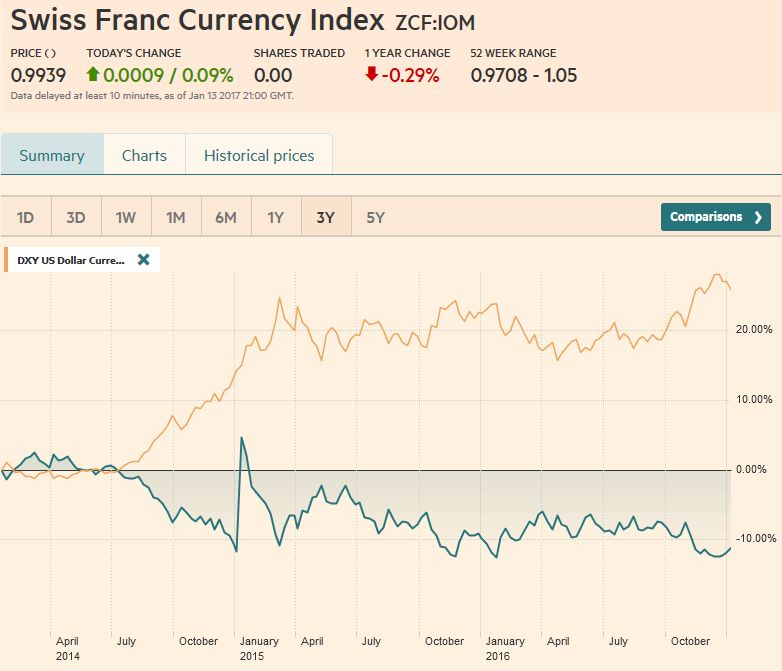 Source: markets.ft.com - Click to enlarge |
|
USD/CHFThe correction in the capital markets began shortly after the Federal Reserve hiked rates on December 14.
The correction or consolidative phase follows an otherwise strong trending quarter, where moves accelerated after the unexpected victory by Trump.
Last week we still anticipated the correction could persist even after the January 4 US jobs report showed more earnings growth than expected. However, now after the additional losses, the dollar appears ready to turn.
Interest rates remain integral to our dollar narrative. It is not coincidental that the dollar’s downside move coincided with a pullback in yields and a narrowing of the US premium. Interest rates may be the place to begin our review of the technical outlook.
The 10-year yield fell to nearly 2.30% on January 12, new lows since the end of November, before recovering to close at new session highs of 2.36%.
|
US Dollar/Swiss Franc FX Spot Rate, January 14(see more posts on USD/CHF, )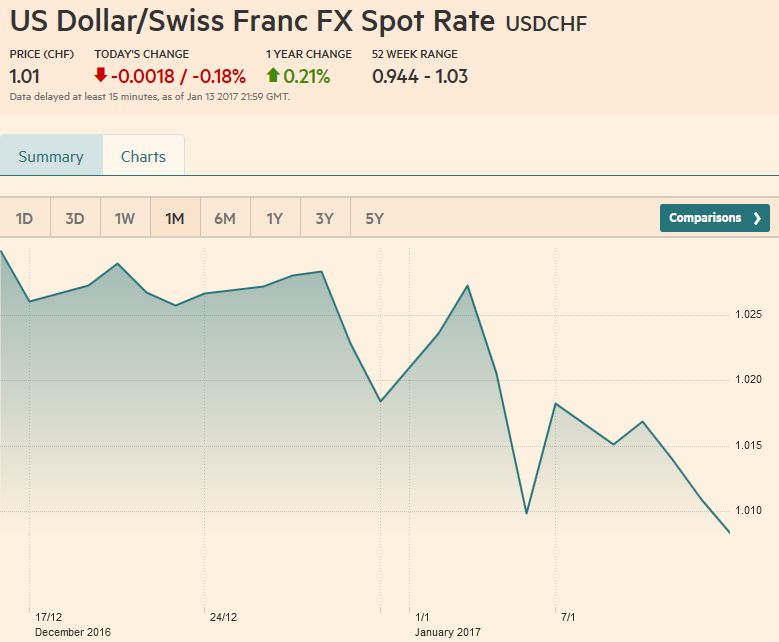 Source: markets.ft.com - Click to enlarge |
US Dollar IndexThe Dollar Index completed a 38.2% retracement of its gains since the US election on January 12. The small gains before the weekend saw the RSI turn higher, while the MACDs and Slow Stochastics are getting ready to On the downside, a convincing break of 100.65 could spur a move to the next retracement level near 99.80.
|
US Dollar Currency Index Dollar Index, January 14(see more posts on Dollar Index, )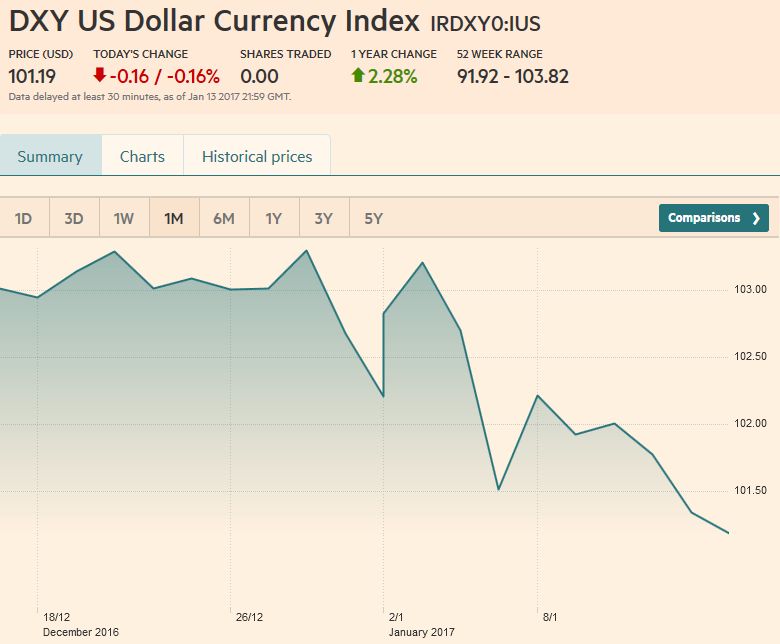 Source: markets.ft.com - Click to enlarge |
EUR/USDThe technicals look further away from turning in the euro than the Dollar Index. A move above $1.0710 could signal a
further recovery toward $1.0820. The euro has not closed below its five-day moving average, (~1.0590) since January 3. A potential trendline drawn from this year’s lows comes in near $1.05 on January 16 and finishes the week near $1.0575. A violation of the five-day average on a closing basis or a
break of the trendline would likely signal the upside correction phase for the euro has run its course.
|
EUR/USD Week Ending January 14 Technical Indicators(see more posts on Bollinger Bands, EUR/USD, MACDs Moving Average, RSI Relative Strength, Stochastics, )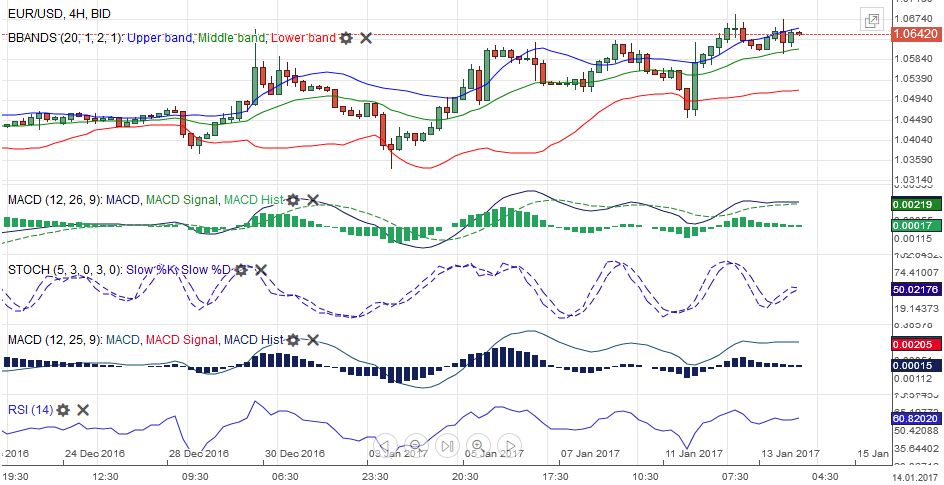 EUR/USD Week January 14 Technical Indicators - Click to enlarge |
USD/JPYThe dollar initially saw follow through buying in Asia though Japan was on holiday, after the US employment data.
The greenback was buoyed from JPY117.00 to JPY117.50. However, it was greeted with fresh selling that ultimately
drove the dollar to JPY113.75. The technical indicators we use have not turned, but they are getting stretched. A move above JPY115.60 could signal a move in the JPY116.20-JPY116.80 band. |
USD/JPY Week Ending January 14 With Technical Indicators(see more posts on Bollinger Bands, Japanese yen, MACDs Moving Average, RSI Relative Strength, Stochastics, )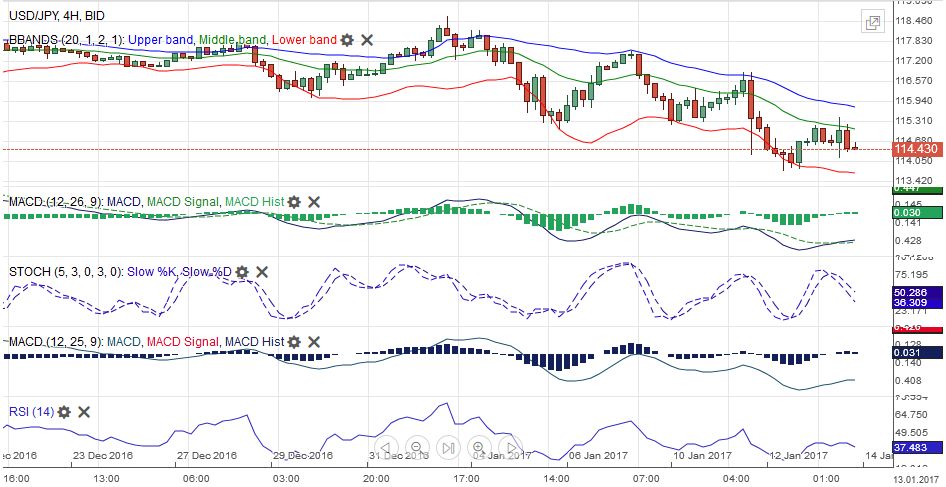 . |
GBP/USDSterling continued to trade heavily. It was the only major to lose ground against the dollar last week. Prime Minister May’s acknowledgment that the UK is going to lose single market access sent sterling to $1.2040, its lowest level since the flash crash last October. It managed to recover to $1.2320 but seemed to attract sellers. While the five and 20-day moving averages cross for the euro and yen, they did not believe in sterling. May speaks again on January 17, but speculation before the weekend that the collapse of the government in Northern Ireland may delay the triggering of Article 50 helped sterling post corrective upticks. Nevertheless, it failed again to finish the week above $1.22 which had been the lower end of its range since last October. That said, it is possible that the $1.2040 low is more durable than the price action thus far suggests. The price action in coming days will help clarify the technical outlook for possibly the rest of
the quarter. |
GBP/USD Week Ending January 14 Technical Indicators(see more posts on Bollinger Bands, British Pound, MACDs Moving Average, RSI Relative Strength, Stochastics, ) . |
AUD/USDThe Australian dollar rose 2.5% against the US dollar last week. In fact, it rose every day last week and in eight of the past nine sessions. It the three-week advance, it has gained about 4.25%. On January 2, it traded down to almost $0.7165, and on January 12, it reached nearly $0.7520. The high before the Fed’s mid-December rate hike was $0.7525. The $0.7540 area corresponds to the 61.8% retracement of its losses since the US election. The Australian dollar has not closed below its five-day moving average (~$0.7425) since January 2. A loss of this area could be a preliminary sign that the upside correction is over. The Slow Stochastics look set to cross lower, and the MACDs appear to be peaking.
|
AUD/USD Week January 14 Technical Indicators(see more posts on Australian Dollar, Bollinger Bands, MACDs Moving Average, RSI Relative Strength, Stochastics, )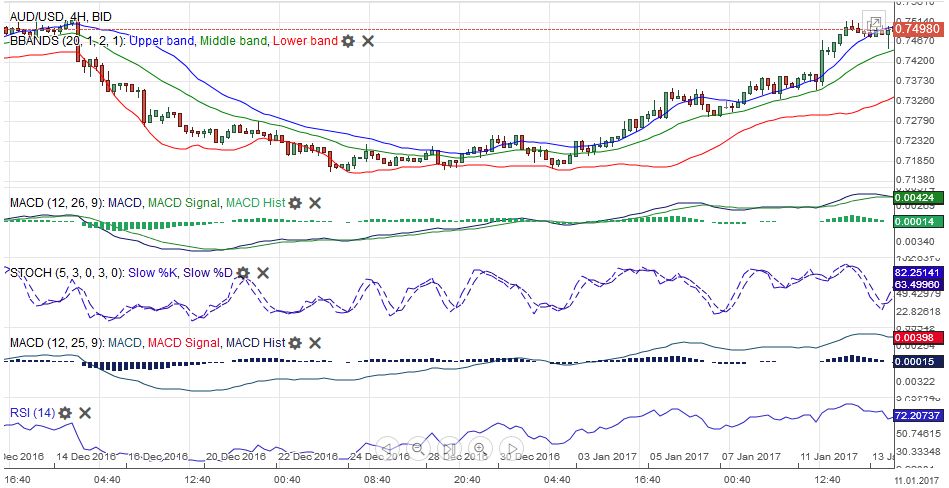 . |
USD/CADThe Canadian dollar extended its recent gains with a surge around the middle of last week that carried it to the best level and through its 200-day moving average (CAD1.3100) for the first time in three months. The US dollar reached CAD1.3030. The greenback quickly recovered into a more stable band between CAD1.31 and CAD1.32. The Bank of Canada meets in the week ahead. Recent data has been constructive, include employment and trade.
|
USD/CAD Week January 14 Technical Indicators(see more posts on Bollinger Bands, Canadian Dollar, MACDs Moving Average, RSI Relative Strength, Stochastics, )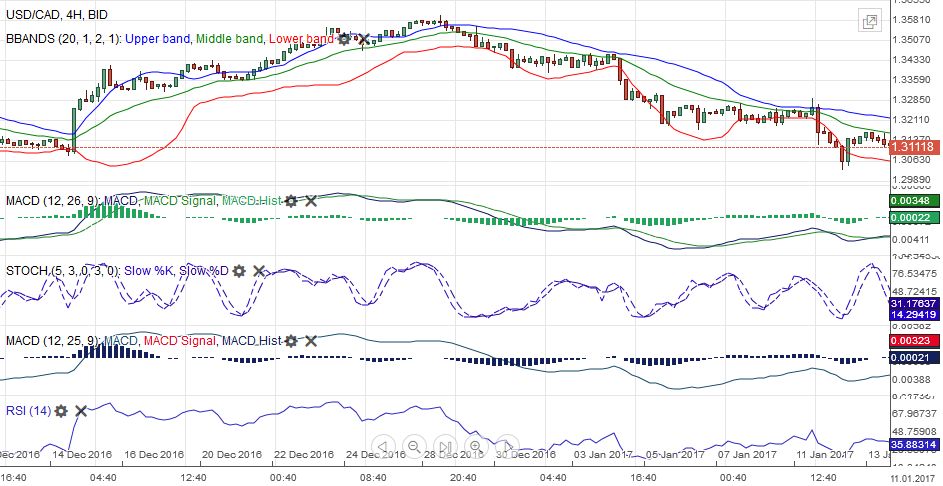 . |
Crude OilThe February light sweet crude oil futures contract snapped a four-week advance with a 2.5% drop, despite reports suggesting Saudi Arabia has cut more output than it Price snapped back quickly from a push below $51 a barrel, and the lowest level since the end of November. |
Crude Oil, January 14(see more posts on Crude Oil, )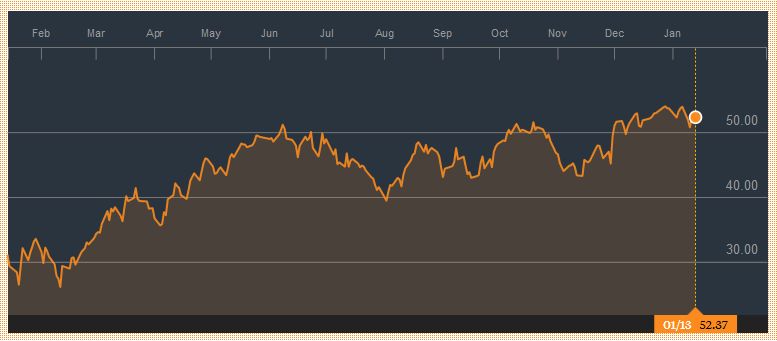 Source: bloomberg.com - Click to enlarge |
U.S. TreasuriesThe two-year yield peaked on December 15 at 1.30%. It pulled back to near 16 bp through January 12, when, like the 10-year note, the yield recovered and saw follow through gains ahead of the weekend. After five closes below the 20-day moving average, the two yield closed above it (~1.21% )before the weekend. The technical tone of the March two-year note futures contract is deteriorating, which is also consistent with the completion of the corrective phase. Before the weekend, and despite if anything softer PPI and disappointing retail sales figures, the yield rose another six basis point. The March note futures stalled at 125-10. It tried separate sessions sine January 6. After failing for the third time before the weekend, a sell-off ensured that brought the contract toward the week’s low of 124-07, which is also a 38.2% retracement of the gains since December 15. The 50% retracement is found at 123-28, and the 61.8% retracement is at 123-17. |
Yield US Treasuries 10 years, January 14(see more posts on U.S. Treasuries, )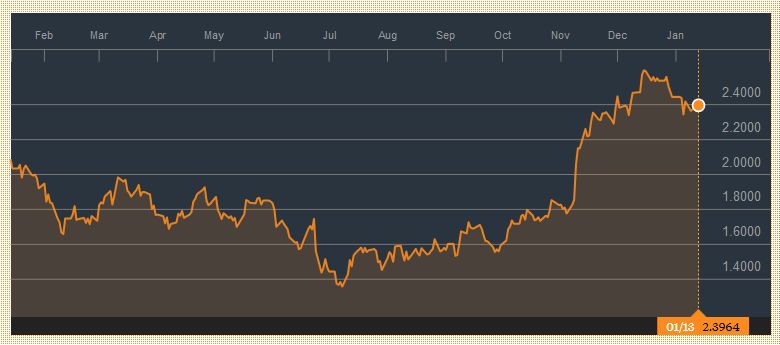 Source: bloomberg.com - Click to enlarge |
S&P 500 IndexThe Dow Jones Industrials and the S&P 500 slipped lower last week, while the NASDAQ tacked on one percent. Despite this and the fact that the Dow remains below the 20k psychological level, the underlying tone remains firm.
With the S&P 500 less than 0.5% from its record, and Dow 20k
still in view, there is no sign that equity investors are disturbed by the lack of detail on tax reform, infrastructure spending, and deregulation. Since the end of November, the S&P 500 have been trading in a saw tooth pattern; alternating weeks are advancing and declining. To extend the pattern, the S&P 500 needs to close higher next week. A break of the 2250 area would weaken the market’s technical condition.
|
S&P 500 INDEX, January 14(see more posts on S&P 500 Index, )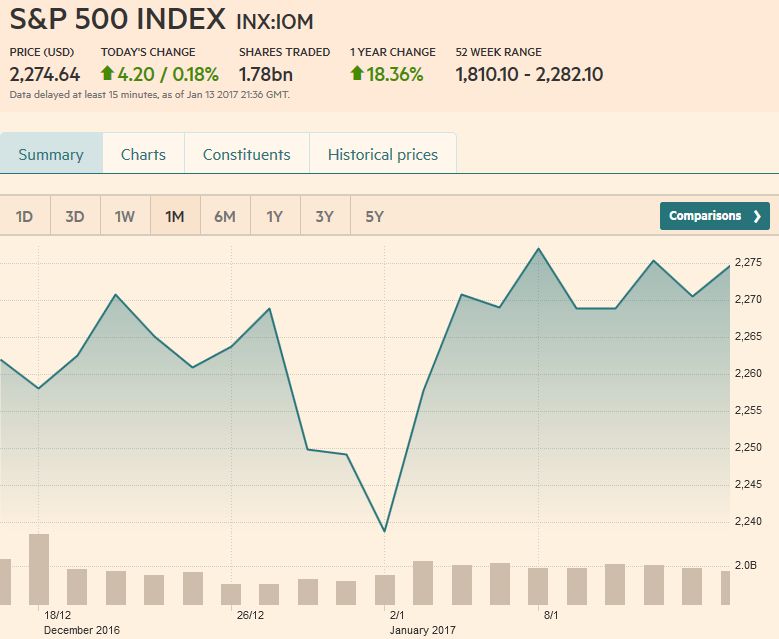 Source: markets.ft.com - Click to enlarge |
Are you the author?
Tags: Australian Dollar,Bollinger Bands,British Pound,Canadian Dollar,Crude Oil,Dollar Index,EUR/CHF,EUR/USD,Euro,Euro Dollar,Japanese yen,MACDs Moving Average,newslettersent,RSI Relative Strength,S&P 500 Index,Stochastics,Swiss Franc Index,U.S. Treasuries,usd-jpy,USD/CHF