Tag Archive: The Stock Market
US Stock Market: Happy Days Are Here Again? Not so Fast…
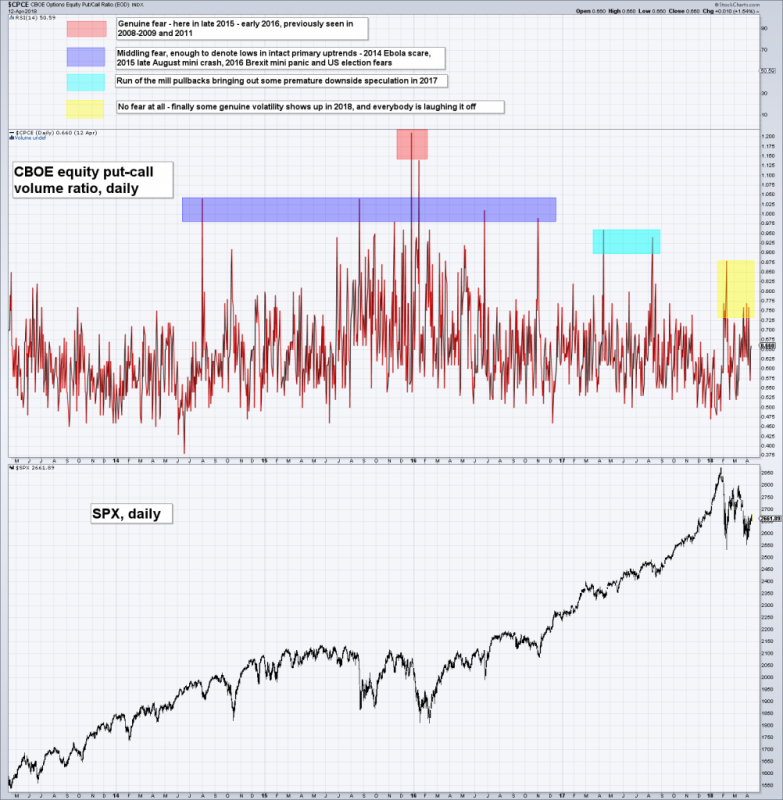
Obviously, assorted crash analogs have by now gone out of the window – we already noted that the market was late if it was to continue to mimic them, as the decline would have had to accelerate in the last week of March to remain in compliance with the “official time table”. Of course crashes are always very low probability events – but there are occasions when they have a higher probability than otherwise, and we will certainly point those out...
Read More »
Read More »
Short Term Market Signals
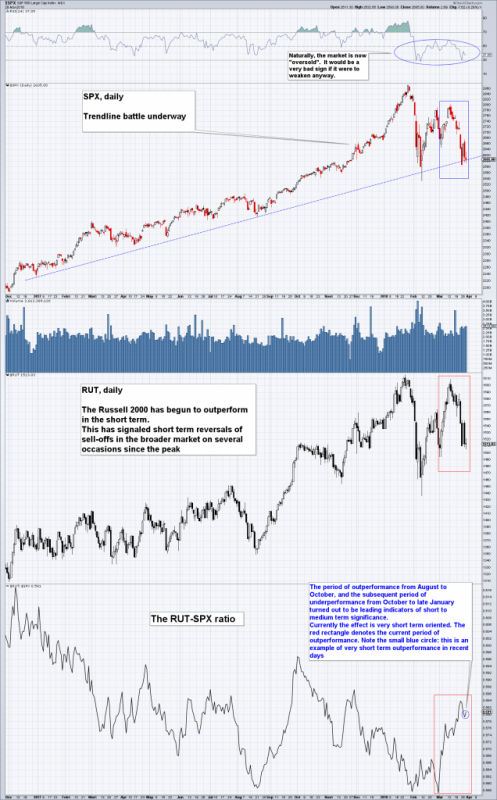
We reviewed the daily charts after yesterday’s close and noticed that the Russell 2000 Index, the NYA and transportation stocks all exhibited relative strength (the same holds actually for the DJIA), particularly vs. the FANG/NDX group. This is happening just as the SPX is battling with an extremely important trendline. As we pointed out before, relative strength in the RUT in particular served as a short term reversal signal ever since the...
Read More »
Read More »
GBEB Death Watch
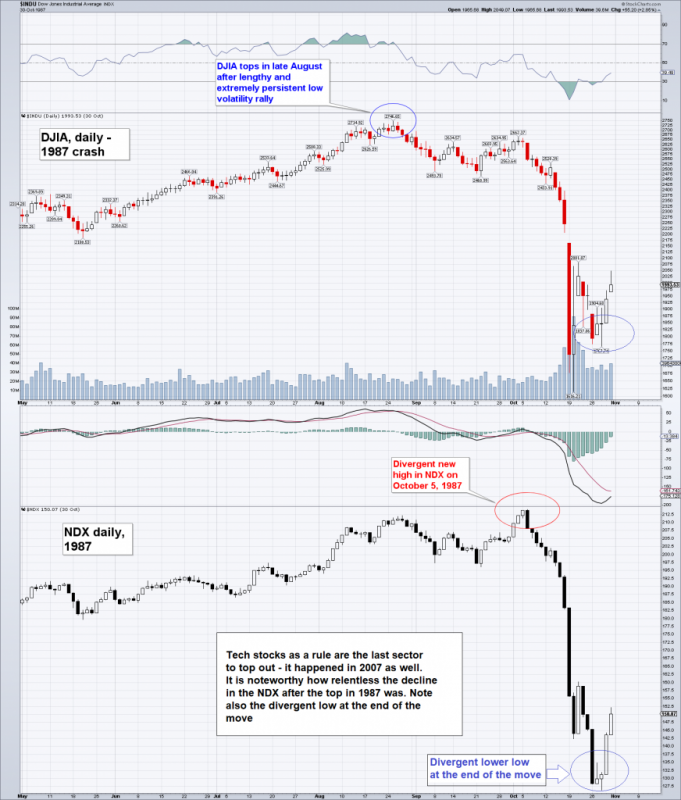
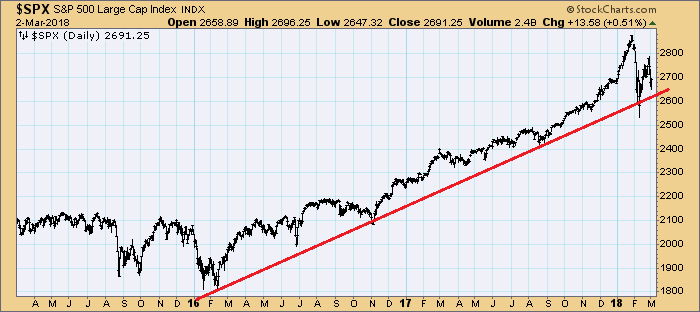
As our friend Dimitri Speck noted in his recent update, the chart pattern of the SPX continues to follow famous crash antecedents quite closely, but obviously not precisely. In particular, the decisive trendline break was rejected for the moment. If the market were to follow the 1987 analog with precision, it would already have crashed this week.
Read More »
Read More »
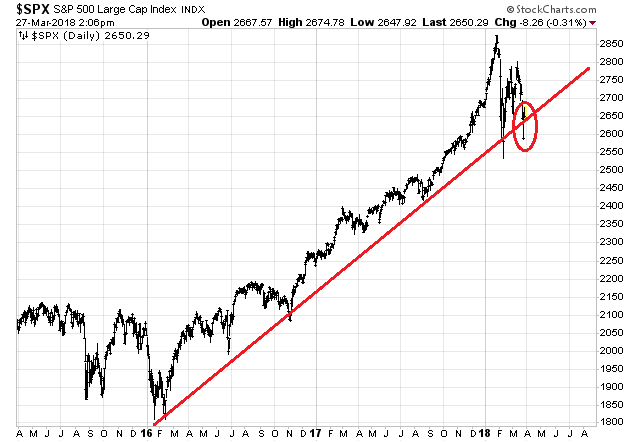
Trendline Broken: Similarities to 1929, 1987 and the Nikkei in 1990 Continue
In an article published in these pages in early March, I have discussed the similarities between the current chart pattern in the S&P 500 Index compared to the patterns that formed ahead of the crashes of 1929 and 1987, as well as the crash-like plunge in the Nikkei 225 Index in 1990. The following five similarities were decisive features of these crash patterns.
Read More »
Read More »
US Stock Market – How Bad Can It Get?
In view of the fact that the stock market action has gotten a bit out of hand again this week, we are providing a brief update of charts we have discussed in these pages over the past few weeks (see e.g. “The Flight to Fantasy”). We are doing this mainly because the probability that a low probability event will actually happen has increased somewhat in recent days.
Read More »
Read More »
US Stock Market – The Flight to Fantasy
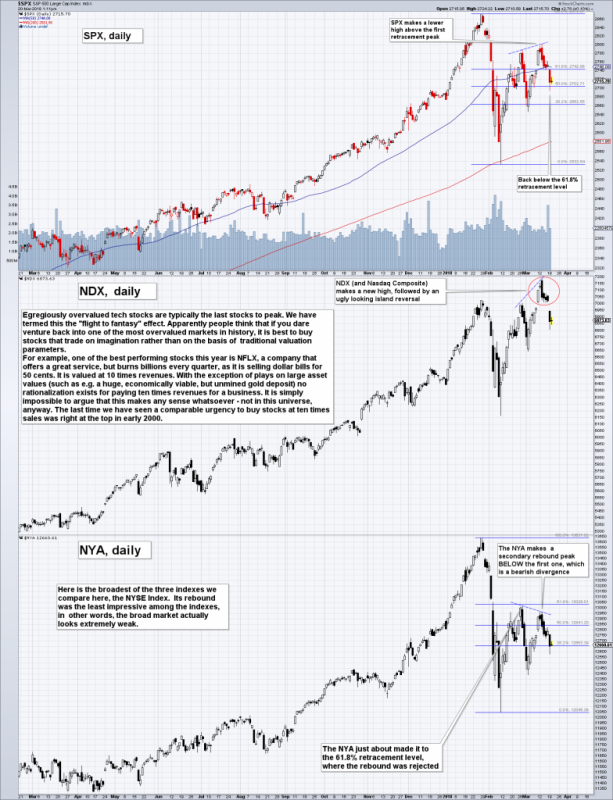
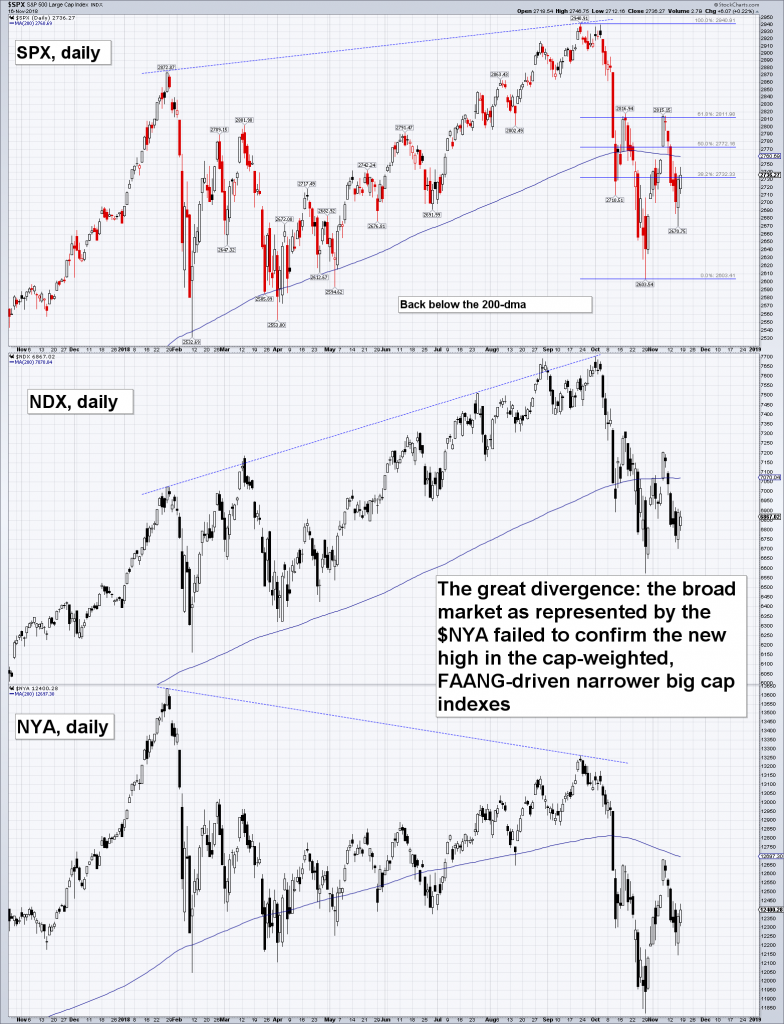
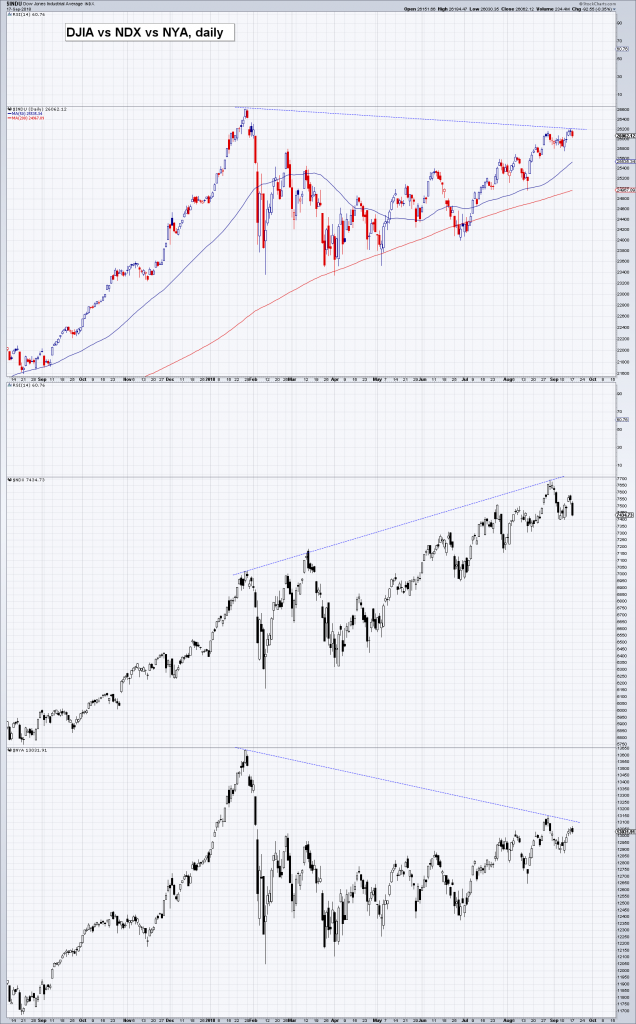
The chart formation built in the course of the early February sell-off and subsequent rebound continues to look ominous, so we are closely watching the proceedings. There are now numerous new divergences in place that clearly represent a major warning signal for the stock market. For example, here is a chart comparing the SPX to the NDX (Nasdaq 100 Index) and the broad-based NYA (NYSE Composite Index).
Read More »
Read More »
Stock and Bond Markets – The Augustine of Hippo Plea
Most fund managers are in an unenviable situation nowadays (particularly if they have a long only mandate). On the one hand, they would love to get an opportunity to buy assets at reasonable prices. On the other hand, should asset prices actually return to levels that could be remotely termed “reasonable”, they would be saddled with staggering losses from their existing exposure. Or more precisely: their investors would be saddled with staggering...
Read More »
Read More »
US Stock Market: Conspicuous Similarities with 1929, 1987 and Japan in 1990
There are good reasons to suspect that the bull market in US equities has been stretched to the limit. These include inter alia: high fundamental valuation levels, as e.g. illustrated by the Shiller P/E ratio (a.k.a. “CAPE”/ cyclically adjusted P/E); rising interest rates; and the maturity of the advance. Near the end of a bull market cycle there is always the question of when a decline will begin, and above all, how large will it be.
Read More »
Read More »
Update on the Modified Davis Method
Frank Roellinger has updated us with respect to the signals given by his Modified Ned Davis Method (MDM) in the course of the recent market correction. The MDM is a purely technical trading system designed for position-trading the Russell 2000 index, both long and short (for details and additional color see The Modified Davis Method and Reader Question on the Modified Ned Davis Method).
Read More »
Read More »
US Equities – Retracement Levels and Market Psychology
Following the recent market swoon, we were interested to see how far the rebound would go. Fibonacci retracement levels are a tried and true technical tool for estimating likely targets – and they can actually provide information beyond that as well. Here is the S&P 500 Index with the most important Fibonacci retracement levels of the recent decline shown. So far, the SPX has made it back to the 61.8% retracement level intraday, and has weakened a...
Read More »
Read More »
What Kind of Stock Market Purge Is This?
Down markets, like up markets, are both dazzling and delightful. The shock and awe of near back-to-back 1,000 point Dow Jones Industrial Average (DJIA) free-falls is indeed spectacular. There are many reasons to revel in it. Today we shall share a few. To begin, losing money in a multi-day stock market dump is no fun at all. We’d rather get our teeth drilled by a dentist. Still, a rapid selloff has many positive qualities.
Read More »
Read More »
Seasonality of Individual Stocks – an Update
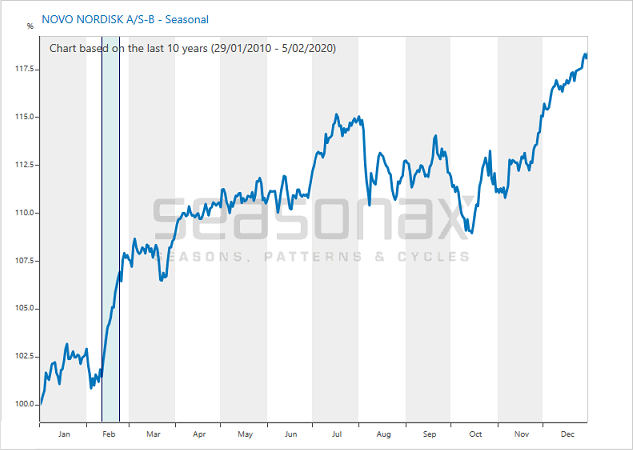
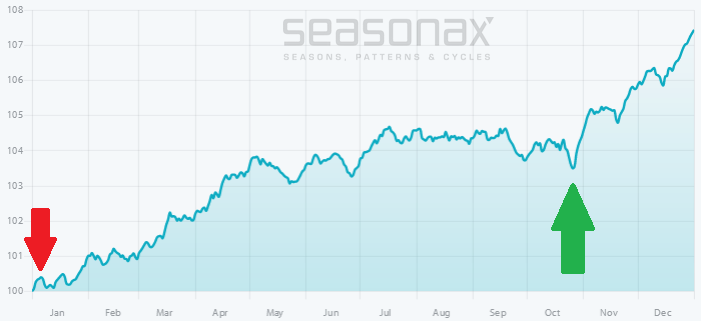
Readers are very likely aware of the “Halloween effect” or the Santa Claus rally. The former term refers to the fact that stocks on average tend to perform significantly worse in the summer months than in the winter months, the latter term describes the typically very strong advance in stocks just before the turn of the year. Both phenomena apply to the broad stock market, this is to say, to benchmark indexes such as the S&P 500 or the DJIA.
Read More »
Read More »
US Stocks – Minor Dip With Potential, Much Consternation
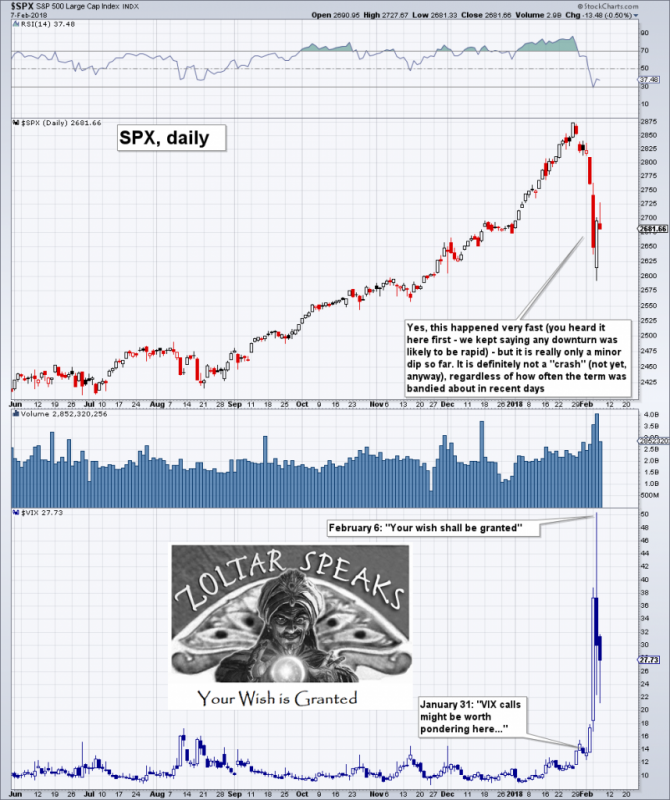
On January 31 we wrote about the unprecedented levels – for a stock market index that is – the weekly and monthly RSI of the DJIA had reached (see: “Too Much Bubble Love, Likely to Bring Regret” for the astonishing details – provided you still have some capacity for stock market-related astonishment). We will take the opportunity to toot our horn by reminding readers that we highlighted VIX calls of all things as a worthwhile tail risk play....
Read More »
Read More »
How to Buy Low When Everyone Else is Buying High
The common thread running through the collective minds of present U.S. stock market investors goes something like this: A great crash is coming. But first there will be an epic run-up climaxing with a massive parabolic blow off top. Hence, to capitalize on the final blow off, investors must let their stock market holdings ride until the precise moment the market peaks – and not a moment more. That’s when investors should sell their stocks and go to...
Read More »
Read More »
Too Much Bubble-Love, Likely to Bring Regret
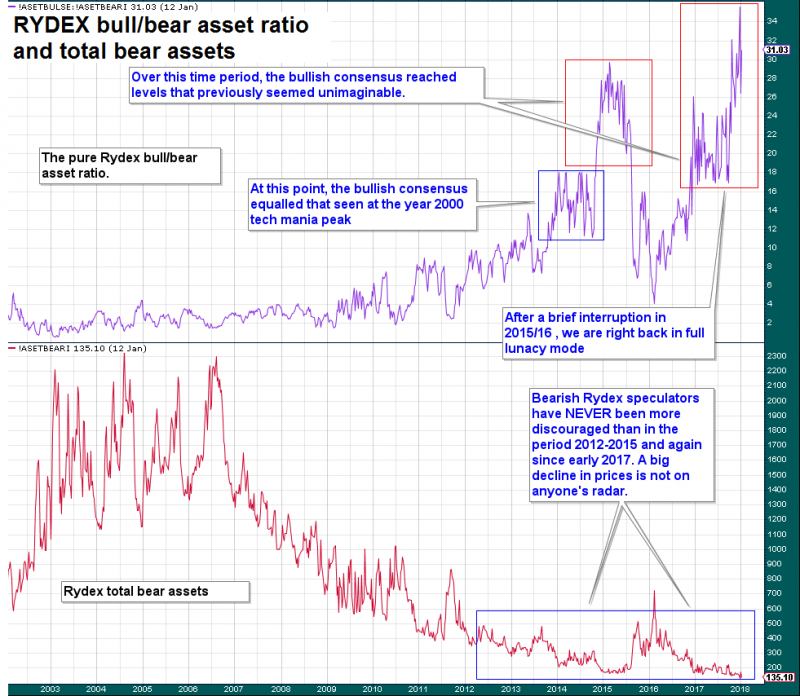
Readers may recall our recent articles on the blow-off move in the stock market, entitled Punch-Drunk Investors and Extinct Bears (see Part 1 & Part 2 for the details). Bears remained firmly extinct as of last week – in fact, some of the sentiment indicators we are keeping tabs on have become even more stretched, as incredible as that may sound. For instance, assets in bullish Rydex funds exceeded bear assets by a factor of more than 37 at one...
Read More »
Read More »
The FOMC Meeting Strategy: Why It May Be Particularly Promising Right Now
As readers know, investment and trading decisions can be optimized with the help of statistics. One way of doing so is offered by the FOMC meeting strategy. A study published by the Federal Reserve Bank of New York in 2011 examined the effect of FOMC meetings on stock prices. The study concluded that these meetings have a substantial impact on stock prices – and contrary to what most investors would probably tend to expect, before rather than after...
Read More »
Read More »
Punch-Drunk Investors & Extinct Bears, Part 2
For many years we have heard that the poor polar bears were in danger of dying out due to global warming. A fake photograph of one of the magnificent creatures drifting aimlessly in the ocean on a break-away ice floe was reproduced thousands of times all over the internet. In the meantime it has turned out that polar bears are doing so well, they are considered a quite dangerous plague in some regions in Alaska.
Read More »
Read More »
Punch-Drunk Investors & Extinct Bears, Part 1
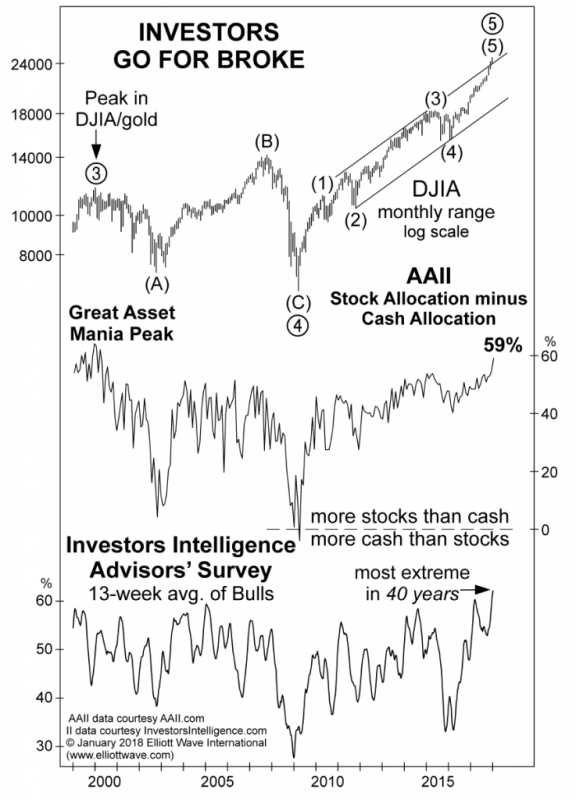
We didn’t really plan on writing about investor sentiment again so soon, but last week a few articles in the financial press caught our eye and after reviewing the data, we thought it would be a good idea to post a brief update. When positioning and sentiment reach levels that were never seen before after the market has gone through a blow-off move for more than a year, it may well be that it means something for once.
Read More »
Read More »
2018: The Weakest Year in the Presidential Election Cycle Has Begun
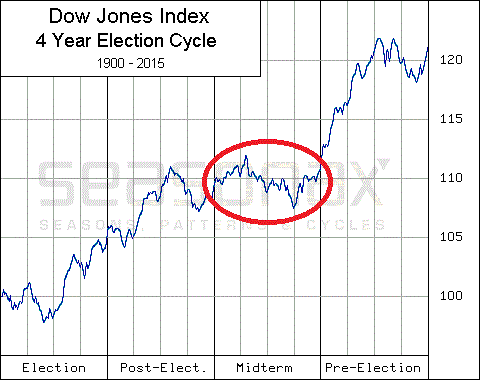
Our readers are probably aware of the influence the US election cycle has on the stock market. After Donald Trump was elected president, a particularly strong rally in stock prices ensued. Contrary to what many market participants seem to believe, trends in the stock market depend only to a negligible extent on whether a Republican or a Democrat wins the presidency.
Read More »
Read More »
Why Monetary Policy Will Cancel Out Fiscal Policy
Good cheer has arrived at precisely the perfect moment. You can really see it. Record stock prices, stout economic growth, and a GOP tax reform bill to boot. Has there ever been a more flawless week leading up to Christmas?
Read More »
Read More »


