Tag Archive: Great Graphic
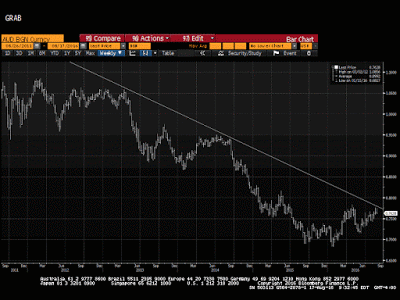
Great Graphic: Aussie Tests Three-Year Downtrend
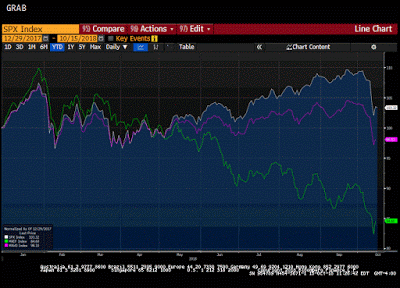
The Australian dollar's technical condition has soured. Market sentiment may be changing as the MSCI World Index of developed equities posted a key reversal yesterday. It is not clear yet whether the Aussie is correcting lower or whether there has been a trend change.
Read More »
Read More »
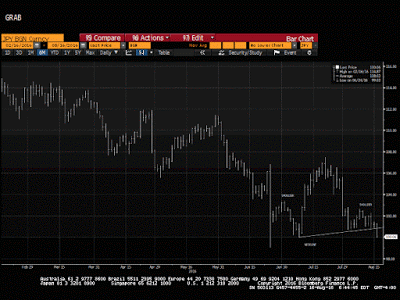
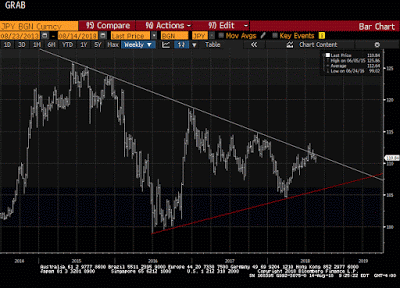
Great Graphic: Dollar-Yen–Possible Head and Shoulders Continuation Pattern
This technical pattern is most often a reversal pattern, but not always. It may be a continuation pattern in the dollar against the yen. It highlights the importance of the JPY100 level and warns of risk toward JPY92.50. It aligns well with the sequence of macro events.
Read More »
Read More »
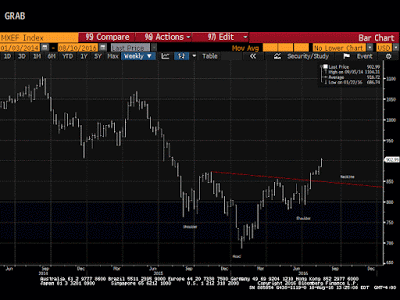
Great Graphic: Bullish Emerging Market Equity Index
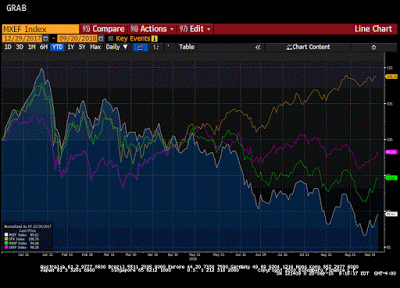
Liquidity rather than intrinsic value seems to be driving EM assets. MSCI EM equity index looks constructive technically. The chart pattern suggests scope for around 13% gains from here.
Read More »
Read More »
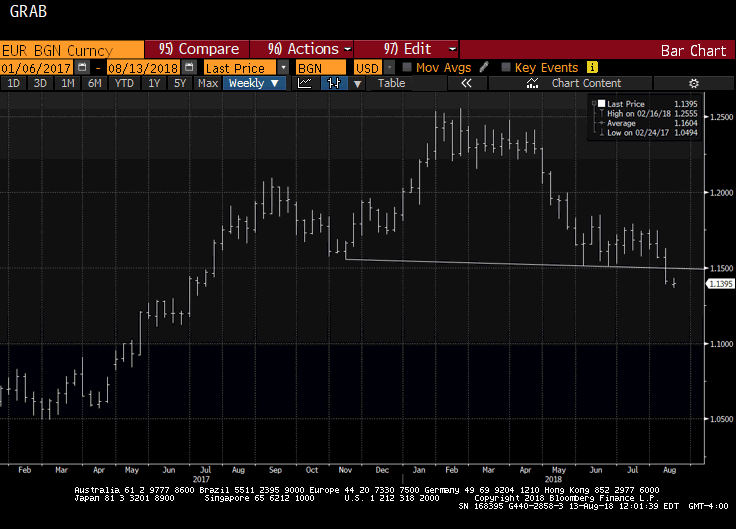
No Fines for Iberia, but Remedial Action Demanded and Possible Loss of Some ESI Funds
Spain and Portugal need to make some relatively small budget adjustments or will be denied some transfer payments. Spain's political situation is fluid, but another window of opportunity to break the logjam is at hand. The euro seems immune to these fiscal developments; some retracement objectives are in sight.
Read More »
Read More »
Great Graphic: The Decline in Durable Goods Prices
This economic graph is maybe the most important in the last decade. Service prices are rising, while goods prices have steadily fallen. The main reason for us is the possibility to outsource big parts of the durables supply-chain to China and East Asia. This is where productivity growth happens. Prices of services, however, are ever increasing. …
Read More »
Read More »
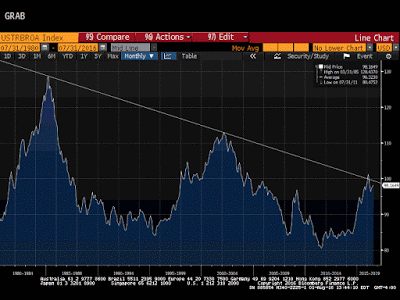
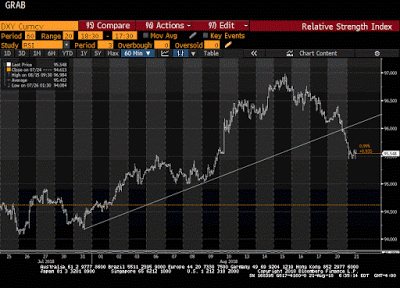
Great Graphic: Real Broad Trade-Weighted Dollar
The real broad trade-weighted dollar index rose in July for the third month. It peaked in January above trendline drawn through the Reagan and Clinton dollar rallies. Expect the trendline to be violated again before the end of the year.
Read More »
Read More »
Great Graphic: Relative Performance of Bank Stocks–US, Europe, and Japan
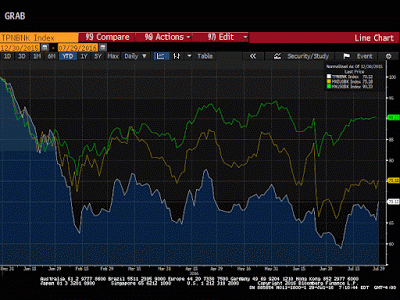
MSCI US Bank Index, MSCI European Bank Index and the Japan Topix Bank Index compared. Divergence in the health of the financial sector.
Read More »
Read More »
Great Graphic: How the US Recovery Stacks Up
The US recovery may have surpassed the 2001 recovery in Q2. Though disappointing, the recovery has been faster than average from a balance sheet crisis. Although slow, it is hard to see the secular stagnation in the data.
Read More »
Read More »
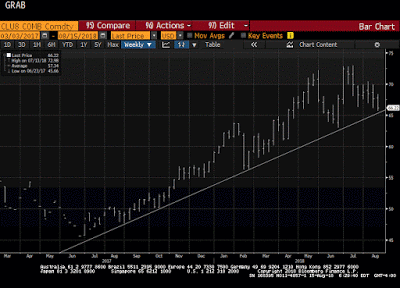
Great Graphic: OIl Breaks Down Further
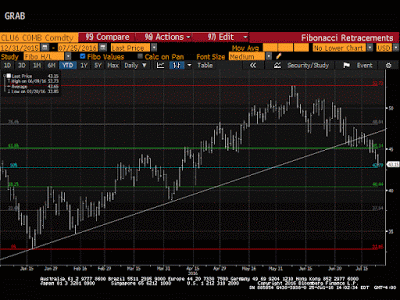
With today's losses the Sept contract has retraced 50% of this year's rally. The oil glut has partly been transformed into a gasoline glut. US rig count is rising and output has increased two weeks in a row.
Read More »
Read More »
Great Graphic: Aussie Approaches Two-Month Uptrend
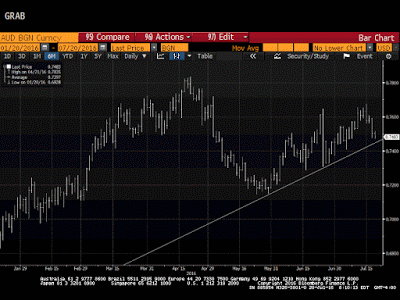
Australian dollar is the second heaviest currency this week after a key downside reversal at the end of last week. It is approaching an uptrend line near $0.7450. Many perceive an increased likelihood that the RBA eases and many are reassessing chance of a Fed hike later this year.
Read More »
Read More »
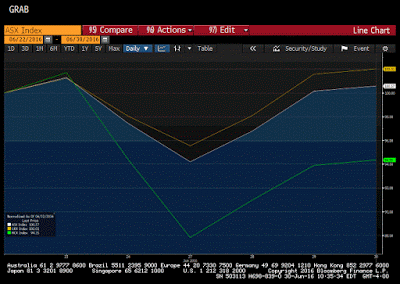
Great Graphic: Equities Since Brexit
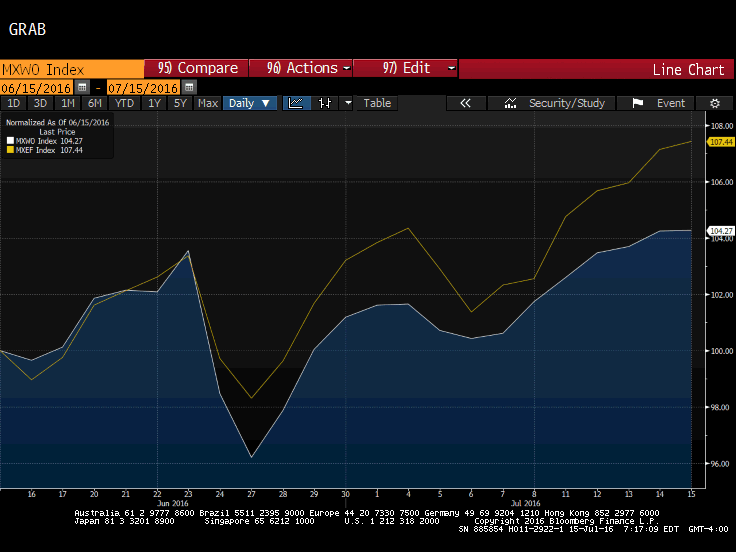
Since the UK voted to leave the EU, emerging market equities have outperformed equities from the developed markets. This Great Graphic, composed on Bloomberg, shows the MSCI Emerging Market equities (yellow line) and the MSCI World Index of developed equities (white line).
Read More »
Read More »
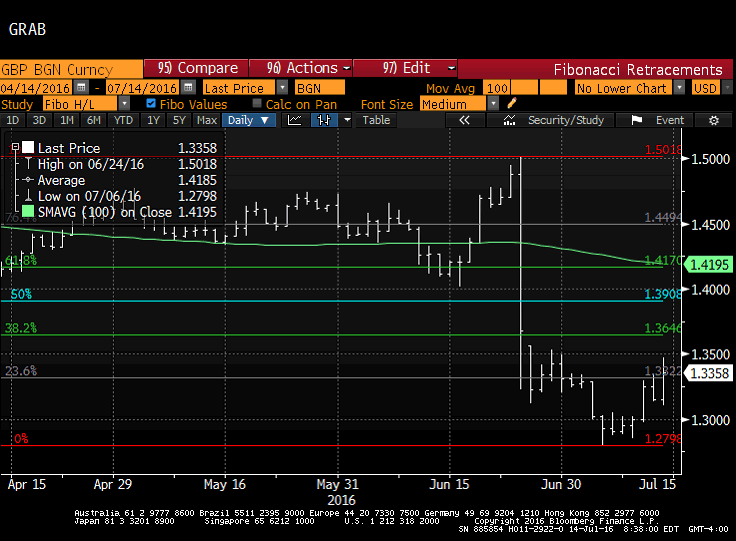
Great Graphic: If You Think Sterling has Bottomed, Where may it Go?
Many think sterling has bottomed. A number of technical factors point to potential toward $1.42. Fundamental considerations do not appear as supportive as technicals.
Read More »
Read More »
Great Graphic: The Yuan’s Weakness
Don't be fooled, the yuan has fallen more against its basket that against the dollar this year. It is not clear what China means by stable. Market forces appear to be moving in the same direction as officials wish.
Read More »
Read More »
Great Graphic: What are UK Equities Doing?
Domestic-oriented UK companies have been marked down. The outperformance by UK's global companies is a negative view of sterling. The drop in interest rates is in anticipation of a recession and easier BOE policy.
Read More »
Read More »
Great Graphic: UK Referendum–Turnout it Key
Younger age cohorts in the UK are more inclined to vote to stay in the EU than their elders. However, some suggested that this consideration is blunted by the fact that the younger people are less likely to vote.
Read More »
Read More »
Great Graphic: Age and Brexit
The betting and events markets have shifted more decisively than the polls in favor of the UK to remain in the EU. Sterling extended its rally from $1.4010 last Thursday to nearly $1.4785 today, as the market participants adjust positions. What is particular striking is that the asymmetrical perceptions of the personal impact of a … Continue...
Read More »
Read More »
Great Graphic: Oil Flirts with Four-Month Uptrend
The broader technical tone has weakened. The RSI has turned lower. The MACDs are also turning lower with a bearish divergence. The five-day moving average may move below the 20-day moving average for the first time since mid-April later this week....
Read More »
Read More »
Democratic Deficit: Is the UK Referendum the Tip of the Iceberg?
One of the most profound criticisms of the EU that it remains, even at
this late date, primarily an elite
project. The democratic deficit has grown, according to the latest
Pew Research multi-country poll.
The Pew Research sur...
Read More »
Read More »
Great Graphic: Despite Higher Oil Prices, Middle East Pegs Remain Under Pressure
With today’s gains, the price of Brent has nearly doubled from its lows in January. Of course, the price of oil is still less than half of levels that prevailed two years ago. At the same time, many leveraged investors cast a jaundiced eye toward currency pegs. Many have concluded that the Middle East currency pegs …
Read More »
Read More »
Great Graphic: Brexit Risks Rise
Brexit Predict This Great Graphic shows the price people are willing to pay to bet that the UK votes to leave the EU at the June 23 referendum on the PredictIt events markets. We included the lower chart to give some sense of volume of activity on this wager in this event market. Presently, one … Continue reading »
Read More »
Read More »


