| To be sure, the Dollar Index is not the dollar. It is not even a trade-weighted measure of the dollar. Two of America’s largest trading partners, China and Mexico, are not represented. It is heavily weighted to the euro and currencies that move in its orbit, like the Swiss franc Swedish krona, and arguably the British pound.
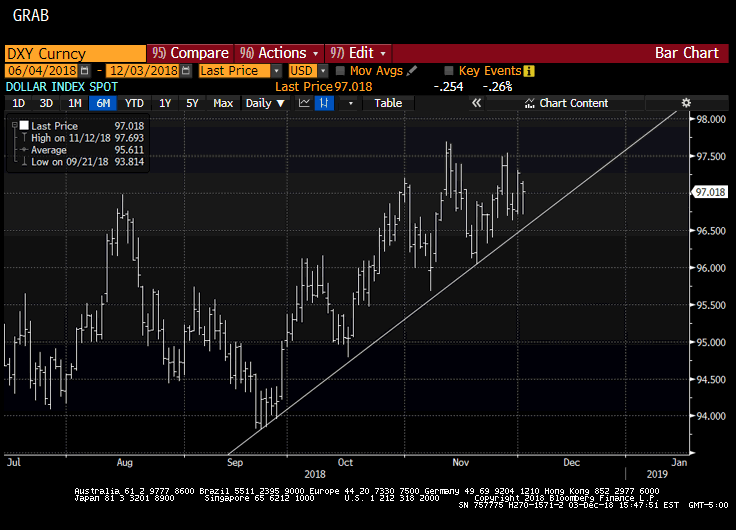
It is primarily a speculative vehicle. Very few investors or businesses have exposure that mirrors the basket. Because it is an index is often appears to trend better than the individual components and therefore may lend itself to trend following strategies. As the Great Graphic here shows, the Dollar Index has been trending higher since late September. |
Dollar Index |
By definition, the trend line is forged from setbacks in the Dollar Index’s advance. The trend line may have frayed on an intraday basis but remains intact nonetheless. A dramatic drop in equities, a selloff in oil, heightened trade tensions, a pause in the escalation, did not break the greenback’s advance. It has also survived both a hawkish read of the Fed in early October and a dovish one in late November.
The trend line comes in near 96.65 on December 4 and 96.80 at the end of the week. Today’s stronger than expected December ISM report, driven it appears primarily by rising new domestic orders (new orders rose to 62.1 from 57.4 and export orders were flat) suggest that US growth may have rebounded after a soft October. Moreover, between the surge in Japan’s industrial output reported last week, the upward revision in German and French manufacturing PMI, and slightly better than expected Chinese Caixin manufacturing PMI, maybe the doom and gloom that had crept into the markets (maybe to explain a downdraft in equities) may have been exaggerated.
The prices paid component of the ISM tumbled to 60.7 from 71.6. Do not expect this to steady the Fed’s hand. As long as growth remains above trend, and the target rate of Fed funds is below the 3.0%, where six of the fifteen Fed officials thought was neutral in September, the gradual hikes should be expected.
Tags: #USD,Great Graphic,newsletter


