


Marc Chandler
My articles My offerMy siteAbout meMy videosMy books
Follow on:LinkedINTwitterSeeking AlphaAmazon
| The decline in the global equity market is the most serious since the February and March spill. In this Great Graphic, the white line is the S&P 500. With the setback, it is up a little more than 8% for the year. It managed to recover fully from the sell-off earlier in the year.
The fuchsia line is the MSCI World Index of developed countries. It is up 1.25% year-to-date, and it never managed to take out the high set earlier this year. This primarily reflects the underperformance of Europe. The green line in the MSCI Emerging Markets. It is off about 13% this year and has trended lower since Q1. As the chart show, the real underperformance of emerging markets and outperformance of the S&P 500 began late in Q2. It is too early to tell if the recent slide will produce new convergence. Some argue that US rates breached some threshold for equity investors, but we are not convinced this is the case. A rise in rates has been widely expected and did not prevent the S&P 500 from setting record highs on September 21, when the 10-year note yield closed above 3.05%. The S&P 500 was still near record highs on October 3, when the 10-year yield was at 3.18%. |
Global Equity Markets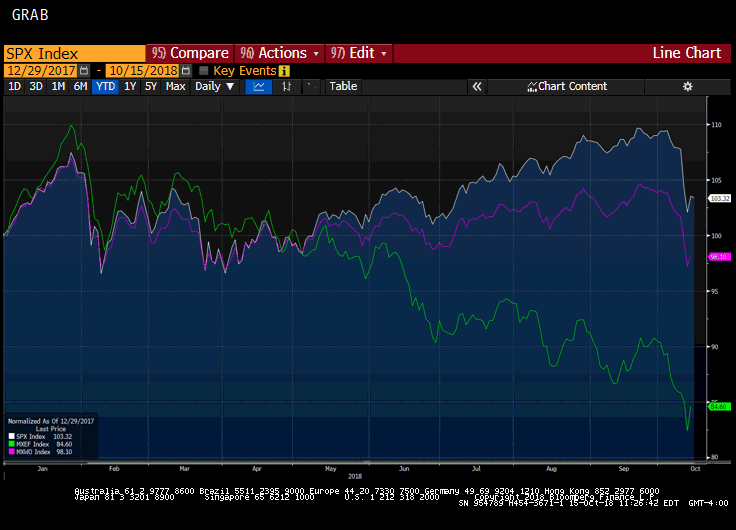 - Click to enlarge |
The MSCI Emerging Market Equity Index can bounce. It seems to be a pattern of making new lows and then staging a recovery, perhaps on short-covering, before heading south again. One day a trend does not make. It is difficult for many to turn positive on EM unless there is a shift in the dynamics. Valuation measures alone are not sufficient.
Europe has at least three pressing vulnerabilities. Italy’s fiscal policy, Brexit, and loss of economic momentum. None can be resolved immediately, ECB President Draghi’s optimistic economic assessment is predicated on the strength of the labor market. Investors are likely to be particularly sensitive to disappointing readings. As noted before, the political leadership in Europe is weak, and CSU loss of its majority in Bavaria yesterday is a reflection of the political flux and potential realignment taking place.
Full story here Are you the author?Tags: equities,Great Graphic,newsletter


