| The softer than expected PCE deflator today plays into the dovish market mood. There may be little that can resist it until next Friday’s employment data, which should be another robust report with hourly earnings holding above 3% year-over-year. Last November, average hourly earnings rose by 0.3%. As this drops out of the year-over-year comparison, even a healthy bounce back from the 0.2% drop skewed by the hurricane will be needed just to hold the rate at 3.1%.
Weekly jobless claims report is the closest to real-time economic the government reports. The jobless claims during the week in which the non-farm payroll survey is conducted as a few thousand higher than in October, but it is not inconsistent with non-farm payroll growth of 180k-190k. Weekly jobless claims have risen though for three consecutive weeks. The four-week moving average, used to smooth the volatility, is at its highest level since July. The streak is the longest in over a year. One would expect the stock market to go in the opposite direction of weekly jobless claims. By definition, when the economy is strong labor is being absorbed, and consumption rises. Rising corporate earnings and profit help provide the fuel for equity market gains. |
S&P and Weekly Jobless Claims |
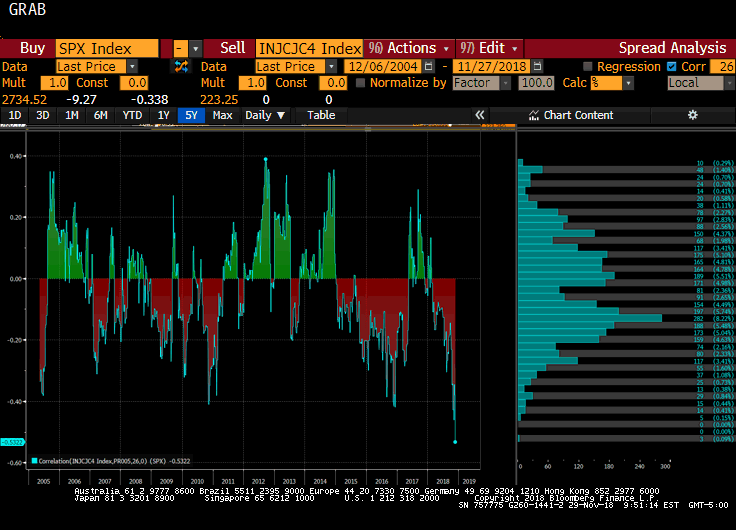
The Great Graphic here shows the 26-week rolling correlation of the percent change of the S&P 500 and weekly initial jobless claims. The current inverse correlation (~-0.54) is the most extreme since the late 1990s. The blue bar chart to the right shows the distribution of the correlation. This is a tail event. If the inversion is to be reduced, the two must move in the same direction. I have a constructive outlook for the S&P 500, but also recognize that the weekly jobless claims have been skewed by weather and the Thanksgiving holiday. That said, weekly jobless claims bottomed in mid-September and that could mark the cyclical low.
Weekly jobless claims are included in the Conference Board’s Leading Economic Indicator, which rose by 0.1% last month, matching the year’s low. Last year’s low was set in September at zero. The low in 2016 was -0.3 in January. In October, three of the ten leading indicators were negative–jobless claims, building permits, and equity prices.
Full story here Are you the author? Previous post See more for Next post
Tags: Great Graphic,jobs,newsletter,SPX


