Marc Chandler
My articles My offerMy siteAbout meMy videosMy books
Follow on:LinkedINTwitterSeeking AlphaAmazon
George Dorgan
My articles My siteAbout meMy videosMy books
Follow on:LinkedINTwitterSeeking Alpha
CFA SocietyEconomicBlogs
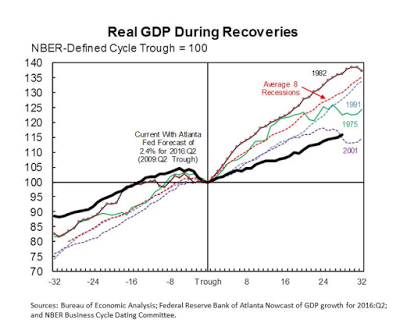
Summary:
The US recovery may have surpassed the 2001 recovery in Q2.
Though disappointing, the recovery has been faster than average from a balance sheet crisis.
Although slow, it is hard to see the secular stagnation in the data.
|
This Great Graphic was tweeted Alan Kruger (@Alan_Kruger). Drawing on official data and the Atlanta Fed’s GDP Now tracker for Q2 GDP (2.4%), it shows the current business cycle in the context of a four earlier cycles.
Until now the recovery from the Great Financial Crisis was the weakest from the post-WWII last four contractions. However, as Kruger points out assuming that the Atlanta Fed’s GDP tracker is accurate, this dour assessment will not longer hold. It will surpass the recovery from the end of the tech bubble at the start of the century.
Even so, the recovery in many respects remains unimpressive. Nevertheless, it is notable in what it says about the two main competing explanations for the lackluster growth. One camp argues that as financial crisis (balance sheet crisis), it takes longer to recover than from a traditional end of a business cycle. However, the from that perspective, the US economy has recovered faster than anticipated. When the history of this period is written, the early and aggressive action by the Federal Reserve (with the Treasury Department) was a big reason why a Great Depression was avoided.
The other camp argues that the lackluster recovery is due to secular stagnation. Insufficient aggregate demand has become the normal condition. Serial bubbles have hidden it. However, when looking at that chart, it is difficult to say the US economy is stagnating. The US economy has never been bigger. It may be growing slowly, and some of the headwinds, like the less supportive demographics, will be with us for some time, but stagnation is not a fair description of the heavy black line on the chart. Part of the problem is productivity growth has slowed, and economists, let alone policymakers, do not fully understand the causes.
|
 The US recovery may have surpassed the 2001 recovery in Q2. Though disappointing, the recovery has been faster than average from a balance sheet crisis. Although slow, it is hard to see the secular stagnation in the data. - Click to enlarge |
He has been covering the global capital markets in one fashion or another for more than 30 years, working at economic consulting firms and global investment banks. After 14 years as the global head of currency strategy for Brown Brothers Harriman, Chandler joined Bannockburn Global Forex, as a managing partner and chief markets strategist as of October 1, 2018.
Tags: GDP,Great Graphic,newslettersent,US