Previous post Next post

Great Graphic: The Decline in Durable Goods Prices

This economic graph is maybe the most important in the last decade.  Service prices are rising, while goods prices have steadily fallen. The main reason for us is the possibility to outsource big parts of the durables supply-chain to China and East Asia. This is where productivity growth happens. Prices of services, however, are ever increasing.

Marc Chandler writes about the increasing prices of services:


The rust line is service prices.  They are steadily increasing.  No deflation or disinflation here.  Think about rent, medical services, education, and entertainment.

The three blue lines are different measures of goods prices.  The dark blue line is total goods prices.  They have been leveling off.  The reason lies with the top blue line, which is non-durable good prices.

The bottom blue line is durable good prices.  Deflationary forces have not been arrested.  This is an important development.  It may help explain some (but not all) of the weakness in investment.  Capital equipment is a subset of durable goods, the price of which has fallen around 10% over the past seven years.

Observers easily recognize how investment can be labor saving.  Replace the teller with an ATM.   The toll collector can be replaced by some sort of electronic billing (e.g. EZ Pass).  However, investment is often capital saving as well.  A business buys a machine tool for $100k.  It is depreciated (read tax break) over ten years.  Now it is time to replace the machine tool.  The new tool may be both cheaper in price and more efficient in capability.

Replacement capital carries with it technological advances and at a reduced cost.    Net new investment, which is investment minus depreciation may be in a secular declining trend as Harold Vatter warned 35 years ago and well before Hansen’s “secular stagnation” theory was revived by Summers.

The decline in goods prices relative to service prices may also impact how the different sectors are measured.  Although the chart is of US prices, other countries prices are broadly similar.  Disinflation if not deflation is evident in goods prices, while service price are rising.  This price development in China may be exaggerating the shift taking place between the two sectors.

Price Indexes for Personal Consumption Expenditures on Goods and Services

Click to enlarge.

What Chandler omits is that rents and the housing boom are the biggest driver of the rising prices in services.
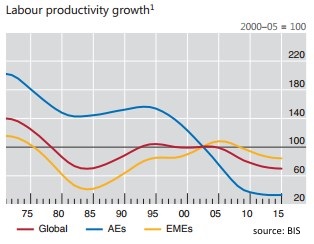
Productivity Growth only in Asia

The second piece of economic data is that productivity growth that only happens in the Emerging Markets, in Asia in particular. The graph from the Bank of International Settlement shows that

  1. We had strong productivity growth in the years between 2000 and 2005. A big part of it,  thanks to the housing booms that increased GDP and therefore productivity.
  2. Nowadays strong productivity growth is only visible in Asia.
  3. The “services economy” in Advanced economies (AE) does not help much to improve productivity.
 Labor Productivity Global Emerging Markets


Full story here Are you the author?
George Dorgan
George Dorgan (penname) predicted the end of the EUR/CHF peg at the CFA Society and at many occasions on SeekingAlpha.com and on this blog. Several Swiss and international financial advisors support the site. These firms aim to deliver independent advice from the often misleading mainstream of banks and asset managers. George is FinTech entrepreneur, financial author and alternative economist. He speak seven languages fluently.
Previous post See more for 4) FX Trends Next post
Tags: ,,,,

Permanent link to this article: https://snbchf.com/2016/08/chandler-graphic-durable-goods-prices/

Leave a Reply

Your email address will not be published.

You may use these HTML tags and attributes: <a href="" title=""> <abbr title=""> <acronym title=""> <b> <blockquote cite=""> <cite> <code> <del datetime=""> <em> <i> <q cite=""> <s> <strike> <strong>

This site uses Akismet to reduce spam. Learn how your comment data is processed.