


Marc Chandler
My articles My offerMy siteAbout meMy videosMy books
Follow on:LinkedINTwitterSeeking AlphaAmazon
| Boosted by tax reform, deregulation, and strong earnings growth, US equities have motored ahead, leaving other benchmarks far behind. As the Great Graphic here shows, most of the other benchmarks are lower on the year. The S&P 500 (yellow line) is up 8.8% for the year before the new record highs seeing seen now, while the Dow Jones Stoxx 600 from Europe (purple line) is still off 1.7%. The MSCI Asia Pacific Index (green line) is off 5.3% this year, and the MSCI Emerging Markets Index is off 10.4%.
As the chart shows, over the last couple of weeks, the non-US benchmarks have been doing better. Reports tracking the flow of funds also generally confirm savings flowing into the underperforming markets. There is talk that a larger portfolio shift is taking place ahead of the end of Q3 on valuation grounds. At the same time, many see the rising US yields as a headwind on US equities. While this may sound right intuitively, something is amiss. Consider that over the past 30 days, the S&P 500 and 10-year US yields correlation on levels (direction) is about 0.57, and over the past 600 days, the correlation is 0.44. Stocks and interest rates could be correlated with a third factor, such as economic growth. There are one or two exceptions a year, but since the Great Financial Crisis, the correlation has generally been positive. |
Equities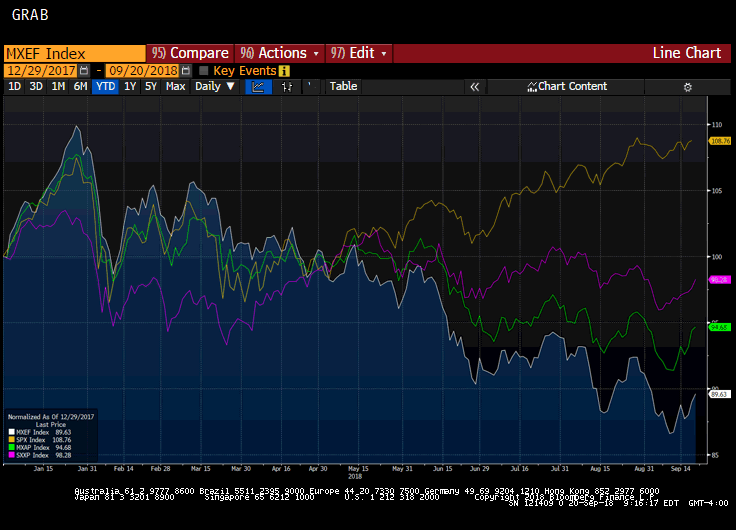 - Click to enlarge |
If portfolio rebalancing were taking it would likely weigh on the dollar. Given that foreign exchange typically accounts for a smaller part of the total return of an equity portfolio than international bonds, equity fund managers often do not hedge the currency exposure.
Rebalancing would also suggest that the worst performers are among the strongest now. That is the case in the foreign exchange market. Year-to-date, the weakest of the majors, has been the Australian dollar (-9.25%), the New Zealand dollar (-9.20%), and the Swedish krona (-8.75%). The strongest major currency has been the Swedish krona (2.0%) followed by the New Zealand dollar (1.65%). The Australian dollar (1.30%) has been pushed to fourth place behind sterling (1.45%), which is being aided by stronger than expected retail sales.
If this re-balancing hypothesis is correct, it needs to simply run its course. While a Fed hike next week is a done deal as far as investors are concerned, but remember that the move of the median forecast in June to two hikes in H2 18 reflected the change of one member. The Fed’s current forecasts show the median sees three rate hikes as appropriate. The January 2020 Fed funds futures imply a rate of 2.885%. It has risen 22 bp since the employment data earlier this month. The current effective rate is 1.92%.
Full story here Are you the author?Tags: #USD,$TLT,Great Graphic,newsletter,SPY


