Previous post Next post

Great Graphic: Relative Performance of Bank Stocks–US, Europe, and Japan

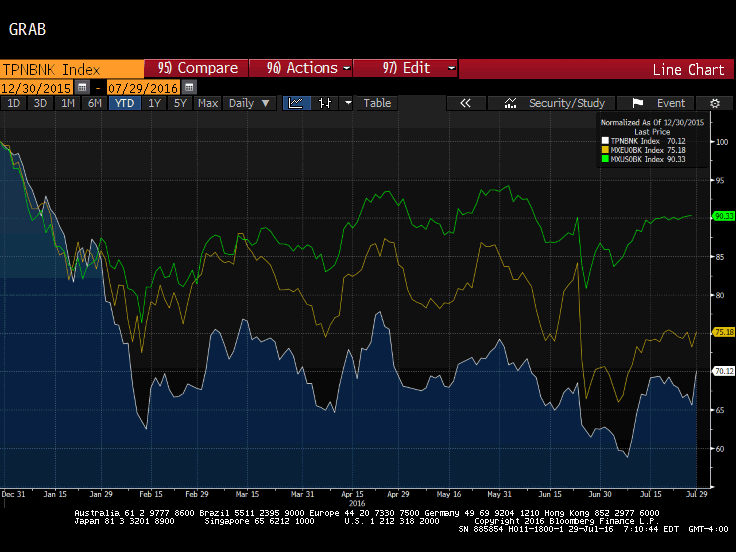
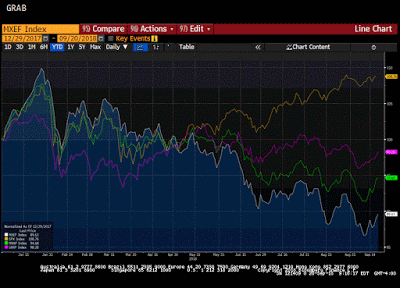
This Great Graphic was composed on Bloomberg, and it shows the performance of bank share indices of the major bourses.  The time series are indexed to 100 at the start of this year.
The green line, which is off about 6.6% this year is the MSCI US bank index.   The yellow line is the MSCI European bank index. It is off 25% this year.   The white line is the Topix bank shares.  It is fallen 30% this year, even with today’s sharp gains.
Our constructive outlook for the US dollar is predicated on divergence, and we often discuss the divergence of monetary policy.  However, the divergence in the health of the financial sector, and the negative interest rates, is another dimension of our meme which is also important.

banks

Green: MSCI US Bank Index, Yellow: MSCI European Bank Index, White: Topix Bank Index


Full story here Are you the author?
Marc Chandler
He has been covering the global capital markets in one fashion or another for more than 30 years, working at economic consulting firms and global investment banks. After 14 years as the global head of currency strategy for Brown Brothers Harriman, Chandler joined Bannockburn Global Forex, as a managing partner and chief markets strategist as of October 1, 2018.
Previous post See more for 4.) Marc to Market Next post
Tags: ,

Permanent link to this article: https://snbchf.com/2016/07/chandler-bank-stocks-europe-japan/

Leave a Reply

Your email address will not be published.

You may use these HTML tags and attributes: <a href="" title=""> <abbr title=""> <acronym title=""> <b> <blockquote cite=""> <cite> <code> <del datetime=""> <em> <i> <q cite=""> <s> <strike> <strong>

This site uses Akismet to reduce spam. Learn how your comment data is processed.