Tag Archive: Chart Update
Global Turn-of-the-Month Effect – An Update
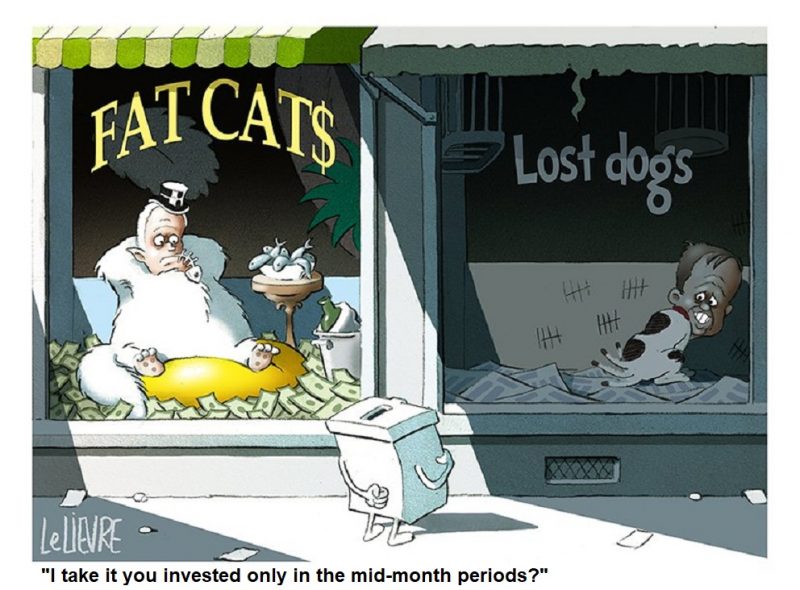
The “turn-of-the-month” effect is one of the most fascinating stock market phenomena. It describes the fact that price gains primarily tend to occur around the turn of the month. By contrast, the rest of the time around the middle of the month is typically far less profitable for investors. The effect has been studied extensively in the US market. In the last issue of Seasonal Insights I have shown a table detailing the extent of the...
Read More »
Read More »
How to Get Ahead in Today’s Economy
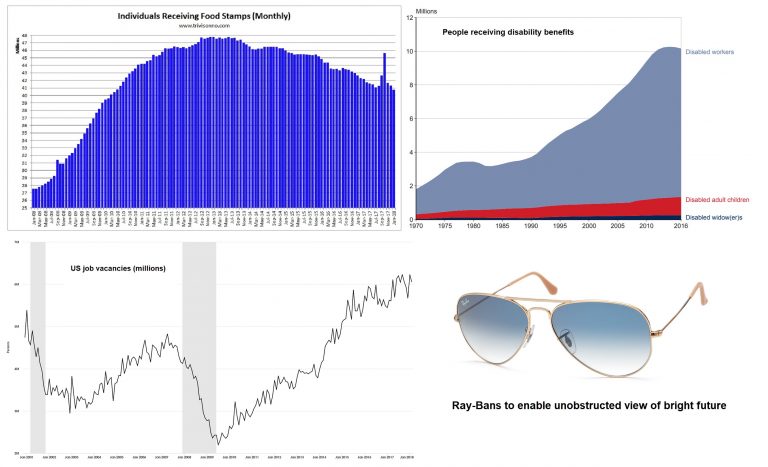
This week brought forward more evidence that we are living in a fabricated world. The popular story-line presents a world of pure awesomeness. The common experience, however, falls grossly short. On Tuesday, for example, the Labor Department reported there were a record 6.6 million job openings in March. Based on the Labor Department’s data, there were enough jobs available – exactly – for the 6.6 million Americans who were actively looking for a...
Read More »
Read More »
US Money Supply Growth Jumps in March , Bank Credit Growth Stalls
There was a sizable increase in the year-on-year growth rate of the true US money supply TMS-2 between February and March. Note that you would not notice this when looking at the official broad monetary aggregate M2, because the component of TMS-2 responsible for the jump is not included in M2. Let us begin by looking at a chart of the TMS-2 growth rate and its 12-month moving average.
Read More »
Read More »
US Stock Market: Happy Days Are Here Again? Not so Fast…
Obviously, assorted crash analogs have by now gone out of the window – we already noted that the market was late if it was to continue to mimic them, as the decline would have had to accelerate in the last week of March to remain in compliance with the “official time table”. Of course crashes are always very low probability events – but there are occasions when they have a higher probability than otherwise, and we will certainly point those out...
Read More »
Read More »
GBEB Death Watch
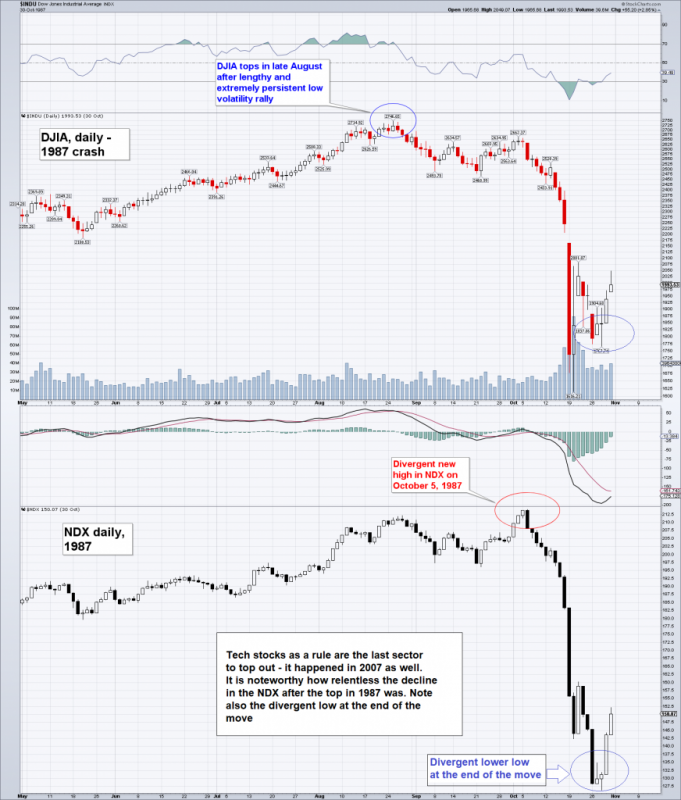
As our friend Dimitri Speck noted in his recent update, the chart pattern of the SPX continues to follow famous crash antecedents quite closely, but obviously not precisely. In particular, the decisive trendline break was rejected for the moment. If the market were to follow the 1987 analog with precision, it would already have crashed this week.
Read More »
Read More »
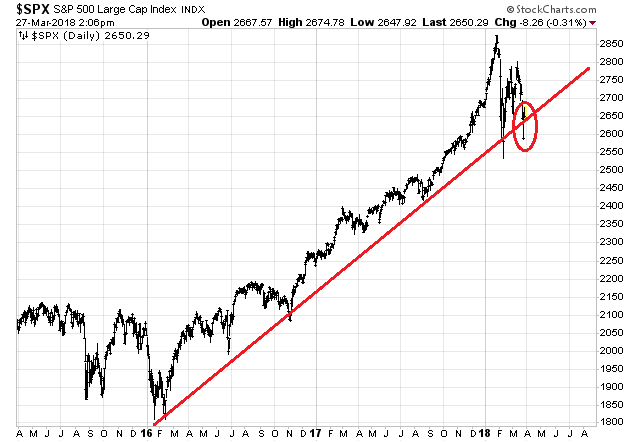
Trendline Broken: Similarities to 1929, 1987 and the Nikkei in 1990 Continue
In an article published in these pages in early March, I have discussed the similarities between the current chart pattern in the S&P 500 Index compared to the patterns that formed ahead of the crashes of 1929 and 1987, as well as the crash-like plunge in the Nikkei 225 Index in 1990. The following five similarities were decisive features of these crash patterns.
Read More »
Read More »
US Stock Market – How Bad Can It Get?
In view of the fact that the stock market action has gotten a bit out of hand again this week, we are providing a brief update of charts we have discussed in these pages over the past few weeks (see e.g. “The Flight to Fantasy”). We are doing this mainly because the probability that a low probability event will actually happen has increased somewhat in recent days.
Read More »
Read More »
Stock and Bond Markets – The Augustine of Hippo Plea
Most fund managers are in an unenviable situation nowadays (particularly if they have a long only mandate). On the one hand, they would love to get an opportunity to buy assets at reasonable prices. On the other hand, should asset prices actually return to levels that could be remotely termed “reasonable”, they would be saddled with staggering losses from their existing exposure. Or more precisely: their investors would be saddled with staggering...
Read More »
Read More »
Strange Economic Data
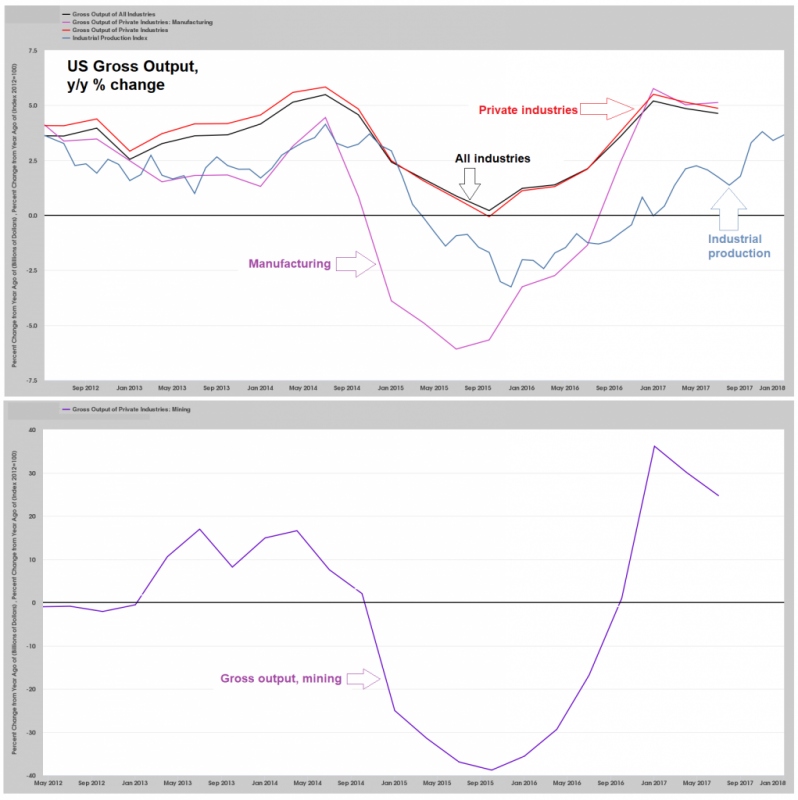
Contrary to the situation in 2014-2015, economic indicators are currently far from signaling an imminent recession. We frequently discussed growing weakness in the manufacturing sector in 2015 (which is the largest sector of the economy in terms of gross output) – but even then, we always stressed that no clear recession signal was in sight yet. US gross output (GO) growth year-on-year, and industrial production (IP) – note that GO continues to be...
Read More »
Read More »
US Stocks – Minor Dip With Potential, Much Consternation
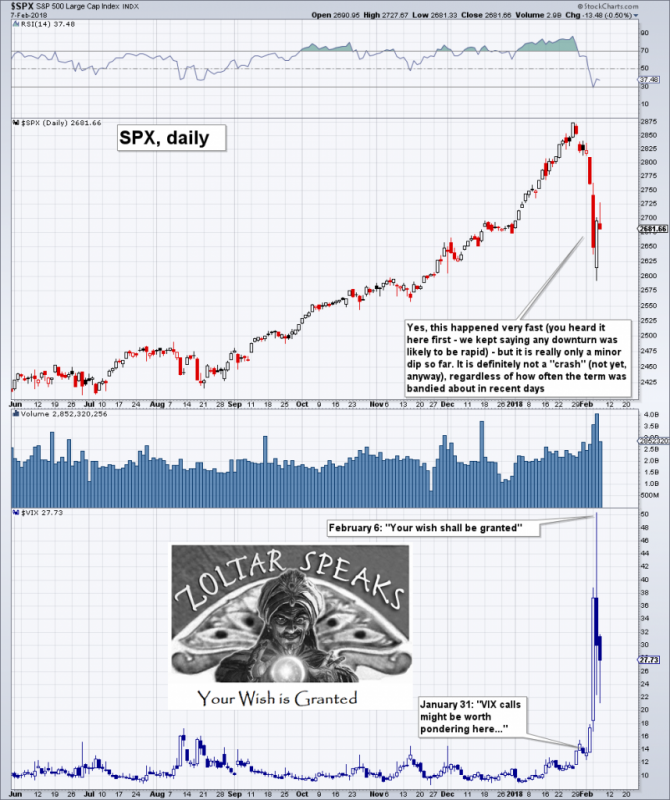
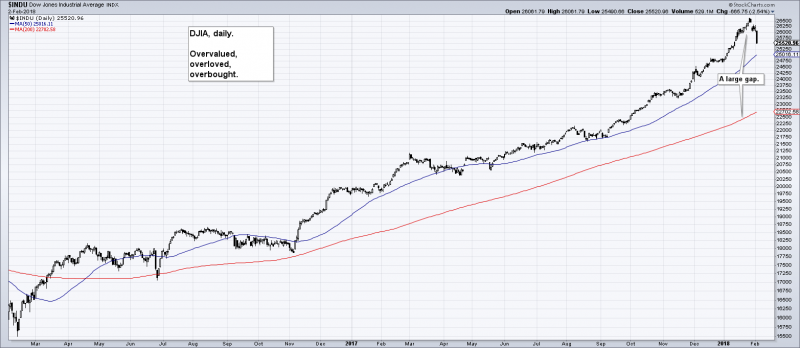
On January 31 we wrote about the unprecedented levels – for a stock market index that is – the weekly and monthly RSI of the DJIA had reached (see: “Too Much Bubble Love, Likely to Bring Regret” for the astonishing details – provided you still have some capacity for stock market-related astonishment). We will take the opportunity to toot our horn by reminding readers that we highlighted VIX calls of all things as a worthwhile tail risk play....
Read More »
Read More »
How to Buy Low When Everyone Else is Buying High
The common thread running through the collective minds of present U.S. stock market investors goes something like this: A great crash is coming. But first there will be an epic run-up climaxing with a massive parabolic blow off top. Hence, to capitalize on the final blow off, investors must let their stock market holdings ride until the precise moment the market peaks – and not a moment more. That’s when investors should sell their stocks and go to...
Read More »
Read More »


