


Jeffrey P. Snider
My articles My offerMy siteAbout meMy videosMy books
Follow on:LinkedINTwitterSeeking Alpha
| On the vital matter of missing symmetry, consumer price indices across the world keep suggesting there remains none. Recoveries were called “V” shaped for a reason. Any economy knocked down would be as intense in getting back up, normal cyclical forces creating momentum for that to (only) happen.
In the context of the past three years, symmetry is still nowhere to be found. It’s confounding even central bankers who up until all this have been especially immune to contrary evidence. The unemployment rate tells them what they want, so everything else be damned. |
US Consumer Price Index, Jan 2016 - Oct 2017(see more posts on U.S. Consumer Price Index, )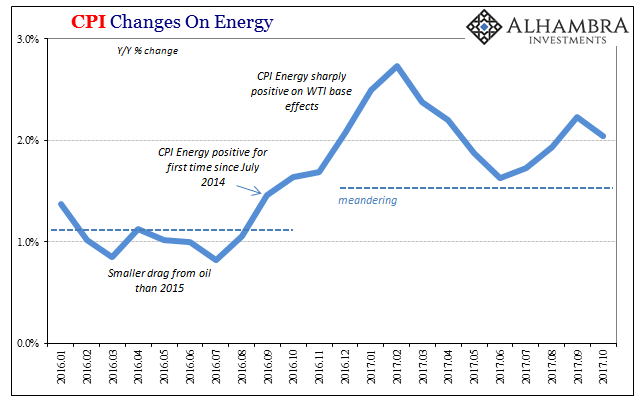 - Click to enlarge |
| The US CPI in October 2017 rose 2.04% above the index for October 2016. That’s a slight deceleration from 2.23% inflation in September, despite another energy price boost. |
US Consumer Price Index, Jan 1995 - 2017(see more posts on U.S. Consumer Price Index, )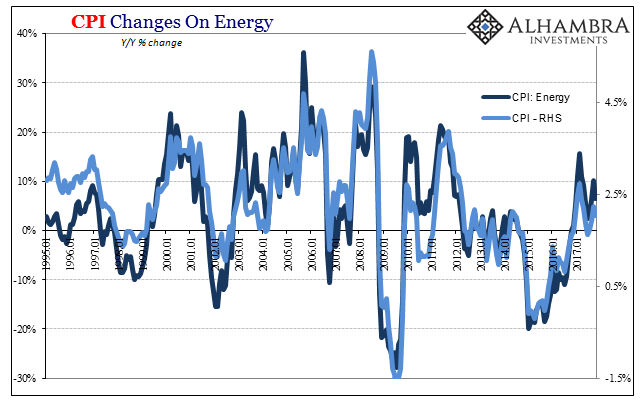 - Click to enlarge |
| That level of increase continues to be about 2/3 of the Fed’s explicit, official inflation target. Since the central bank uses instead the PCE Deflator as its standard for measuring and evaluating consumer price changes, a ~3% CPI calibrates (approximately) to a ~2% PCE Deflator (when inflation peaked in July 2008 the CPI was at 6%, the PCE Deflator 4%; earlier this year, the former registered 2.74% at the peak in February compared to 2.18% for the latter). |
U.S. Consumer Price Index, Jan 1990 - 2017(see more posts on U.S. Consumer Price Index, )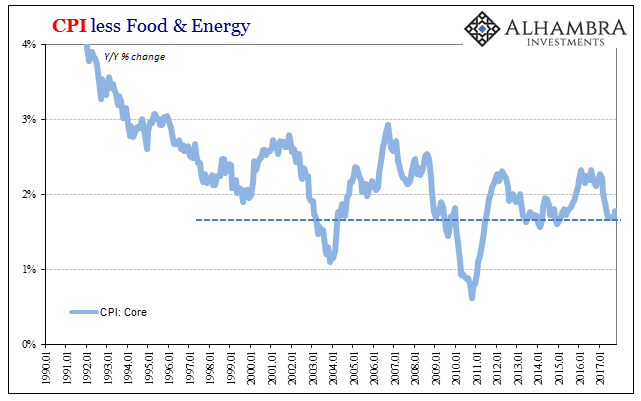 - Click to enlarge |
| While energy price differences in any given month are largely responsible for the headlines, underneath there is still nothing that would suggest five and half years of price misbehavior is close to ending. The core parts of the index, including Services less Rent, show no signs of economic acceleration or any kind of monetary flow-through from trillions in QE that stopped years ago. |
US Consumer Price Index, Jan 1990 - 2017(see more posts on U.S. Consumer Price Index, )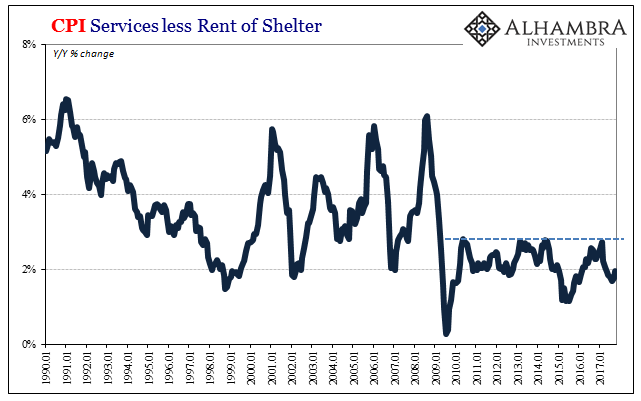 - Click to enlarge |
| If it was going to happen it would have by now. That’s why the “transitory” excuses are growing thin even for those on the inside. |
US Retail Sales, Jan 2014 - 2017(see more posts on U.S. Retail Sales, )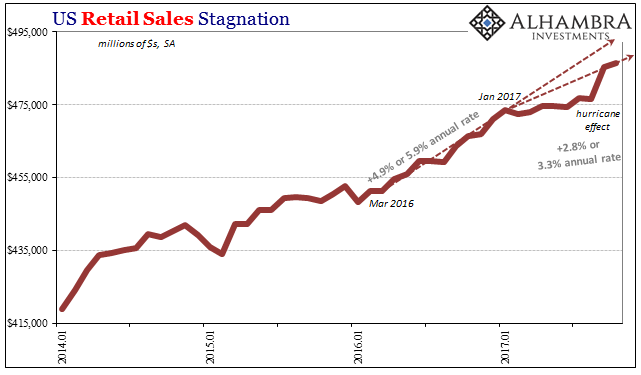 - Click to enlarge |
| This year has been a huge economic disappointment given what was expected, a result all-too-consistent with the inflation situation deviating for so long from what it “should be.” |
US Retail Sales, Jan 1992 - 2017(see more posts on U.S. Retail Sales, )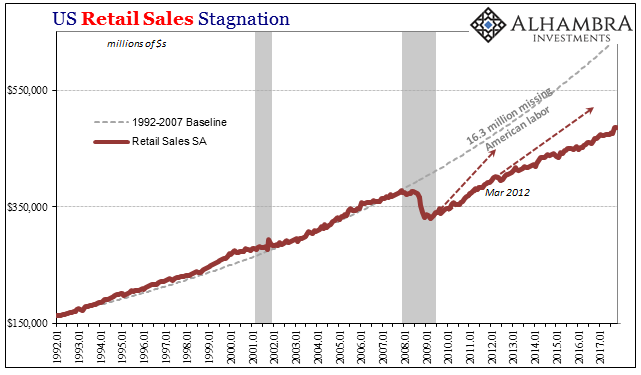 - Click to enlarge |
|
The public is catching on to the myth. Inflation expectations in markets as well as surveys (just not those of professional forecasters; i.e., other Economists) have declined. |
University of Michigan Surveys of Consumers, Jan 1990 - 2017(see more posts on University Of Michigan, )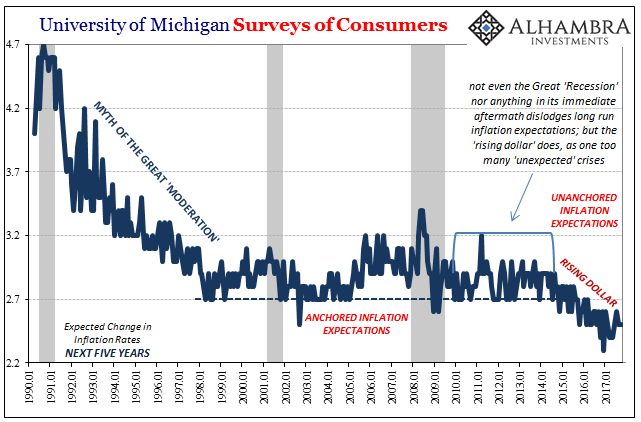 - Click to enlarge |
| Expectations mark the level of belief in what the Fed is doing, or really can do. Sustained underperformance has called into question the essentials of these basic economic operations. |
University of Michigan Surveys of Consumers, Jan 1990 - 2017(see more posts on University Of Michigan, )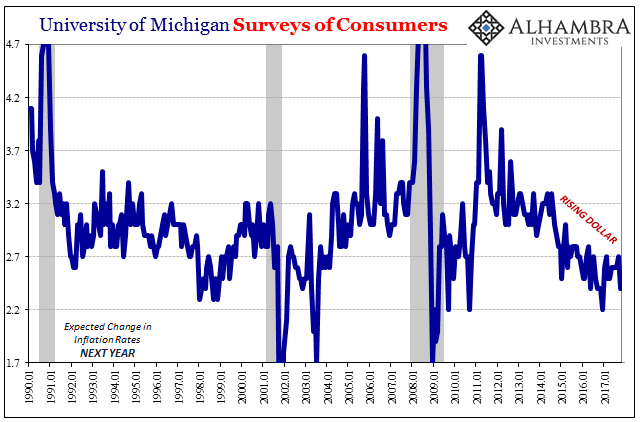 - Click to enlarge |
| The public by and large just doesn’t believe the central bank can create a sustainable, low-inflation paradigm anymore. And why should it? The last ten years have been atrocious, and still central bankers were given the benefit of the doubt for long time – maybe policymakers just needed more time to figure out the exact combination of whatever it is they do.
The “rising dollar” and the downturn it produced, however, was a wakeup call – not the least of which because policymakers kept reassuring everyone there was no downturn coming, even going so far as to “raise rates” during the middle of it! That gave every reasonable suspicion more evidence that time wasn’t the missing factor, it was what the Fed does and for once questioning how that might just be totally ineffective. For many, this is hard to believe. Yet, if you actually study the history of monetary policy in the US and around the world it has been no secret that they haven’t been really sure about these things, either. They were for decades just winging it:
That’s what’s so devastating to the Fed’s credibility about especially the past three years. The crisis starting in 2007 was a situation where they were finally asked to put up or shut up, to show what they could do when the chips were down and the world badly needed the expertise they had claimed all that time. They took their best shots, repeatedly, giving us QE’s and ZIRP, establishing instead only negative impressions and more, not fewer, questions. In other words, it’s not that the Fed made a mistake about the last few years, or even the last ten. They really don’t know what they are doing because they never did. I wrote at the outset of 2017 that inflation was what would ultimately matter this year. The reason was because it was the one thing central banks couldn’t any longer hide from. They could blame the overall economy on productivity and heroin, but inflation is a monetary derivative. If you do $3.5 trillion in balance sheet expansion there better be some detectable result in consumer prices at some point. When there wasn’t in 2015, the word “transitory” was applied to excuse failure yet again; and again in 2016; and again in 2017. |
PCE Chain-type Price Index, Jan 2004 - 2017(see more posts on PCE, )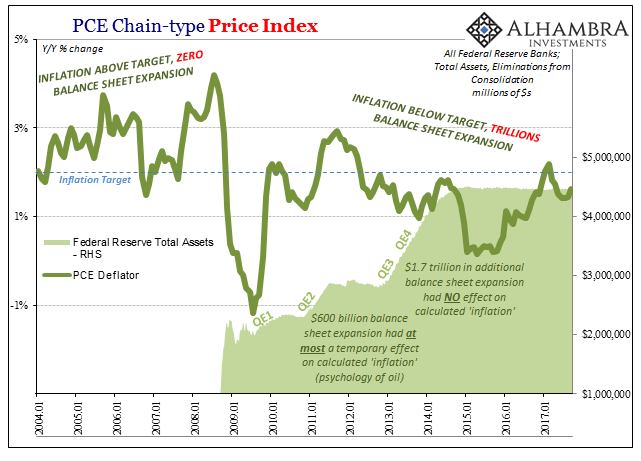 - Click to enlarge |
If a third year of transitory is all you got, then even those who might otherwise be reluctant have to consider that maybe Greenspan’s Fed had it all wrong to begin with.You can’t have a 2% inflation target, “print” $3.5 trillion in “money” with the intent to reach it, and then fail to do so for 5 and a half years and counting with no sign that’s going change. You just can’t.
Full story here Are you the author?Tags: Alan Greenspan,CPI,currencies,economy,Federal Reserve,Federal Reserve/Monetary Policy,FOMC,inflation,Markets,Monetary Policy,newslettersent,PCE,pce deflator,they really don't know what they are doing,U.S. Consumer Price Index,U.S. Retail Sales,University Of Michigan


