Jeffrey P. Snider
My articles My offerMy siteAbout meMy videosMy books
Follow on:LinkedINTwitterSeeking Alpha
| The People’s Bank of China reported this week that its holdings of foreign assets fell slightly again in August 2017. Down about RMB 21 billion, almost identical to the RMB 22 billion decline in July, the pace of forex withdrawals is clearly much preferable to what China’s central bank experienced (intentionally or not) late last year at ten and even twenty times the rate of July and August.
The US Treasury Department reported yesterday (TIC) that China’s registered holdings of UST’s increased for another month. After jumping $44 billion in June, the TIC estimates put the balance $19.5 billion higher again in July (TIC is one month further behind than the PBOC balance sheet). It’s the sixth consecutive monthly net gain. This suggests something of a large and growing disparity somewhere in (or near) China. The two series do not have to match, as there are more pockets in China to hold US$ assets than just the PBOC’s. And the Chinese central bank in its forex portfolio owns far more than just assets denominated in dollars. Given all that, still there has been a relatively close relationship in at least the direction of both series. They do not fit each other perfectly, but they do fit; or used to. |
PBOC Balance Sheet, Aug 2011 - 2017(see more posts on pboc balance sheet, )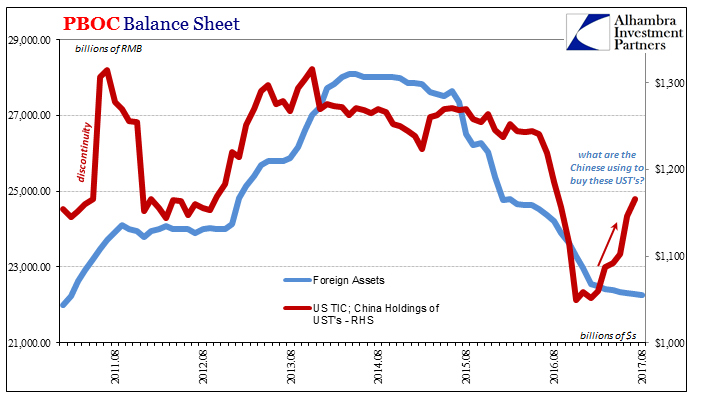 - Click to enlarge |
| It raises the same question I asked yesterday in the context of tightened US$ repo: where is China getting these “dollars?”
The rest of the TIC data helpfully eliminates one possible answer. If the world ever does go back to normal, or even just normal enough, we might expect that “hot money”, or these private eurodollar flows that are wrongly characterized this way, would revisit China again. That would mean the private and global money market resupplying (on more favorable terms) Chinese banks whose need for “dollars” has never gone away. |
US Treasuries, Jul 1996 - 2017(see more posts on U.S. Treasuries, )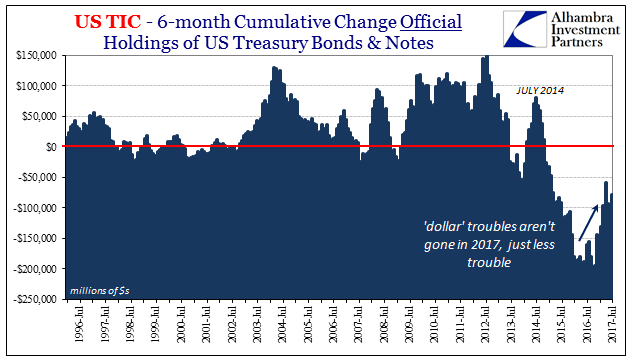 - Click to enlarge |
| What the TIC figures show throughout is that conditions in the global “dollar” market aren’t anything like that. There is less trouble and acute pressure within the eurodollar system this year compared to last year, but that doesn’t actually mean as much as it might sound. It is perfectly compatible with the global economy we have found described by almost all the real economy statistics, as we expect such a “dollar” cause to that economy effect. |
US Treasuries, Jan 2013 - Jul 2017(see more posts on U.S. Treasuries, )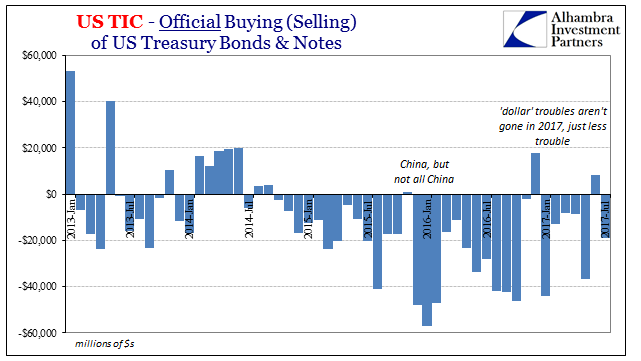 - Click to enlarge |
| In July, the foreign official sector “sold UST’s” again, on net. It wasn’t a huge amount, but it was negative again nonetheless. The change in official activity shows pretty well this relative difference, where in 2015-16 selling was heavy and consistent; in 2017, starting at the end of 2016, it is less heavy and more intermittent. But it is still, overall, selling.
The possible effect of continued if reduced irregularity may be weakening private side activity in “dollars.” There was an extreme net purchase of US$ assets by private foreign sources in May, but the other three of the last four months were far weaker. Both April and now July nearly equalized (net zero) purchases to sales. |
US TIC - Monthly Change, Jan 2012 - March 2017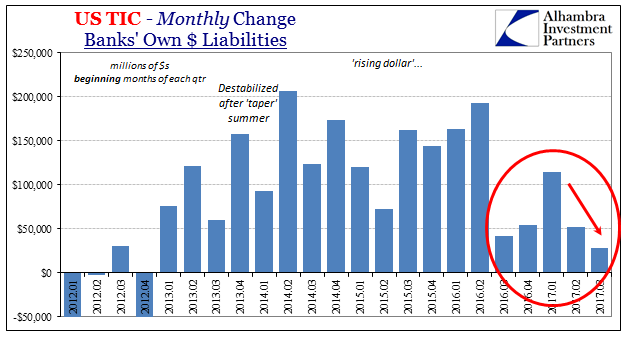 - Click to enlarge |
| The banking data offers a possible explanation, one that we have seen already in market after market (apart from stocks, obviously). The TIC category of banks reporting dollar liabilities to and from foreign sources was very weak again in the opening month of the latest quarter (Q3). That is the second straight lower start to a calendar quarter after more favorable results in the two quarters prior to them (Q4 2016 & Q1 2017). |
US TIC - Monthly Change, Jan 2012 - Feb 2017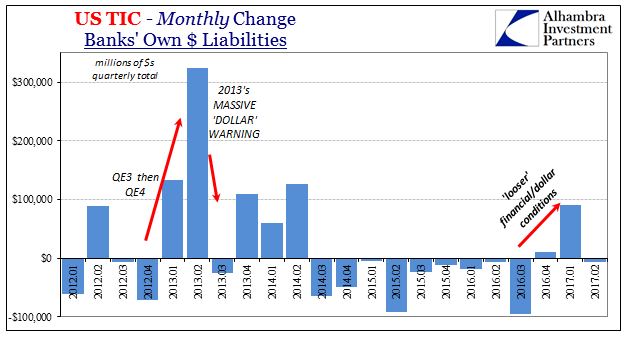 - Click to enlarge |
| The pattern here in the beginning month has matched the final dollar tallies for those quarters in full, as well as the up and down of “reflation” associated with global money perceptions and reality. |
Eurodollar Futures Curve, Jun 2010 - 2017(see more posts on eurodollar futures curve, )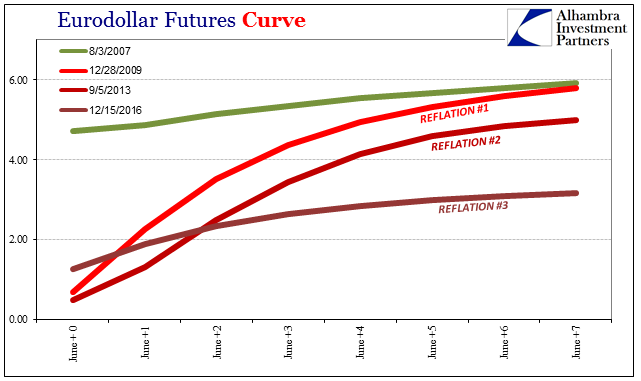 - Click to enlarge |
| As above, the various dimensions and cross sections of bank liability data conforms very well to the story embedded within market curves. In other words, Reflation #3 was in every possible way significantly less than Reflation #2; which was in most ways less than Reflation #1. Since neither #1 nor #2 led to, or even indicated much realistic potential for, normalcy, the probability of that outcome for #3 is exceedingly small and getting smaller by the month. |
US Banking Data, Jul 1978 - 2017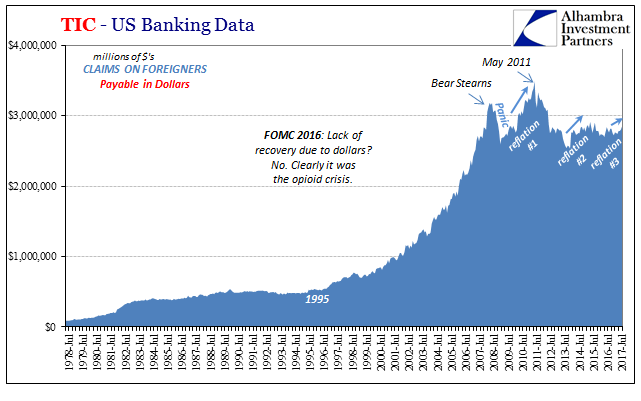 - Click to enlarge |
| It’s like being a swimmer fighting against a strong current. The first time after being swept up in it (2008), you struggle hard and expend a lot of energy to get out of it. Reaching a point of exhaustion though still short of that goal, you might relax and rest a bit while the current takes you further away again (2011); until you are ready to struggle once more against it. |
US Banking Data, Jul 1978 - 2017 - Click to enlarge |
| But you aren’t nearly as energetic this second time for the effort expended in the first. In fact, as you cycle through these periods of swimming and rest, you can only get weaker for each and every one. Overall, you fall further and further behind. |
US Banking Data, Jul 2005 - 2017 - Click to enlarge |
| The global economy tracks the money; as monetary energy, so to speak, gets weaker, so does it with each rebound or upturn following each downturn or near recession. |
US Personal Income, Jan 2010 - Jul 2017(see more posts on U.S. Personal Income, )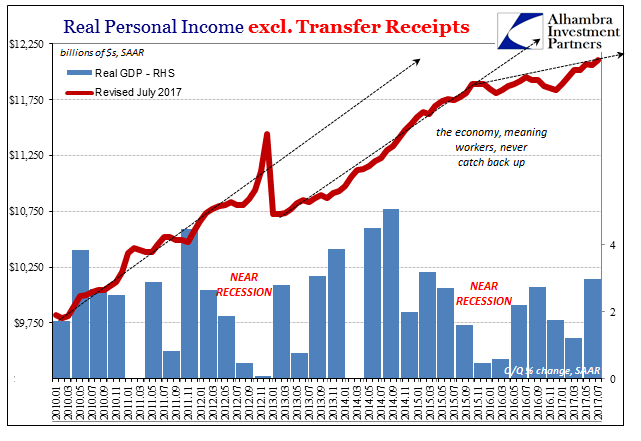 - Click to enlarge |
| From that, I’m going to reasonably speculate that the Chinese aren’t getting their “dollars” the way the world would hope. The PBOC or whomever else acting on its behalf, and through secondary (or tertiary) conduits and channels (Hong Kong?), is almost certainly doing it the artificial way (and leaving a large, negative impression). The idea is simple enough, to make the Chinese swimmer appear to be stronger in his fight against the “dollar” current than he really is. |
China Industrial Production, Aug 1998 - 2017(see more posts on China Industrial Production, )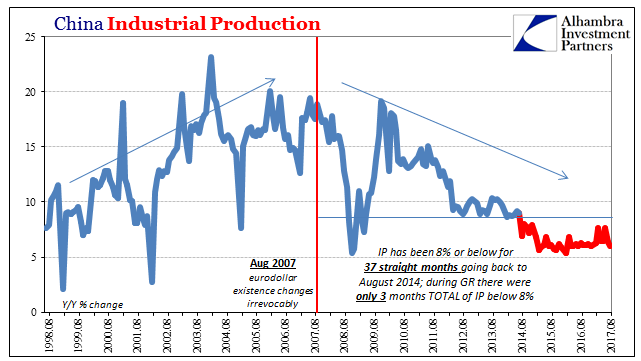 - Click to enlarge |
| From there it is hoped, maybe even believed, that the “dollar” tide will flow somewhere else altogether and leave China’s shores. But can anyone really change or redirect an ocean of flow (or in this case its ebb)? It seems from the very start an effort with low probability for success. I happen to think Chinese authorities know that after having suffered through the “rising dollar” and are doing it anyway. What other choice do they have? |
PBOC Balance Sheet, Jan 2014 - Aug 2017(see more posts on pboc balance sheet, ) - Click to enlarge |
Tags: $CNY,China,China Industrial Production,currencies,dollar,economy,eurodollar futures curve,eurodollar system,Federal Reserve/Monetary Policy,Markets,newslettersent,PBOC,pboc balance sheet,tic,U.S. Personal Income,U.S. Treasuries,yuan