George Dorgan
My articles My siteAbout meMy videosMy books
Follow on:LinkedINTwitterSeeking Alpha
CFA SocietyEconomicBlogs
Swiss Franc vs USD and EURThe Swiss Franc entered the second week of stronger losses. While the euro gained 4% last week, the dollar appreciated against the Swiss Franc by 2% during this week. The euro could add another percent in the last days. The EUR/CHF reached 1.1521 after the strong US job figures. Finally, however the euro fell to 1.1451 for two reasons:
More US jobs mean more purchasing power and more demand for Swiss pharmaceutical and chemical products. The rising share of Swiss exports to the U.S. is visible in the Swiss trade balance and got also mentioned in a recent research paper Switzerland changing international linkages.
|
EUR/CHF and USD/CHF, August 05(see more posts on EUR/CHF, USD/CHF, )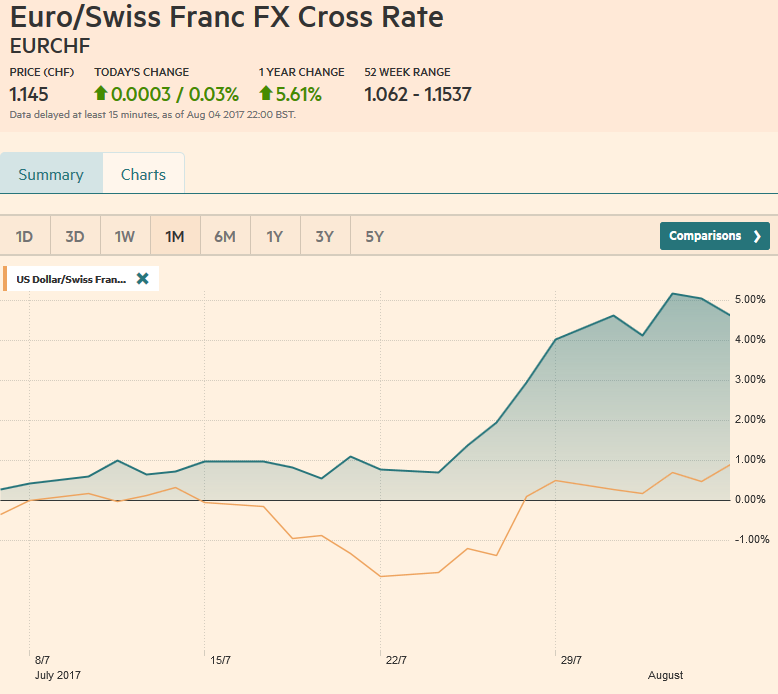 Source: markets.ft.com - Click to enlarge |
Swiss Franc Currency Index (3 years)The Swiss Franc index is the trade-weighted currency performance (see the currency basket)On a three years interval, the Swiss Franc had a weak performance. The dollar index was far stronger. The dollar makes up 33% of the SNB portfolio and 25% of Swiss exports (incl. countries like China or Arab countries that use the dollar for exchanges). Contrary to popular believe, the CHF index gained only 1.73% in 2015. It lost 9.52% in 2014, when the dollar (and yuan) strongly improved. |
Swiss Franc Currency Index (3 years), August 05(see more posts on Swiss Franc Index, )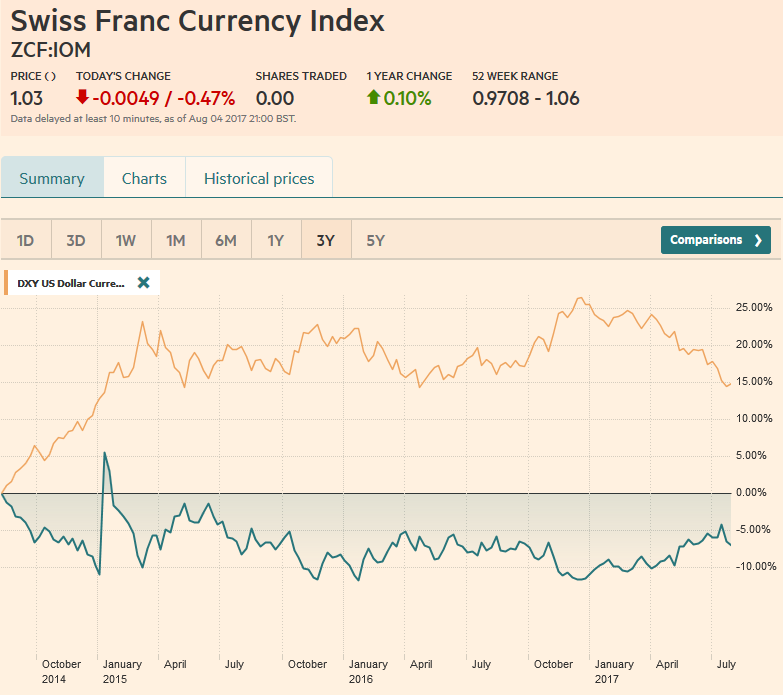 Source: markets.ft.com - Click to enlarge |
| Marc Chandler My articles My offerMy siteAbout meMy videosMy books Follow on:LinkedINTwitterSeeking AlphaAmazon US Dollar IndexThe US dollar has fallen for four consecutive weeks against the euro, yen, and yuan. Its technical condition is stretched, and sentiment seems universally negative. However, the breadth of the dollar descent narrowed. The greenback snapped a five-week slide against the Canadian dollar and a three-week slide against the Antipodean currencies. We are hesitant about reading too much into counter-trend price action on summer Friday, but technical indicators suggested that the trends were more stretched that consensus narrative suggested. Many observers talk about the unwind of the “Trump bump” to explain the dollar’s decline in recent months. There is something there, of course, but it may be exaggerated. There is something else going on that now is taken for granted. At the end of last year and through the first quarter, a significant concern was the populist-nationalist wave that saw the UK vote to leave the EU and Americans elected Trump was going to sweep through Europe. We doubted this consensus narrative, but may not have appreciated the impact on psychology when it became clear that populist-nationalism was going to be turned back in fact. The euro gapped higher on April 24 and the Dollar Index gapped lower as Macron’s victory in the first round of the French election brought a collective sigh of relief (and euro buying). Foreign investors cut European equity exposure last year by around $100 bln, and through July may have returned around $30 bln. The Dollar Index had its highest close for the week before the weekend. The technical tone is on the verge of improving. The RSI turned up, and the MACD is set to cross higher at the start of the new week. A small bullish divergence may be seen on the Slow Stochastics. Several technical levels converge around 94.00-94.20. Sometimes a change in the dollar’s direction happens at once, and sometimes is happens sequentially. This time, it may happening sequentially. The dollar bottomed against the Swiss franc on July 21 (~CHF0.9440) finished last week above it July highs. The dollar rose every day last week against the Canadian dollar and the last four sessions against the Australian dollar. It was not just about the US jobs data. |
US Dollar Currency Index, August 05(see more posts on U.S. Dollar Index, ) Source: markets.ft.com - Click to enlarge |
EUR/USDThe euro’s advance was getting tired even as it recorded the two-year high in the middle of the week near $1.1910. It consolidated, and some profit-taking was seen ahead of the weekend when it became clear the momentum was flagging. The euro can slip back into the $1.1680-$1.1725 band without doing much damage. Many leveraged accounts and momentum players have their sights set on $1.20-$1.22. |
EUR/USD with Technical Indicators, August 05(see more posts on Bollinger Bands, EUR/USD, MACDs Moving Average, RSI Relative Strength, Stochastics, ) EUR/USD Week Ending August 05 with Technical Indicators - Click to enlarge |
USD/JPYThe US dollar dipped below JPY110 on two different occasions last week, and with the help of a back up in US interest rate, the greenback recovered and made new highs for the week just ahead of the weekend. The technical indicators are in a similar position as we saw with the Dollar Index. The RSI is turning up, and the MACDs are about to do so, while the Slow Stochastics are flat lining in the trough. A convincing move above JPY111 will likely run into offers near JPY111.70, which is important from a technical perspective, with moving averages and retracement level converging. A move above JPY112.20 would be seen as confirmation that a low is in place. |
USD/JPY with Technical Indicators, August 05(see more posts on Bollinger Bands, MACDs Moving Average, RSI Relative Strength, Stochastics, USD/JPY, )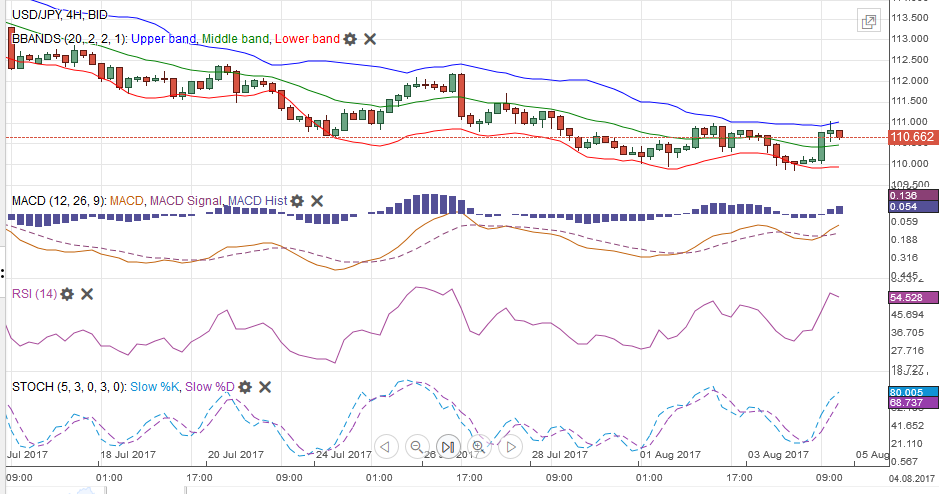 USD/JPY Week Ending August 05 with Technical Indicators - Click to enlarge |
GBP/USDThe market’s take away from the Bank of England meeting, at which GBP15 bln more was earmarked for the funding for the lending scheme was that the first hike will be delivered deeper into H2 18 than previously anticipated. This saw sterling record a key reversal by making a new 11-month high before selling off and settling below the previous day’s low. There was follow through selling before the week that saw sterling slip through its 20-day moving average (~$1.3050). The technical indicators warn of additional losses. The RSI and MSCDs have turned, and the Slow Stochastic is set to do so early next week. A break of the $1.2950-$1.3000 area could spur a move toward $1.2800-$1.2825. |
GBP/USD with Technical Indicators, August 05(see more posts on Bollinger Bands, GBP/USD, MACDs Moving Average, RSI Relative Strength, Stochastics, )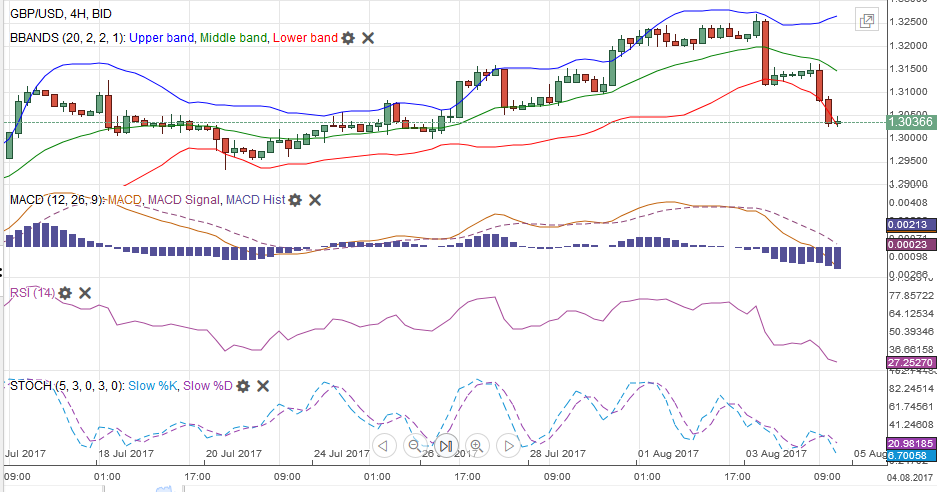 GBP/USD Week Ending August 05 with Technical Indicators - Click to enlarge |
AUD/USDThe Australian dollar peaked on July 27 near $0.8065. It tried again at it around the RBA meeting, but faltered and slipped briefly below $0.7900 before the weekend. The lows from late July near $0.7875 held. That area also corresponds with a 38.2% retracement of the Aussie’s climb from $0.7570 a month ago. The 20-day moving average is found near there as well. A break could spur another cent correction toward $0.7780-$0.7800.
|
AUD/USD with Technical Indicators, August 05(see more posts on Australian Dollar, Bollinger Bands, MACDs Moving Average, RSI Relative Strength, Stochastics, )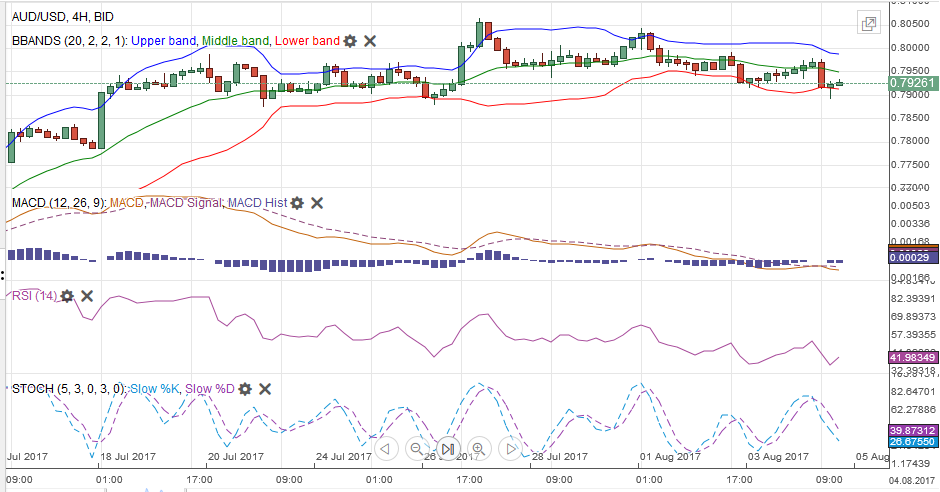 AUD/USD Week Ending August 05 with Technical Indicators - Click to enlarge |
USD/CADThe US dollar bottomed against the Canadian dollar on July 26 in front of CAD1.24. It is the first time in four months that the greenback rose for an either week against the Loonie. The technical indicators have turned to favor the US dollar. Also, the five and 20-day moving averages may cross in the coming days, which would be the first time since late May. We see near-term potential toward CAD1.2720 and possibly CAD1.28. The US dollar bottomed against the Canadian dollar on July 26 in front of CAD1.24. It is the first time in four months that the greenback rose for an either week against the Loonie. The technical indicators have turned to favor the US dollar. Also, the five and 20-day moving averages may cross in the coming days, which would be the first time since late May. We see near-term potential toward CAD1.2720 and possibly CAD1.28. |
USD/CAD with Technical Indicators, August 05(see more posts on Bollinger Bands, Canadian Dollar, MACDs Moving Average, RSI Relative Strength, Stochastics, )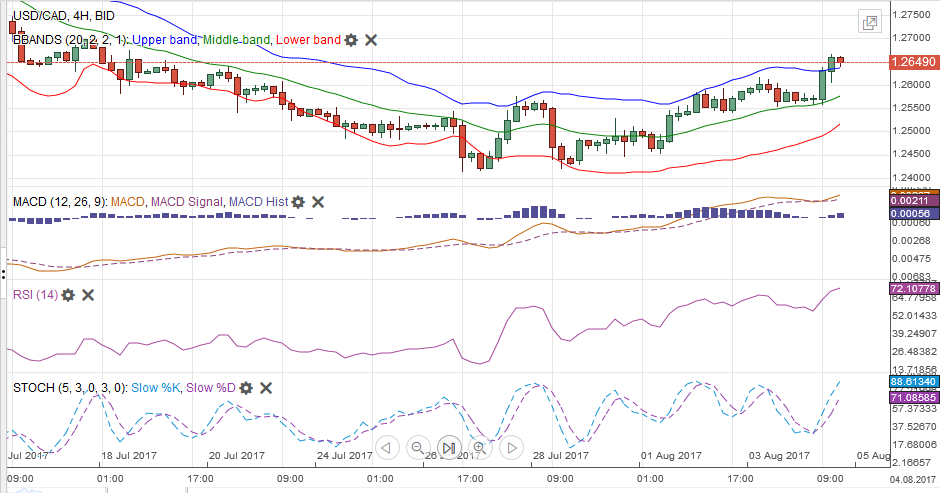 USD/CAD Week Ending August 05 with Technical Indicators - Click to enlarge |
Crude OilThe price of September light sweet crude oil spent the week in choppy consolidation after rallying 8.6% the previous week. A build in US inventories and increased output, while OPEC appears to have stepped up its exports in July provided some reasons for the bulls to be cautious. The MACDs and Slow Stochastics are set to turn lower, but the RSI does not. A break of $48 warns of a deeper correction has begun, while a move above $50 excites the bulls for a run at $52-$54. |
Crude Oil, August 2016 - August 2017(see more posts on Crude Oil, )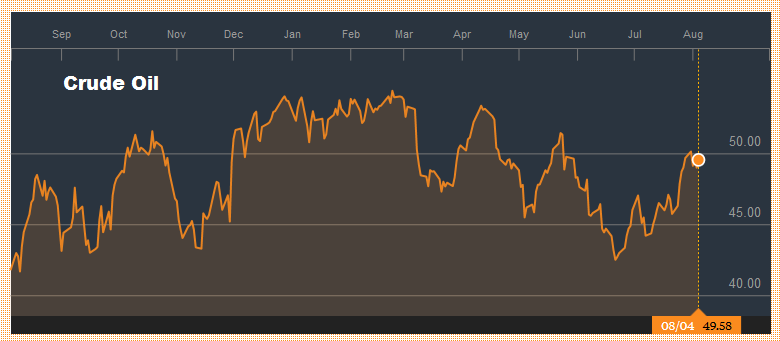 Source: bloomberg.com - Click to enlarge |
U.S. TreasuriesThe US 10-year yield was slightly softer on the week with the help of the five basis point increase at the end of the week. Earlier in the week, the yield had dripped to almost 2.21%, the lowest rates since late June. The yield has to get above around 2.35% to be anything significant. The September note futures contract managed to close barely above 126-10, the 61.8% retracement of the decline since June 14 high near 127-08, but this was a false breakout, as the sell-off before the weekend showed. Initial support for the September is seen near 125-16 to 125-20. A move above 126-16 would like spur dollar losses against the yen.
|
Yield US Treasuries 10 years, August 2016 - August 2017(see more posts on U.S. Treasuries, )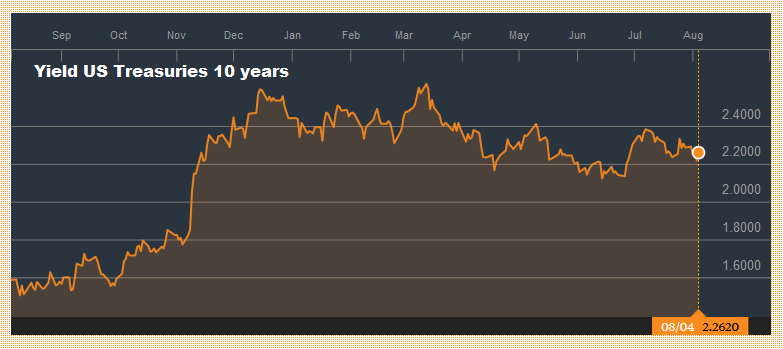 Source: bloomberg.com - Click to enlarge |
S&P 500 IndexThe S&P 500 eked out a small gain for the week, reversing the minor loss in the previous week, which had snapped a three-week advance. The S&P 500 set the record high on July 27, and in the six sessions since, it has been confined to the range set then. A break of that range, roughly 2460 to 2484, may be the next important technical development. The Russell 1000 Growth Index rose 0.3% to extend the advance to for a fourth consecutive week. The Russell 1000 Value Index rose 0.25%. It is the fourth consecutive weekly advance. It has fallen in only two of the past 11 weeks |
S&P 500 Index, August 05(see more posts on S&P 500 Index, )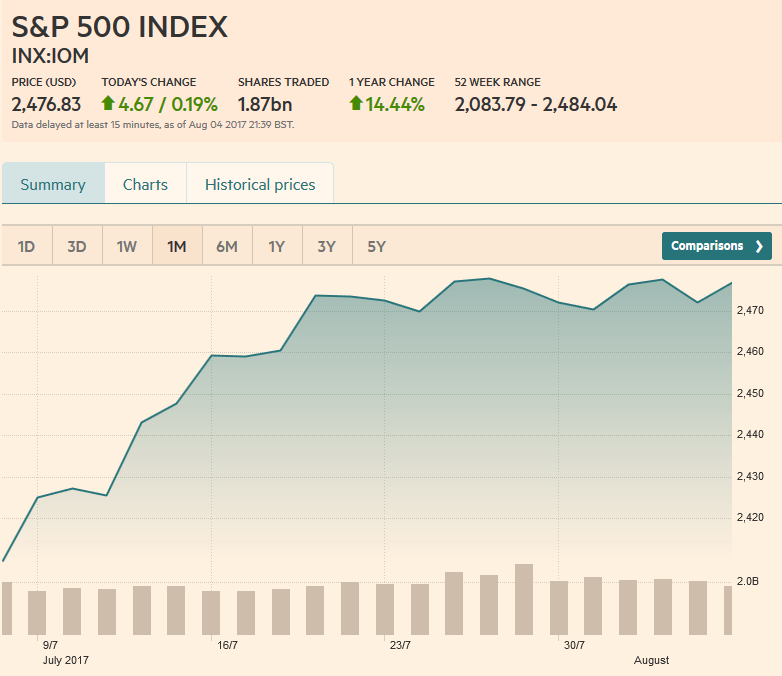 Source: markets.ft.com - Click to enlarge |
Are you the author?
Tags: Australian Dollar,Bollinger Bands,British Pound,Canadian Dollar,Crude Oil,EUR/CHF,EUR/USD,Euro,Euro Dollar,GBP/USD,Japanese yen,MACDs Moving Average,newslettersent,RSI Relative Strength,S&P 500 Index,Stochastics,Swiss Franc Index,U.S. Dollar Index,U.S. Treasuries,usd-jpy,USD/CHF,USD/JPY