George Dorgan
My articles My siteAbout meMy videosMy books
Follow on:LinkedINTwitterSeeking Alpha
CFA SocietyEconomicBlogs
USD/CHFThe dollar had some gains versus the franc during the last month, but it lost all during the last days. EUR/CHFThe euro is still around 1.14, this is up 2.5% against one month ago. The rising momentum for EUR/CHF, however, seems to be fading.
|
EUR/CHF and USD/CHF, August 26(see more posts on EUR/CHF, USD/CHF, )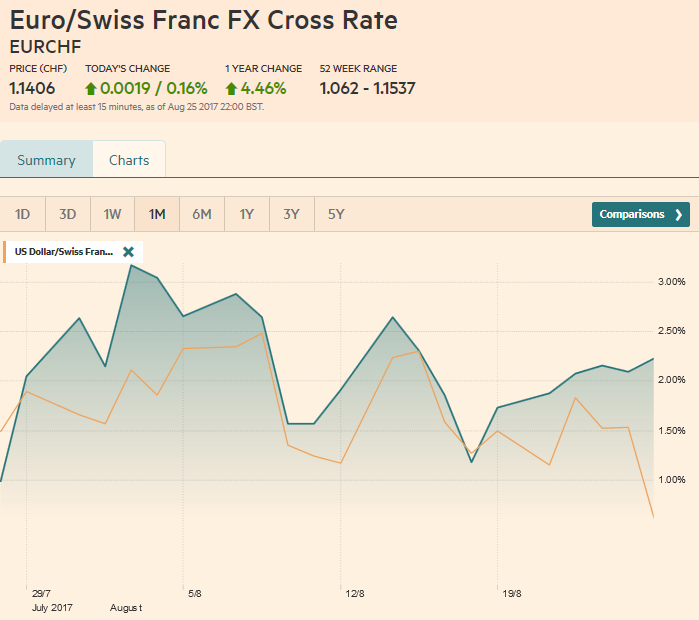 Source: markets.ft.com - Click to enlarge |
Swiss Franc Currency Index (3 years)The Swiss Franc index is the trade-weighted currency performance (see the currency basket)On a three years interval, the Swiss Franc had a weak performance. The dollar index was far stronger. The dollar makes up 33% of the SNB portfolio and 25% of Swiss exports (incl. countries like China or Arab countries that use the dollar for exchanges). Contrary to popular believe, the CHF index gained only 1.73% in 2015. It lost 9.52% in 2014, when the dollar (and yuan) strongly improved. |
Swiss Franc Currency Index (3 years), August 26(see more posts on Swiss Franc Index, )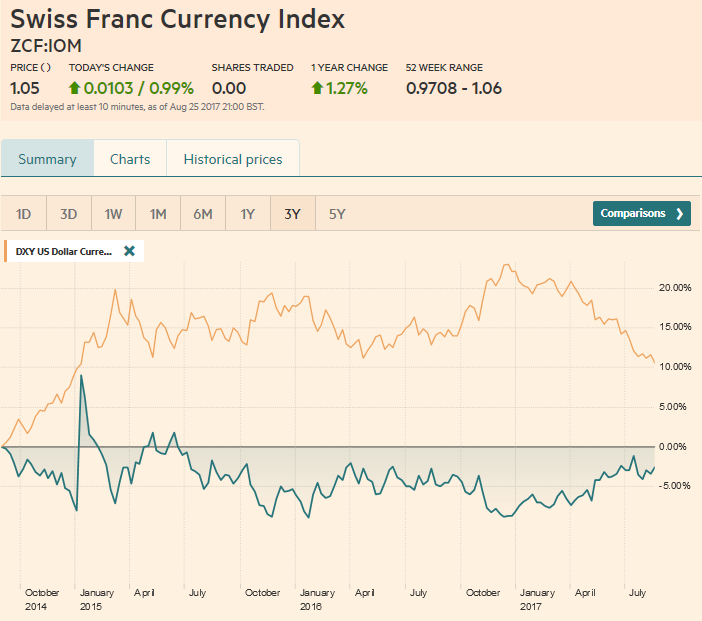 Source: markets.ft.com - Click to enlarge |
| Marc Chandler My articles My offerMy siteAbout meMy videosMy books Follow on:LinkedINTwitterSeeking AlphaAmazon US Dollar IndexThe broad technical condition of the dollar deteriorated materially before the weekend. It could be written off as an exaggerated Friday afternoon in the summer. However, as we had noted last week that the technical tone of the dollar had begun weakening, and we saw the price action in the Australian and Canadian dollar as the possible tell. After depreciating on a trend basis for much of the first seven months of the year, the dollar spent August largely consolidating. Although the focus is on monetary policy, we are concerned about the US debt ceiling and spending authorization with the fissures in the majority party that has hardly passed a single bill in the past six months. If these issues can be addressed without much disruption, the dollar may begin recovering, but there is much wood to chop first. For the better part of the past two weeks, the Dollar Index has alternated between gaining and declining sessions. The Dollar Index finished last month near 92.85. It recorded new lows for the year ahead of the weekend, near 92.40. The consolidation has largely corrected the oversold technical condition. The Slow Stochastics have turned lower, while the MACDs may will likely cross in the next session or two. The low from May 2016 was a little below 92.00, and the 91.20 area corresponds with a 50% retracement of the rally since mid-2014. The 61.8% retracement is closer to 88.25. |
US Dollar Currency Index, August 26(see more posts on U.S. Dollar Index, )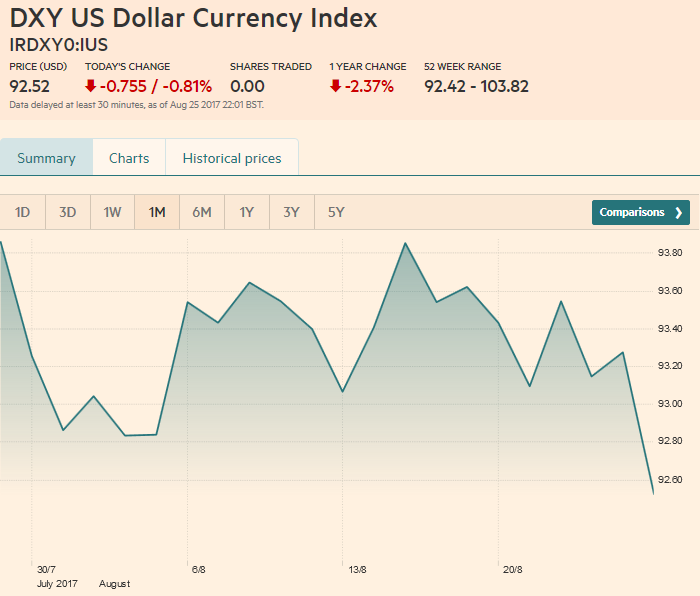 Source: markets.ft.com - Click to enlarge |
EUR/USDHere in Q3, the euro has fallen in only two weeks, the week ending July 7 and last week, ending August 18. Similar to the technical reading of the Dollar Index, the Slow Stochastics have turned higher, leading the MACDs which barely crossed with the surge before the weekend that carried the euro to new highs for the year (~$1.1940). Many participants have had their sights set on $1.20 for some time. We note that $1.2140 corresponds with a 50% retracement of the euro’s decline that began in mid-2014. |
EUR/USD with Technical Indicators, August 26(see more posts on Bollinger Bands, EUR/USD, MACDs Moving Average, RSI Relative Strength, Stochastics, )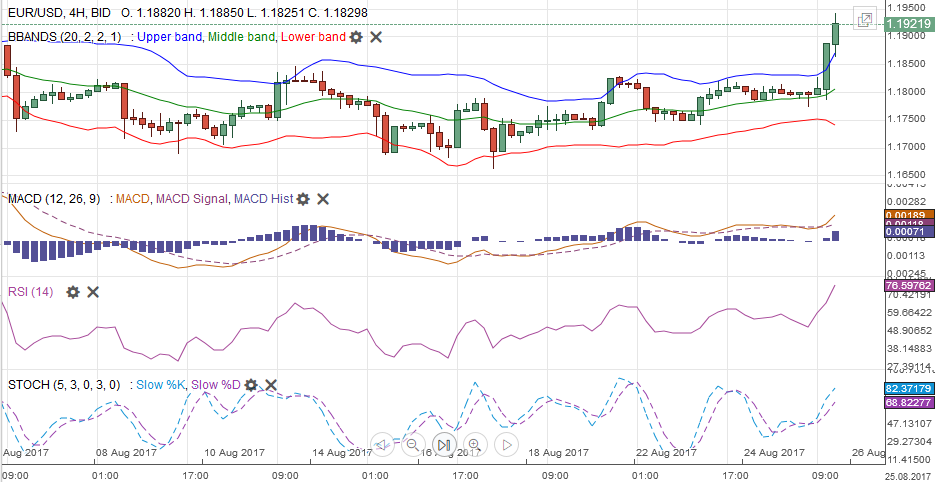 EUR/USD Week Ending August 26 with Technical Indicators - Click to enlarge |
USD/JPYThe dollar spent the week chopping at the lower end of this year’s range. Before the weekend the greenback held above JPY109 for the first time in six sessions. The technical indicators are mixed, and in any event, are not generating a compelling signal that a significant low in place. If the year’s low, set in April is broken, the next important technical target is near JPY106.50. The euro surged above JPY130 ahead of the weekend. This break out targets the JPY134-JPY134.50 area. |
USD/JPY with Technical Indicators, August 26(see more posts on Bollinger Bands, MACDs Moving Average, RSI Relative Strength, Stochastics, USD/JPY, )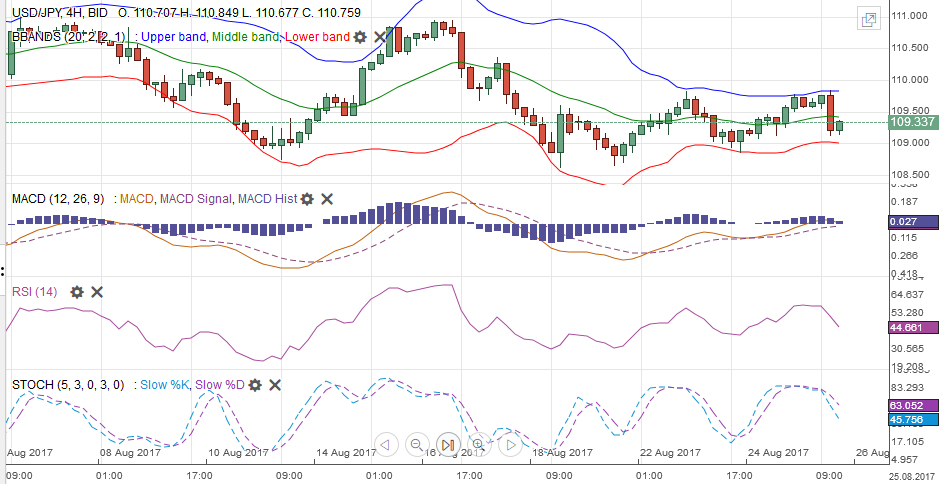 USD/JPY Week Ending August 26 with Technical Indicators - Click to enlarge |
GBP/USDSterling is one of the worst performing major currencies this month. It has lost 3% against the greenback and 1.6% against the euro. Against the dollar, sterling returned to levels below $1.28 not seen since the late June. However, the downside momentum stalled, and new buying materialized before the weekend. The $1.2900-$1.2930 area offers initial resistance. The technical indicators are improving. The MACDs may be the last to turn but are poised to do so in the coming days. We suspect near-term potential extends toward $1.2975-$1.3000. These sterling gains may be more a function of a weaker US dollar than a bullish outlook for sterling. The euro is poised to extend its gains against sterling. The GBP0.9500 is the next obvious target, but many are calling for a move to parity. |
GBP/USD with Technical Indicators, August 26(see more posts on Bollinger Bands, GBP/USD, MACDs Moving Average, RSI Relative Strength, Stochastics, )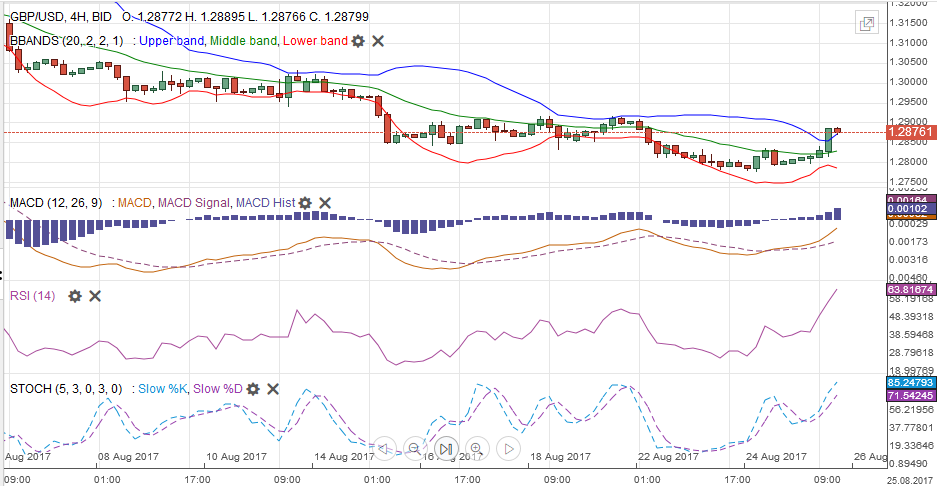 GBP/USD Week Ending August 26 with Technical Indicators - Click to enlarge |
AUD/USDThe Australian dollar peaked near $0.8065 in late July before falling to nearly $0.7800 in mid-August. We suggested last week that the pullback in the dollar bloc had run its course. The Aussie struggled at the start of the weekbut recorded near six-day highs before the weekend. A move above $0.7970, which was approached before the weekend, signals not only a test of the earlier high for the year near $0.8065, but another leg up toward $0.8150-$0.8250.
|
AUD/USD with Technical Indicators, August 26(see more posts on Australian Dollar, Bollinger Bands, MACDs Moving Average, RSI Relative Strength, Stochastics, )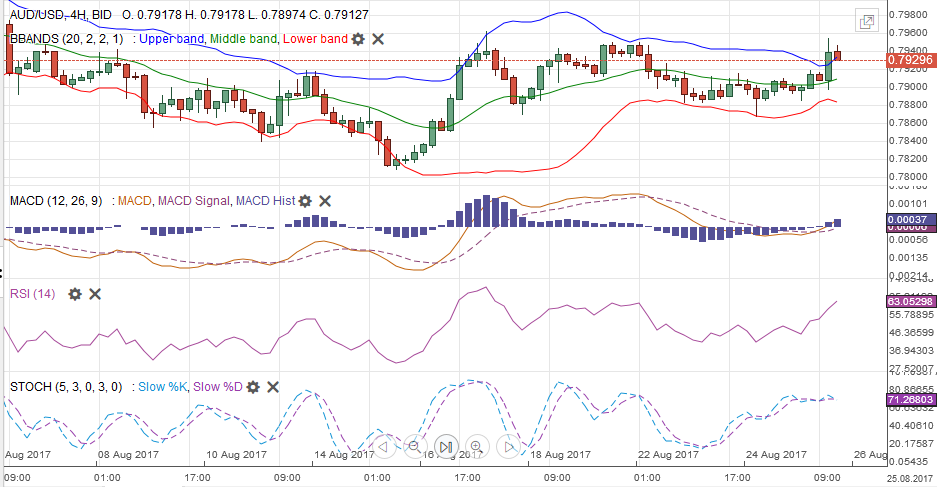 AUD/USD Week Ending August 26 with Technical Indicators - Click to enlarge |
USD/CADStrong Canadian economic data underpins expectations that the Bank of Canada will hike interest rates again in October. The market is not nearly as confident that any other major central bank will lift rates this year, including the Federal Reserve. The US dollar is set to fall to new lows for the year against the Canadian dollar next week. A break of CAD1.24 will target the CAD1.2160 area. The CAD1.2550 area may now offer resistance.
|
USD/CAD with Technical Indicators, August 26(see more posts on Bollinger Bands, Canadian Dollar, MACDs Moving Average, RSI Relative Strength, Stochastics, )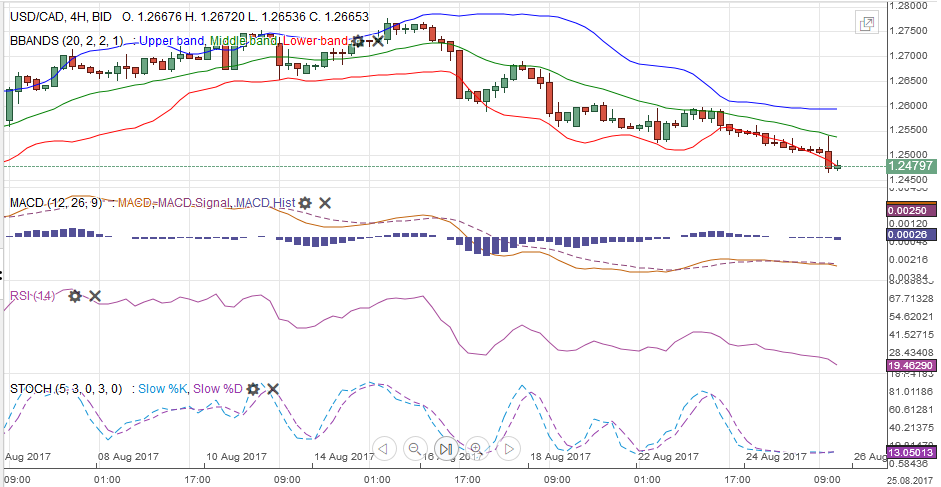 USD/CAD Week Ending August 26 with Technical Indicators - Click to enlarge |
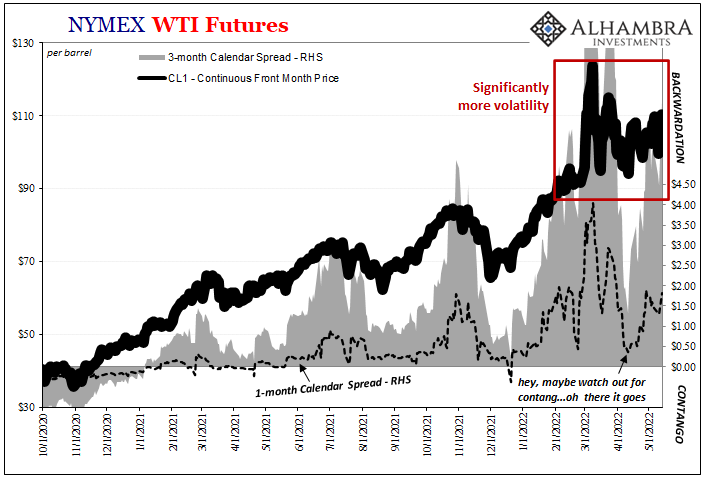
Crude OilLight sweet crude extended its losing streak to the fourth week. The 1.8% decline was the largest in five weeks. The technical indicators are encouraging, and the anticipated pullback in the dollar may also lend support. The $48.60-$49.00 band offers initial resistance, and it also corresponds to the 20-day moving average. A break of $46.60 would neutralize this bullishness, while a break of $45.50 would warn that the recovery since mid-June has run its course. |
Crude Oil, August 2016 - August 2017(see more posts on Crude Oil, )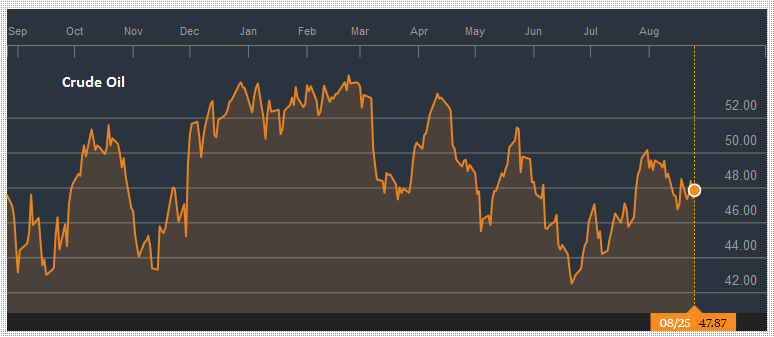 Source: bloomberg.com - Click to enlarge |
U.S. TreasuriesUS 10-year yields slipped almost two basis points, fully accounted for the pre-weekend price action. It is the third decline in four weeks. The yield posted its lowest weekly close since June 26. The yield looks poised to retest if not fall through this year’s low near 2.10%. Our underlying concern is that if the market is unwinding the Trump trade, the 10-year yield may return toward levels seen before last November’s election (1.80%-1.85%) unless something changes. The September 10-year note futures contract has spent the last several sessions knocking on 127-00. The intra-day contract high was set in mid-June near 127-08. A move above there would target the 50% retracement of the decline since July 2016 high (134-07) which is found near 128-20. The technical indicators are getting stretched, but no sign yet of an imminent top.
|
Yield US Treasuries 10 years, August 2016 - August 2017(see more posts on U.S. Treasuries, )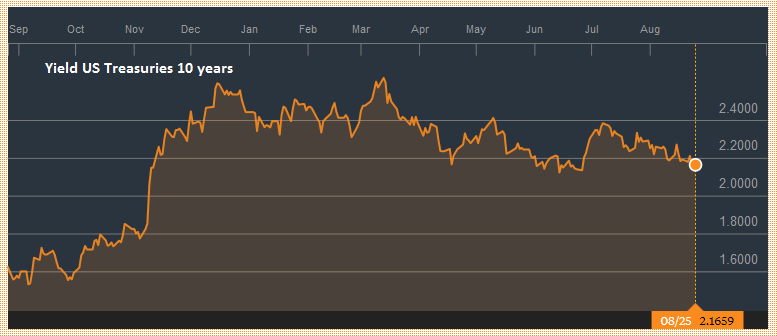 Source: bloomberg.com - Click to enlarge |
S&P 500 IndexThe S&P 500 recouped the previous week’s losses, but it needs to continue to rally another percent in the coming days if it is going to extend its advancing streak for a sixth consecutive month. The S&P 500 gapped higher on August 22 but ran into sellers a little above 2450. The technical indicators are supportive, but we suspect there may be another attempt to fill the gap, which is found roughly between 2430.6 and 2433.7. The Russell 1000 Value Index rose about 0.8% last week. It was the biggest weekly advance since May. The Russell 1000 Growth Index rose 0.7%. It is the largest gain in a month. The technical indicators of the Value Index look more constructive than the Growth Index. |
S&P 500 Index, August 26(see more posts on S&P 500 Index, )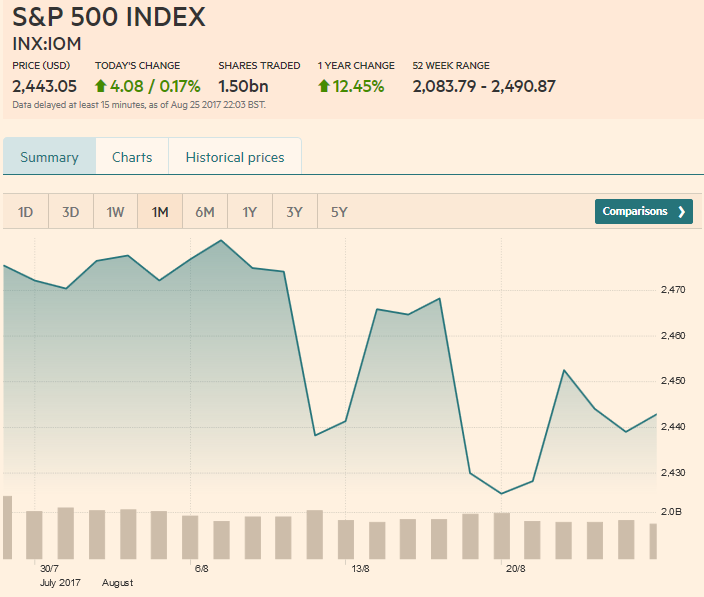 Source: markets.ft.com - Click to enlarge |
Are you the author?
Tags: Australian Dollar,Bollinger Bands,British Pound,Canadian Dollar,Crude Oil,EUR/CHF,EUR/USD,Euro,Euro Dollar,GBP/USD,Japanese yen,MACDs Moving Average,newslettersent,RSI Relative Strength,S&P 500 Index,Stochastics,Swiss Franc Index,U.S. Dollar Index,U.S. Treasuries,usd-jpy,USD/CHF,USD/JPY