Marc Chandler
My articles My offerMy siteAbout meMy videosMy books
Follow on:LinkedINTwitterSeeking AlphaAmazon
George Dorgan
My articles My siteAbout meMy videosMy books
Follow on:LinkedINTwitterSeeking Alpha
CFA SocietyEconomicBlogs
Summary
Home ownership varies throughout the EU but is overall near US levels.
Germany has the lowest home ownership, and Spain has the most. Italy has the least amount of mortgages.
US include owner equivalent rents in CPI, the EU does not.
| This Great Graphic was in the Financial Times recently. It shows home ownership rates several EU countries. The useful chart also shows those who own (red bar) and those who pay a mortgage, or housing loan (light blue) and those that rent (dark blue).
A few observations jump out at us. Home ownership is the lowest in Germany. It is the highest in Spain. However, look at Italy. Home ownership is almost as great as in Spain, but the larger red bar means that fewer Italians have mortgages on their homes. Denmark and the Netherlands have the highest percentage of home ownership supported by mortgages. In the United States, home ownership stood at 63.7% at the end of Q2. It averaged 65.3% over the past half century. The peak was reached in Q2 2014 at 69.2%. A 2012 survey, the most recent we found, suggests that nearly 30% of American homeowners do not have mortgage debt. |
EU Home Ownership Red - Owner, no outstanding mortgage or housing loan, Sky Blue - Owner, with mortgage or loan, Blue - Tenant - Click to enlarge |
| There are two components of shelter costs in the US measures of inflation. There is rent, and there also is a function for the owner equivalent (OER). OER in the US is nearly 25% of the CPI basket. However, OER is not includedin the EU measure of inflation. While home ownership is roughly the same, a little more than 60%, more Europeans cando it without debt.
This is one of the examples of our general point about comparing inflation. The major central banks have all adopted an inflation target of about 2%. However, while the target is broadly similar, the basket of goods and services they target is strikingly different. A while back, we created a table that compares CPI measures between the US, EU, Japan and the UK, which we repost here: |
U.S. Headline CPI: Component weights / Relative Importance(see more posts on U.S. Consumer Price Index, )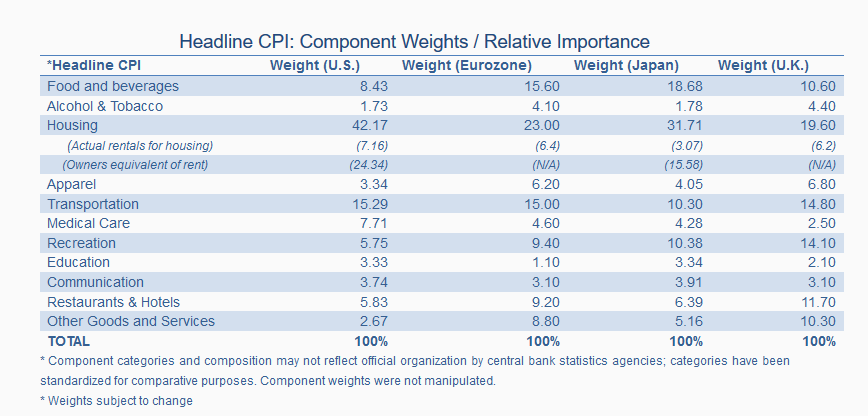 - Click to enlarge |
Tags: EU,Great Graphic,inflation,newslettersent,U.S. Consumer Price Index,US