


George Dorgan
My articles My siteAbout meMy videosMy books
Follow on:LinkedINTwitterSeeking Alpha
CFA SocietyEconomicBlogs
Swiss Franc vs USD and EURThe Federal Reserve is on track to hike rates in the middle of June.
It will be the third hike since the November election. In addition to keeping the door open to another hike this year, the Federal Reserve has signaled its intention to begin, however slowly, the reduction of its balance sheet.
In the meantime, regardless of potential changes in its risk assessment, the ECB is unlikely to lift the negative deposit rate or even stop expanding its balance sheet this year. The Bank of Japan is expanding its balance sheet too, though not that the JPY80 trillion a year as had been the case. When stripped of food and energy, Japan is still not experiencing inflation.
Although the eurozone has grown faster than the US over the past couple of quarters, the next set of high frequency data is likely to confirm that the US economy is not so fragile.
Auto sales are likely to have improved this month, and the May jobs report should be solid even if not spectacular. In the eurozone, the preliminary estimate for May should show softer prices. The UK PMIs (manufacturing and construction) will likely weaken.
Japan is likely to report continued weak consumption but higher industrial production. Even if Q1 capital spending hints at and an upward revision to Japanese growth, the BOJ is nowhere near changing policy.
|
EUR/CHF and USD/CHF, May 27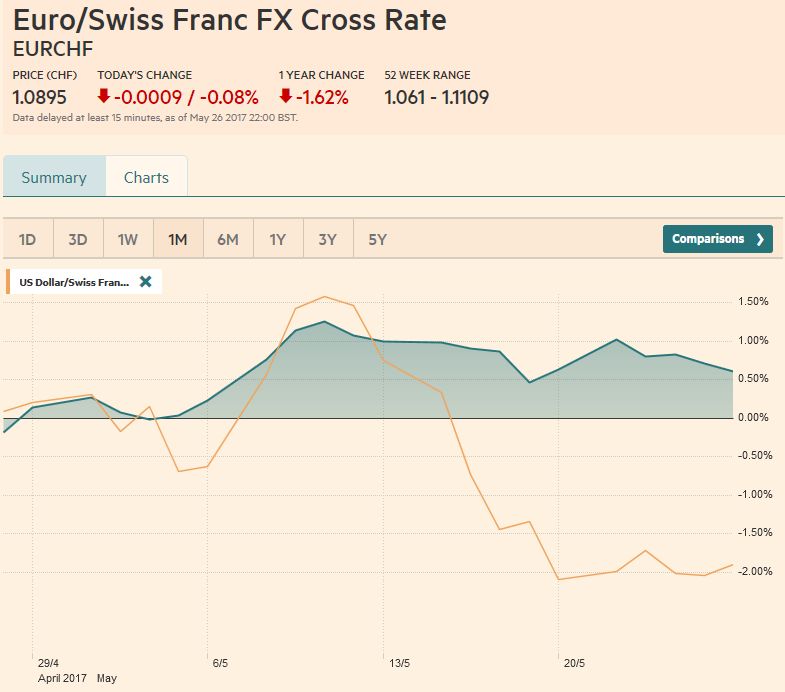 The picture shows that FX traders went long EUR against CHF. Source: markets.ft.com - Click to enlarge |
Swiss Franc Currency Index (3 years)The Swiss Franc index is the trade-weighted currency performance (see the currency basket)On a three years interval, the Swiss Franc had a weak performance. The dollar index was far stronger. The dollar makes up 33% of the SNB portfolio and 25% of Swiss exports (incl. countries like China or Arab countries that use the dollar for exchanges). Contrary to popular believe, the CHF index gained only 1.73% in 2015. It lost 9.52% in 2014, when the dollar (and yuan) strongly improved. |
Swiss Franc Currency Index (3 years), May 27(see more posts on Swiss Franc Index, ) Source: markets.ft.com - Click to enlarge |
Marc Chandler My articles My offerMy siteAbout meMy videosMy books Follow on:LinkedINTwitterSeeking AlphaAmazon USD/CHFThe idea that the dollar bull move is over in gaining adherents. It now seems to be the consensus view. This is reflected in bank forecasts, futures positioning and indicative pricing in the options market. We are not convinced. In our view, the key driver of this, the third significant dollar rally since the end of Bretton Woods, is the divergence of monetary policy broadly understood, and that divergence does not appear to have peaked. |
US Dollar/Swiss Franc FX Spot Rate, May 27(see more posts on USD/CHF, )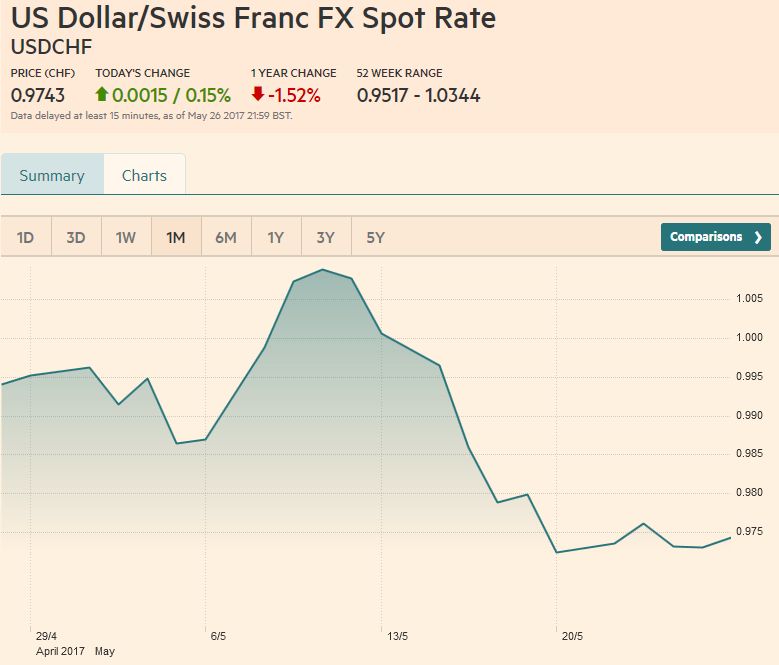 Source: markets.ft.com - Click to enlarge |
US Dollar IndexThe Dollar Index held the 61.8% retracement objective of the rally that began in early May 2016 just below 92.00. It finished the week flirting with 97.50. A convincing move above there helps carve out a trough, and a push above 98.00-98.15 would boost confidence that a low is in place. The MACDs and Slow Stochastics are about to turn higher.
|
US Dollar Currency Index, May 27(see more posts on US Dollar Index, )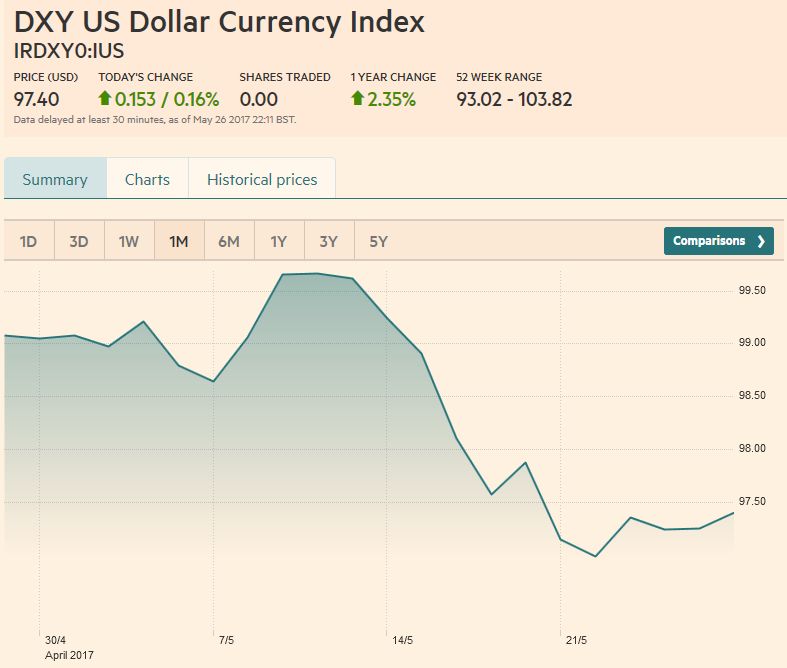 Source: markets.ft.com - Click to enlarge |
EUR/USDThe euro surpassed a similar retracement level that came in near $1.1130. The euro recorded a marginal low for the week ahead of the three-day weekend in the US near $1.1160. It had reached almost $1.1270 earlier in the week. The MACDs and Slow Stochastics are poised to cross lower in the coming session. A move toward $1.1050-$1.1100 would not be surprising, but it probably takes a break of $1.10 to boost confidence that a top is in place. |
EUR/USD with Technical Indicators, May 27(see more posts on Bollinger Bands, EUR/USD, MACDs Moving Average, RSI Relative Strength, Stochastics, )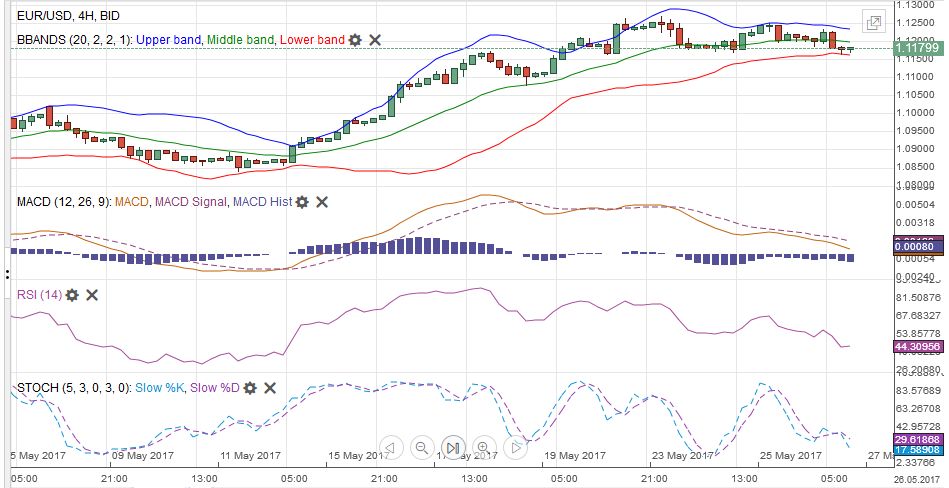 EUR/USD Week Ending May 27 with Technical Indicators - Click to enlarge |
USD/JPYTechnical indicators are not generating a strong signal in the yen. The dollar was essentially flat against the yen last week after falling 1.9% the previous week. That decline broke a four-week dollar-rally. The dollar slipped through JPY111.00 ahead of the weekend but managed to close above JPY111.20. It had reversed lower after poking through JPY112 briefly at mid-week. |
USD/JPY with Technical Indicators, May 27(see more posts on Bollinger Bands, MACDs Moving Average, RSI Relative Strength, Stochastics, USD/JPY, ) USD/JPY Week Ending May 27 with Technical Indicators - Click to enlarge |
GBP/USDSterling was the weakest of the majors last week, dropped 1.8% to fall to a one-month low below $1.28. The five and 20-day moving averages are set to cross. The momentum had been flagging as sterling approached $1.3055, the 38.2% retracement of the sell-off that began with the referendum vote last June (according to Bloomberg, though other sources may have a lower level on the flash crash). The slowing of the economy and the tightening of the election polls took a toll. The next target is $1.2725 and then $1.2650. The technical indicators concur that the downside is the path of least resistance, with a bearish divergence in the RSI and MACDs. |
GBP/USD with Technical Indicators, May 27(see more posts on Bollinger Bands, GBP/USD, MACDs Moving Average, RSI Relative Strength, Stochastics, )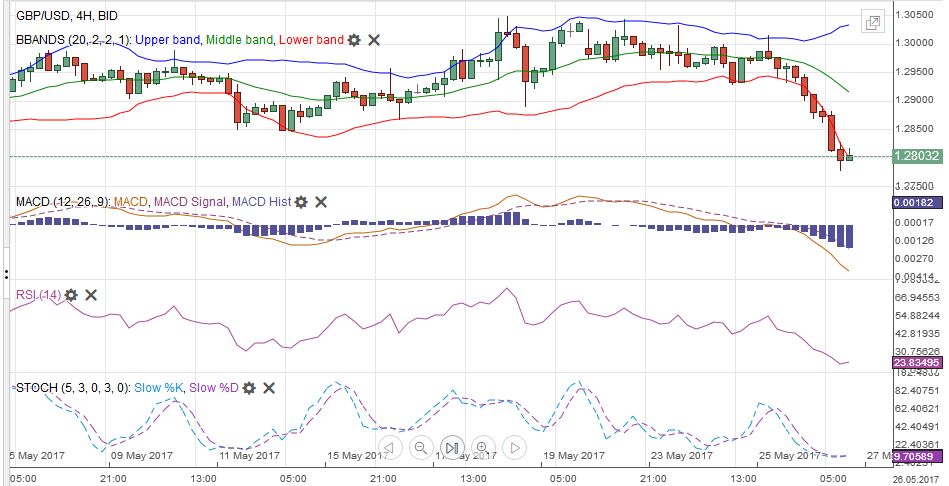 GBP/USD Week Ending May 27 with Technical Indicators - Click to enlarge |
AUD/USDThe Australian dollar looked good until May 25, when it failed to make a new high for the week and then reversed lower. There was follow through selling ahead of the weekend when the Aussie recorded new lows for the week. It held $0.7420, which corresponds to the 50% retracement objective of the rally from the May 9 low near $0.7330, but failed to overcome offers in front of $0.7460. The 61.8% retracement is found at $0.7400. If the $0.7520 area represents a small double top, a convincing break (close basis?) of $0.7445, could point to a return to that low from earlier in May. The technical indicators are mixed. Next week’s data releases are likely to be constructive, with April building approvals and retail sales picking up after a soft March. Private sector credit may slow, which may be desirable. On the other hand, capital expenditures probably increased in Q1, snapping a four-quarter slide. |
AUD/USD with Technical Indicators, May 27(see more posts on Australian Dollar, Bollinger Bands, MACDs Moving Average, RSI Relative Strength, Stochastics, )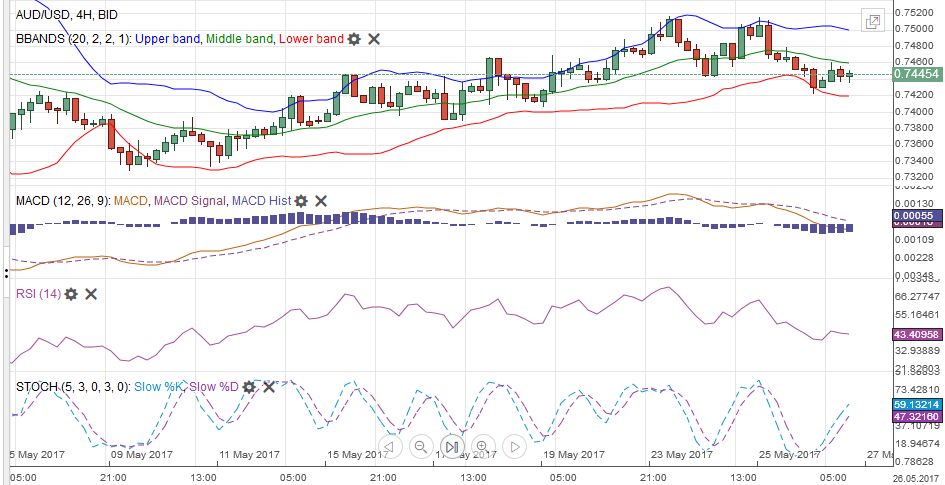 AUD/USD Week Ending May 27 with Technical Indicators - Click to enlarge |
USD/CADThe Canadian dollar traded firmer most of last week. However, there was limited follow through US dollar selling after the outside down day on May 24. The speculative market has amassed a record short Canadian dollar position in the futures market (though trimmed it by 6% in the most recent reporting week), but since May 5, the US dollar slumped almost 3% against the Canadian dollar. A break of the CAD1.34-CAD1.35 may point to the direction of the next big figure move.
|
USD/CAD with Technical Indicators, May 27(see more posts on Bollinger Bands, Canadian Dollar, MACDs Moving Average, RSI Relative Strength, Stochastics, )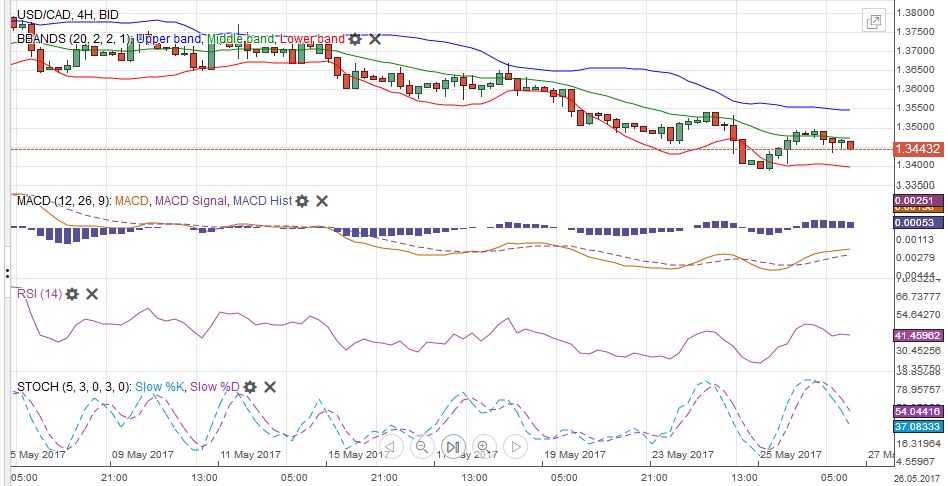 USD/CAD Week Ending May 27 with Technical Indicators - Click to enlarge |
Crude OilWith follow through selling after Thursday’s 4.8% slide, the July crude oil futures contract retraced half of the rally from the early May low near $44 a barrel. However, prices then reversed higher and retraced half of the drop from Thursday’s high of $52. The technical indicators are mixed. The narrow range seems to be $48-$52, and the broader range $46-$54 may contain prices. The challenge to OPEC’s efforts to reduce inventories to the five-year average, as if that necessarily supports prices, is that US output continues to rise. In terms of gross supply, it has added 550k barrels a day since the end of last year, or 30% of OPEC’s output cuts. |
Crude Oil, May 2016 - May 2017(see more posts on Crude Oil, )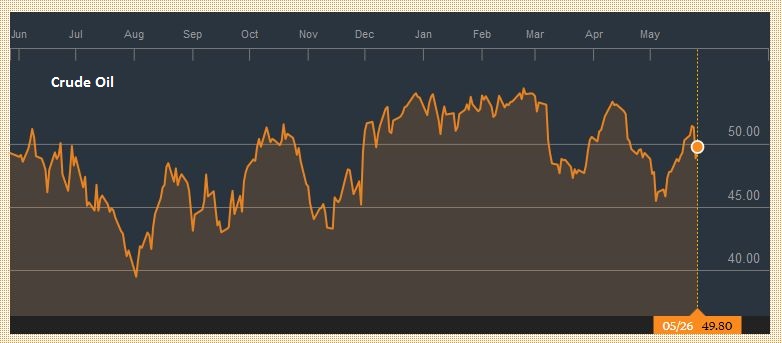 Source: bloomberg.com - Click to enlarge |
U.S. TreasuriesThe US 10-year Treasury yield appears range bound between 2.20% a 2.30%. Without stronger growth on a sustained basis (real rates) or upward pressure on prices (inflation premium), the impetus for significant movement may have to come from abroad. The 10-year futures note fell sharply in H2 16 and has spent the first five months of 2017 consolidating those gains. It has not even met the 38.2% retracement (127-09). A break of 125-24 warns that the bulls may be getting tired. Ahead of next week’s US employment data which will likely be solid even if not spectacular report is expected, there may be some pressure to square up, which given the positioning, likely entails the liquidation of longs.
|
Yield US Treasuries 10 years, May 2016 - May 2017(see more posts on U.S. Treasuries, ) Source: bloomberg.com - Click to enlarge |
S&P 500 IndexThe S&P 500 rose every day last week, extending its advancing streak to seven sessions. This means that it has rallied every day since 1.8% drop on May 17. New record highs were scored on May 25, after it gapped higher. The gap has not been filled, but the gaps from last month and earlier this month have been closed. We see the gap (2405.58-2408.01) as portending near-term weakness, but the technical indicators favor addition advances. Given the nearly universal bullish calls on European stocks and flows into emerging market funds, could it be that many are underweight US stocks or under-hedged European shares? Could that be the pain trade? |
S&P 500 Index, May 27(see more posts on S&P 500 Index, )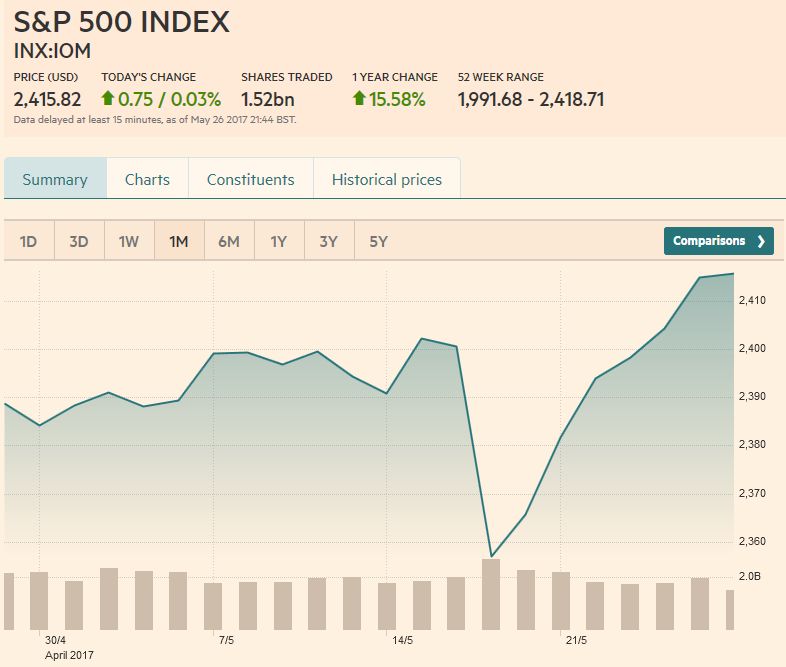 Source: markets.ft.com - Click to enlarge |
Are you the author?
Tags: Australian Dollar,Bollinger Bands,British Pound,Canadian Dollar,Crude Oil,EUR/CHF,EUR/USD,Euro,Euro Dollar,GBP/USD,Japanese yen,MACDs Moving Average,newslettersent,RSI Relative Strength,S&P 500 Index,Stochastics,Swiss Franc Index,U.S. Dollar Index,U.S. Treasuries,US Dollar Index,usd-jpy,USD/CHF,USD/JPY


