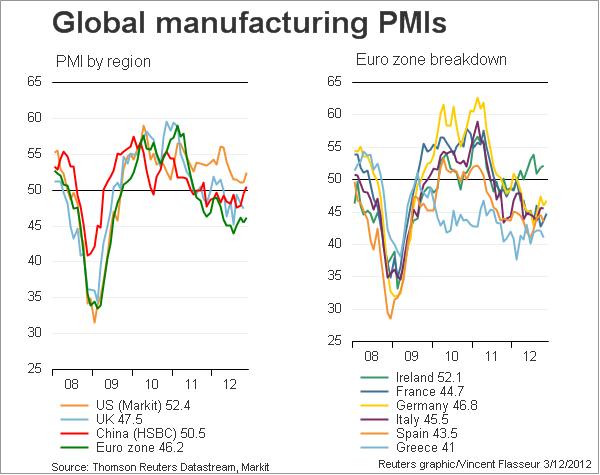
Manufacturing PMIs are considered to be the leading and most important economic indicators. Since the Fed’s QE3, this is the third month of improvements in global PMIs after a strong slowing in summer 2012.
January 25th
Expansion-contraction ratio: There are as many countries that show values above 50 as under 50.
Positive-negative-change ratio: 18 countries showed better values than the previous month, whereas only 11 had weaker ones.
Since the Fed’s QE3, this is the third month of improvements. The United States and Mexico are leading with Markit PMI of 54.2 and 54.9. According to the ISM report, however, there is a lag, production is positive, but employment is weak, which is the opposite of the Markit report for the US.
Long-time overview
China and other emerging markets came far more quickly out of the 2008/2009 recession. During 2009 and 2010, the Fed fueled the Chinese, Brazilian and other emerging markets’ recoveries and housing bubbles with cheap money. The Chinese government helped with a huge investment program. Due to the depressed housing market, the US could not recover that quickly.
In 2010/2011, Germany and the Euro zone followed the Chinese expansion thanks to strong German exports, but in 2011 rising gas and falling home prices caused the United States to slow down.
The explosion of the euro crisis and the upcoming austerity radically stopped the European expansion in the second half of 2011. European PMIs fell from 57 to 47 in a couple of months. The United States was not impressed by the euro crisis at all, but thanks to cheaper gas prices and the flow back of funds into the US, they recovered at the end of 2011. From April 2012 onwards, all global economies were weakening. This tendency could be stopped by the liquidity injection from global central banks in September 2012.
JP Morgan’s global PMIs vs. different risk indicators
| Month | Manu factur. | Services | Com posite | Michigan Consumer Confidence | S&P 500 | Copper | Brent Oil | AUD/ USD | Reference date |
|---|---|---|---|---|---|---|---|---|---|
| August 2013 | 51.7 | 56.1 | 55.2 | 82.1 | 1645 | 3304 | 115.70 | 0.9053 | Sep 3, 2013 |
| July | 50.8 | 54.9 | 54.1 | 85.1 | 1703 | 3168 | 108.93 | 0.8903 | August 2, 2013 |
| June | 50.6 | 51.3 | 52.9 | 84.1 | 1615 | 3176 | 105.85 | 0.9116 | July 3, 2013 |
| May | 50.6 | 53.7 | 53.1 | 84.5 | 1640 | 3297 | 99.92 | 0.9750 | June 3, 2013 |
| April | 50.4 | 52.1 | 51.9 | 76.4 | 1582 | 3126 | 102.85 | 1.0253 | May 3, 2013 |
| March | 51.2 | 53.2 | 53.1 | 77.6 | 1554 | 3354 | 107.17 | 1.0424 | April4,2013 |
| February | 50.8 | 53.3 | 53.0 | 73.8 | 1525 | 3508 | 110.08 | 1.0202 | March4,2013 |
| January | 51.5 | 53.4 | 53.3 | 71.3 | 1503 | 3658 | 113.46 | 1.0427 | Feb4,2013 |
| December 2012 | 50.2 | 54.8 | 53.7 | 74.5 | 1461 | 3700 | 111.42 | 1.0481 | Jan 5, 2013 |
| November | 49.7 | 54.9 | 53.7 | 82.7 | 1407 | 3656 | 110.92 | 1.0432 | Dec 3 |
| October | 49.2 | 52.1 | 51.3 | 82.6 | 1423 | 3557 | 105.75 | 1.0338 | Nov 3 |
| September | 48.9 | 54.0 | 52.5 | 78.3 | 1437 | 3775 | 108.07 | 1.0231 | Oct 3 |
| August | 48.1 | 52.3 | 51.1 | 74.3 | 1406 | 3485 | 108.07 | 1.0239 | Sep 3 |
| July | 48.4 | 52.7 | 51.7 | 72.3 | 1361 | 3307 | 106 | 1.0465 | Aug 2 |
| June | 48.9 | 50.6 | 50.3 | 73.2 | 1357 | 3466 | 97 | 1.0230 | Jul 2 |
| May | 50.6 | 52.5 | 52.1 | 79.3 | 1263 | 3289 | 98 | 0.9640 | Jun 3 |
| April 2012 | 51.4 | 52.0 | 52.3 | 76.4 | 1402 | 3782 | 116 | 1.0260 | May 2, 2012 |
| September 2011 | 49.9 | 52.6 | 52.0 | 55.7 | 1123 | 3132 | 102 | 0.9634 | Sep 2, 2011 |
| February 2011 | 57.8 | 59.3 | 57.0 | 77.5 | 1331 | 4498 | 115 | 1.0127 | Mar 2, 2011 |
sources:
Prices: Bloomberg, Investing.com
Next page: Which indicators are the leading ones?
Are you the author? Previous post See more for Next postTags: Australia,Brazil,Brent Oil,China,Composite PMI,Copper,Eurozone,France,Germany Exports,Greece,India,Ireland,Italy,Japan,Markit,Mexico,Netherlands,PMI,Poland,Purchasing Manager,Russia,Saudi-Arabia,SMI Swiss Market Index,Spain,Surprise Index,Sweden,Switzerland,Taiwan,Turkey,U.K.,U.S. Chicago PMI,U.S. ISM Manufacturing PMI,U.S. ISM Non-Manufacturing PMI,United States


