| The stock market has its earnings season, the regular quarterly reports of all the companies that have publicly traded stocks. In economic accounts, there is something similar though it only happens once a year. It is benchmark revision season, and it has been brought to a few important accounts already. Given that this is a backward looking exercise, that this season is likely to produce more downward revisions shouldn’t be surprising.
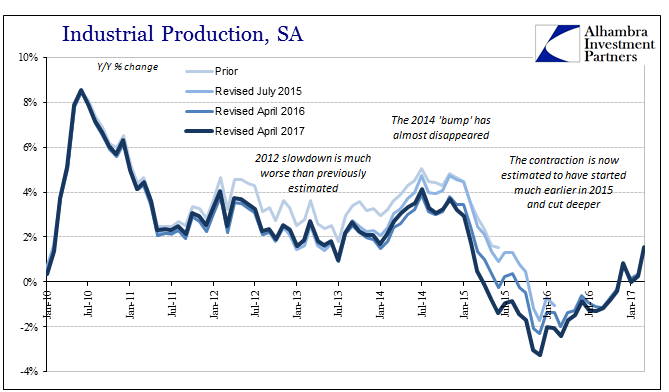
As inaccurate and unhelpful as it may seem, this is the only way to produce estimates in as close to real-time fashion as possible. High frequency data including quarterly GDP cannot be calculated in a timely fashion using more comprehensive data collection techniques. We have to sacrifice some degree for precision for timing. What has been troubling more recently is the level of accuracy that has been surrendered. We expect some revisions, but not the kind that have become normal. I wondered last month with the first of the major accounts to undergo this comprehensive reassessment, industrial production, just how much of a difference the new estimates might have made had they been included all along.
|
The Still-Shrinking 'Recovery' |
| It might have put an end to all the “transitory” nonsense that gave who knows how many false economic hope. At every turn, economist kept trying to downplay the weakness as if unimportant or contained, when via common sense it was clear there was much more to it. It doesn’t do anyone much good to belatedly confirm that interpretation several years after the fact.
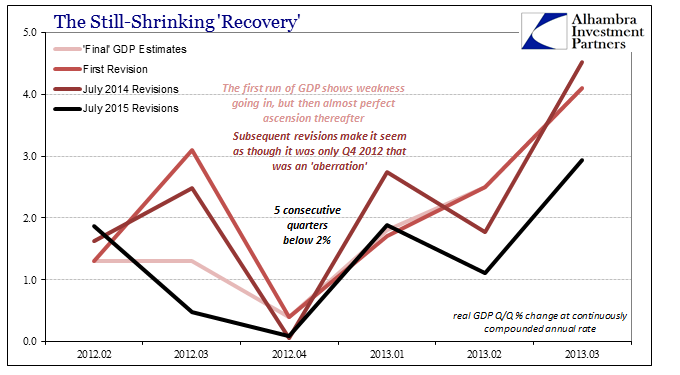
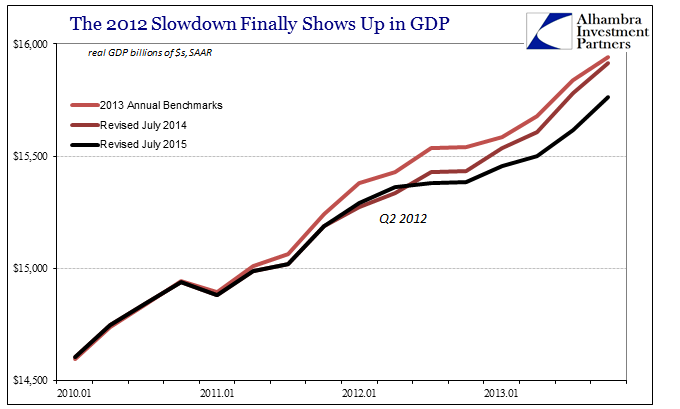
It was not the first time this has happened, of course, which is my point here. For a very long time the statistics were over-estimating the strength of the US economy during 2012 and early 2013. Perhaps the most offensive in that regard was the GDP series. According to the original GDP calculations, there was some indication of serious disturbance at that time. But at the next benchmark revisions in 2013, somehow growth estimates were revised up so that the problem in 2012 appeared to be nothing more than a single quarter – Q4 2012. It was an enormously misleading result because it appeared to confirm every mistaken preconception – that QE worked and worked quickly; that these low, near-zero quarters were aberrations; and therefore recovery was proceeding in full. The eventual correction would not be brought about until data from the 2012 Economic Census was compiled and added into the mechanical calculation processes, these greater benchmark revisions.
|
The 2012 Slowdown Finally Shows Up In GDP |
|
This regular Census Bureau survey is of a far more robust nature given its massive scope and reach. What it found was much less to a recovery that was already in question and at an extremely important time in its history.
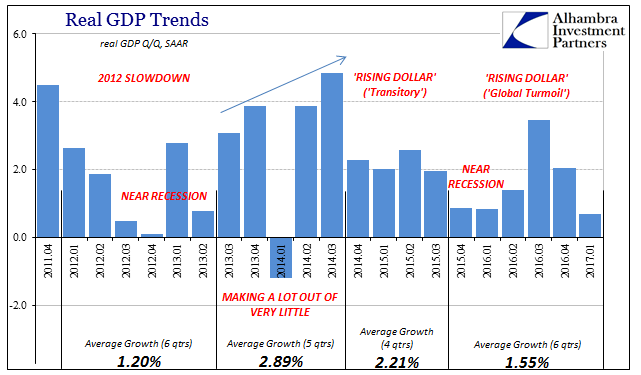
A five-quarter period of extended weakness is something that sounds all-too-familiar as if a regular feature rather than some transitory glitch. Before these revisions were made in the summer of 2015, it was widely believed that these weak quarters were, in fact, aberrations, including Q1 2014 which was dismissed as cold Canadian winds. |
Real GDP Trends, April 2011 - January 2017 |
| The truth was far harsher, as you can see below, where it becomes clear the aberrations have always been the few decent quarters rather than the near-zero ones. The miscalibration of expectations has been a cause for a great many errors, especially those on the part of policymakers.
It was an enormously important distinction (you really didn’t need GDP to tell you something was wrong, but it might have helped) when analyzing circumstances like those of 2014; and therefore is likely to be applied again interpreting where we are in 2017. In other words, if it took the BEA three years to fully appreciate and estimate the 2012 slowdown in terms of GDP, what might GDP in 2015 and early 2016 have really been? The figures for the last six quarters are already atrocious in the same way they appear now in the July 2015 benchmarks for the 2012-13 period. There would seem to be a non-trivial chance that the keepers of the accounts erred in the same manner (trend-cycle) again and so as weak as these output estimates have been since summer 2015, actual GDP may have been even worse. |
Industrial Production, January 2010 - May 2017 |
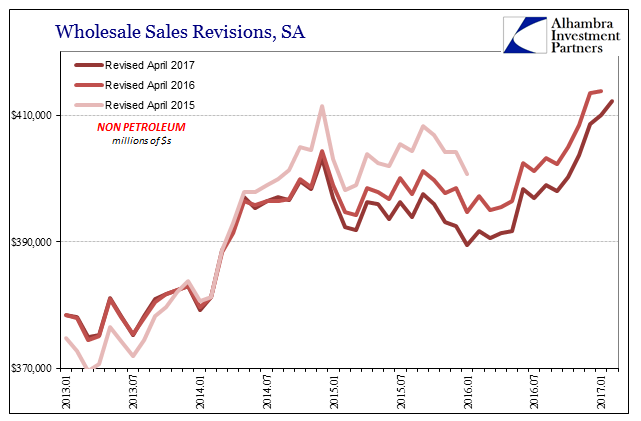
| The benchmark revisions to both Industrial Production as well as non-petroleum Wholesale Sales have already been pulled downward during that very period. Counterintuitively, an even weaker economy than it already has appeared would go a long way toward explaining the lack of momentum (especially in the labor market) so far in 2017. It’s counterintuitive only in the historical sense, meaning that before the Great “Recession” the worse the downturn the more robust the following upturn. Instead of the traditional “V” shape associated with these processes, the post-2007 world conforms to more of an “L” shaped pattern; thus the weaker it gets on the way down, the less there is on the other side of it.
It is something that we have to keep in mind when evaluating the economic circumstances where such things used to be trivial and unremarkable; if only trivial because revisions were once always unremarkable. Unfortunately, the next Economic Census (2017) is only now just getting underway, so its results won’t be ready for incorporation until (scheduled) May 2019. During all that time between now and then, we shouldn’t be surprised if the economy is even weaker than it might already seem. The experience with the 2012 slowdown in GDP and elsewhere wasn’t after all a unique event, but as with other things the first of what looks to be a repeating economic process. It might take several years, but the process in the statistics might be repeated, too. |
Wholesale Sales Revisions, January 2013 - April 2017 |
Full story here Are you the author? Previous post See more for Next post
Tags: Business Cycle,currencies,depression,economy,Federal Reserve/Monetary Policy,GDP,industrial production,industry,Janet Yellen,jobs,manufacturing,Markets,newslettersent,QE,recession,recovery


