Jeffrey P. Snider
My articles My offerMy siteAbout meMy videosMy books
Follow on:LinkedINTwitterSeeking Alpha
| Retail sales estimates are not adjusted for inflation, but even so whenever they get down toward the 3% growth level you can be sure there is serious economic trouble. The 6-month average for overall retail sales dropped below 3% in March 2001, the month that marked the start of the official dot-com recession (though that is not the official name for the cyclical peak, it probably should be). They would remain near or just less than 3% all the way until early 2003, the whole of the “jobless recovery” that convinced Federal Reserve officials more “stimulus” had been warranted even though the official end of the dot-com recession was November 2001.
In April 2007, retail sales growth, on average, fell to nearly 3% and would remain close to that mark while things began to steadily fall apart. They would rise in early 2008 as oil prices skyrocketed on misreading money, but only to an average of 4.4% and thus remaining consistently weak for more than a year before the total collapse. Three percent growth is trouble. So far this year, unadjusted data has had to overcome calendar effects that might have skewed perceptions. There is always China where the close ties between it and the US have made their way into US data around the Chinese New Year. February 2017 counted only 28 days versus 29 in the leap year of 2016, meaning that tallied sales during this February were going to be handicapped no matter what. Then there was the difference of Easter, falling in March last year but April in the current one. |
Transitory Retail Sales, January 2013 - May 2017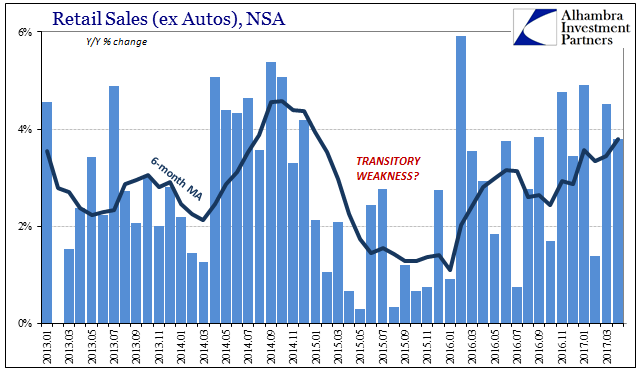 - Click to enlarge |
| With April’s retail sales numbers we can finally cut through calendars and holidays and get back to trying to assess the state of US consumers in 2017. Combined, February, March, and April 2017 sales were 3.05% more than in the same three months of 2016; those very months when for reasons including retail sales it appeared the US economy might have fallen into recession. Year-to-date, total retail sales are up just 3.5%, indicating, as always, a precarious rather than strengthening economic condition.
You would hardly know it from most commentary which unsurprisingly places “rate hikes” at its center. In that respect, not much has changed for it always for the mainstream getting better. It is a problem of interpretation derived from a lack of perspective. |
Non - Transitory Retail Sales, June 2011 - May 2017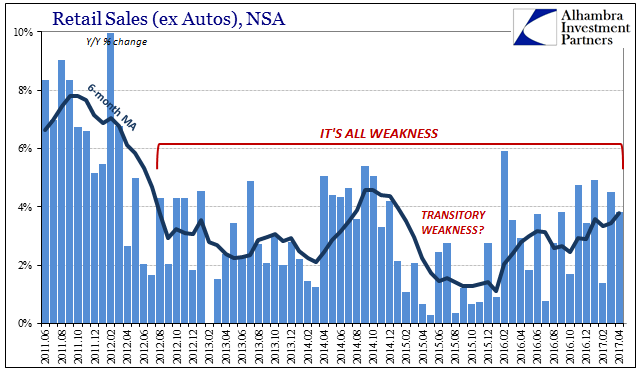 - Click to enlarge |
|
As with so many other economic accounts (and other factors), retail sales in early 2017 have started to resemble the growth rates of 2014. Thus, it might seem at first as if the serious weakness of 2015 could have been classified as “transitory”, even though in the official sense the FOMC keeps using the word after two years of it already. If there is a difference this time versus three years ago, it is that retail sales growth is much more volatile month-to-month whereas starting after the Polar Vortex in 2014 consumer spending was almost perfectly consistent.
|
U.S. Retail Sales Stagnation, January 1993 - May 2017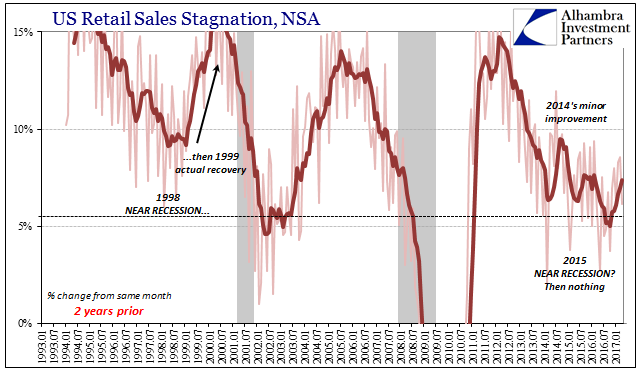 - Click to enlarge |
| This is the view that is generally presented, and it is almost identical to the one given back then. Things appear to be pointing up as temporary weakness has passed, even though this time there really isn’t any reason for it compared to 2014 that at least had the plausible explanation of QE3 (and 4).
|
Retail Sales, January 1993 - May 2017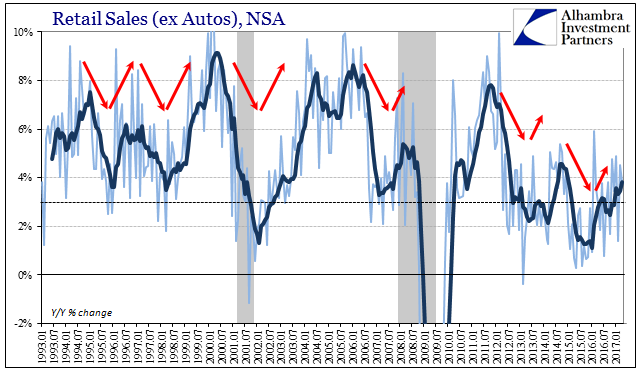 - Click to enlarge |
| A wider, more appropriate standpoint instead shows there really hasn’t been any difference to any of it. The term “weak” applies to not just 2015 retail sales, instead to all of it going back to 2012. It is this lack of more complete vision that seems to be contributing all over again to inappropriate expectations and analysis. Just as in 2014 when economists made too much of the improving growth of that year, better annual comparisons in 2017 are being stretched similarly (often way) beyond reasonable proportions. |
Retail Trade, January 1993 - May 2017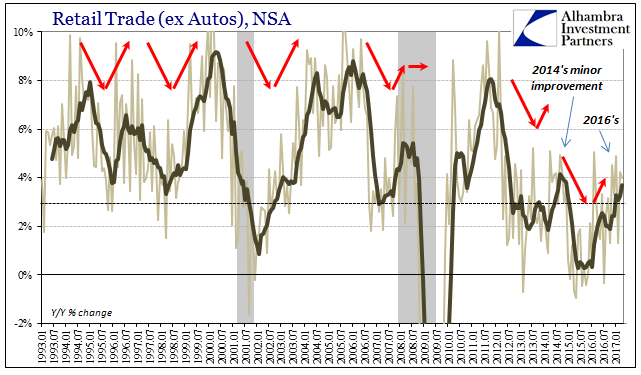 - Click to enlarge |
| In the parlance of Bernanke, there are nothing but lingering “headwinds” indicated all over retail sales despite the fact that April 2017 represents more than a year of purported progress. |
Auto Retail Sales, January 1993 - May 2017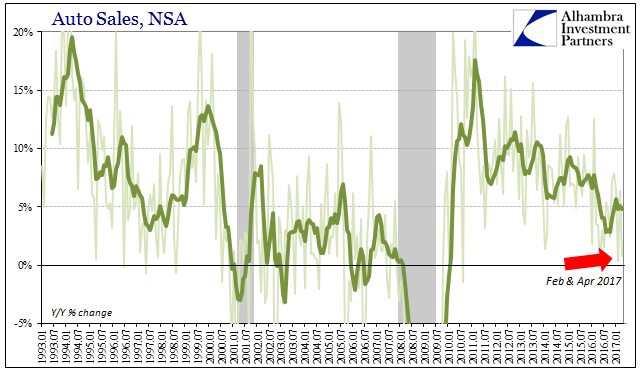 - Click to enlarge |
| Total retail sales were up just 3.12% in April year-over-year (unadjusted). Subtracting auto sales, the growth rate was only slightly better at 3.8%. Given sales data already published for the auto sector, retail sales of automobiles were almost flat in April after staging a slight rebound toward the end of last year. They were nearly zero in February, as well, meaning that in the past three months there has been little sales momentum for the auto sector that badly needs it to clear out massive inventory. Without any suggested here or elsewhere, automakers are going to have to start reducing production far more than they already have. |
Non - Store Retail Sales, January 1993 - May 2017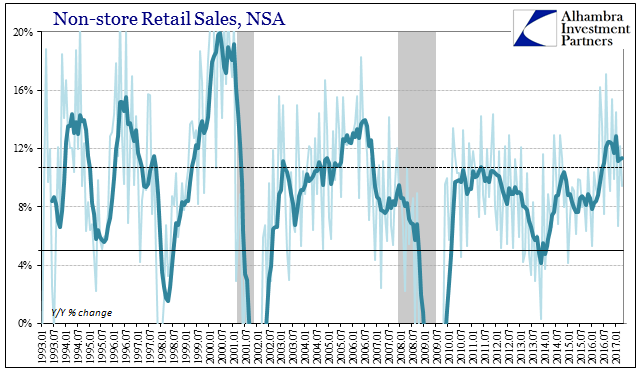 - Click to enlarge |
| Even sales growth for nonstore retailers has stalled somewhat in 2017. After blistering sales growth from the middle of last year, the expansion has become more uneven (some due to revised estimates). The 6-month average which was just about 13% in January has come back to 11.3% the past two months. That is still significantly more than either last year or 2015, but no longer carrying momentum driving these relatively better numbers in 2017. |
General Merchandise And Nonstore Retail Sales, January 1993 - May 2017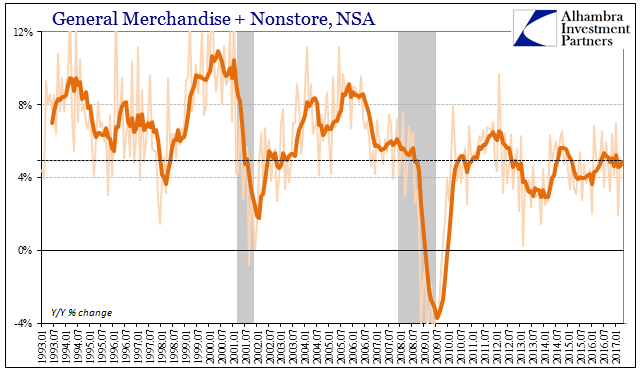 - Click to enlarge |
| As noted yesterday, retail sales were updated for their latest benchmark revisions. For the second time in a row the revisions were slightly higher overall, though have yet to be pushed back up to the benchmark versions that were produced before full inclusion of the 2012 Economic Census. |
Total Retails Sales Minus Gasoline Stations, January 1993 - May 2017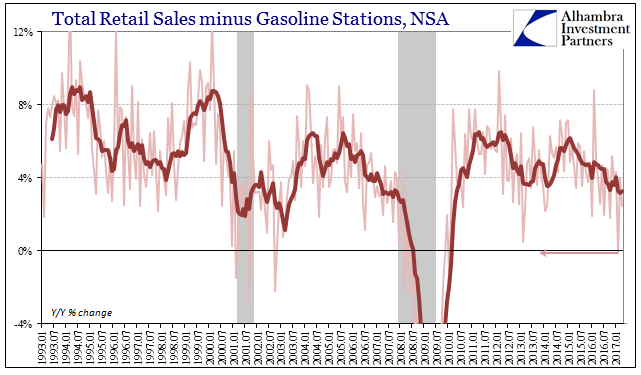 - Click to enlarge |
| Instead, we will have to wait for the 2017 Economic Census to in 2019 become part of the data stream in order to see if the current benchmarks are again being overly optimistic. |
Retail Sales Baseline Revisions, January 2007 - May 2017 - Click to enlarge |
| Instead, retail sales overall quite ably demonstrate the participation problem of the US economy, any revisions notwithstanding. The collapse in labor utilization meant the collapse in consumer spending, which meant the collapse in labor. Being unable to solve this seeming “chicken and egg” problem has left millions out of the labor force, causing unknown amounts of economic damage overseas, and the cost of all of it continuing to only rise as weakness is all that prevails. |
Retail Sales Baseline Contraction, January 2007 - May 2017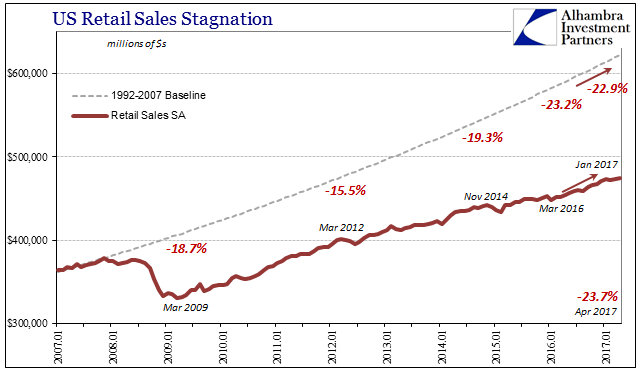 - Click to enlarge |
| Retail sales growth of 5% on average would still be contraction given these circumstances, so retail sales growth of 3% is indicative of all the same persistent problems; in other words, there really is no difference between 2016 and 2017 though there is every historical reason to expect there should be. Thus, it is nothing more than misapplying past expectations that accounts for much if not all of this year’s suite of misperceptions. The economy just hasn’t been the same for ten years, and has been truly off the past five. Therefore, there is simply no reason to expect growth is occurring without first finding solid and sustained evidence for it. |
Retail Sales Baseline, January 1992 - May 2017 - Click to enlarge |
|
It brings us back to the original premise stated at the outset. Weakness was never transitory because it is the established baseline. It is the only consistent part of this economy dating back to 2007 when retail sales fell to the 3% level the first time.
|
Payrolls Missing - Click to enlarge |
Full story here Are you the author?
Tags: consumer spending,currencies,depression,economy,Federal Reserve/Monetary Policy,Markets,newslettersent,Retail sales