Lance Roberts
My articles My offerMy siteAbout meMy videosMy books
Follow on:TwitterSeeking AlphaFacebookAmazon
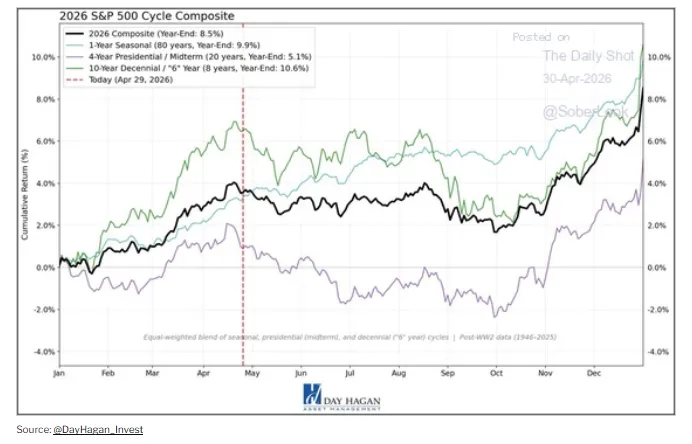
Collapsing breadth. Stretched positioning. The worst seasonal window of the year. The worst year of the political cycle. And a war that won't end. Market correction risk is stacking up.
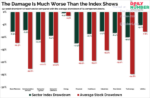
The S&P 500 hit a fresh record high last week. The median stock in the index is sitting 13% below its 52-week peak. That divergence is not a footnote or a curiosity. It's the loudest warning the market has flashed since the dot-com era, and it's arriving at the worst possible moment on the calendar. Market correction risk is climbing, and this summer it's stacked on top of three other forces that almost never converge at the same time.
After three decades of watching market cycles play out, I've learned that the dangerous moments are those in which everything looks fine on the surface and rotten underneath. That's exactly where we are right now. The market correction risk we're staring at into the summer isn't driven by a single bearish data point. It's driven by four of them showing up together, and ignoring any of them would be a costly mistake.
The Breadth Divergence Is As Bad As It Gets
The narrowness of the current rally is not opinion. It is arithmetic.
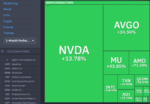
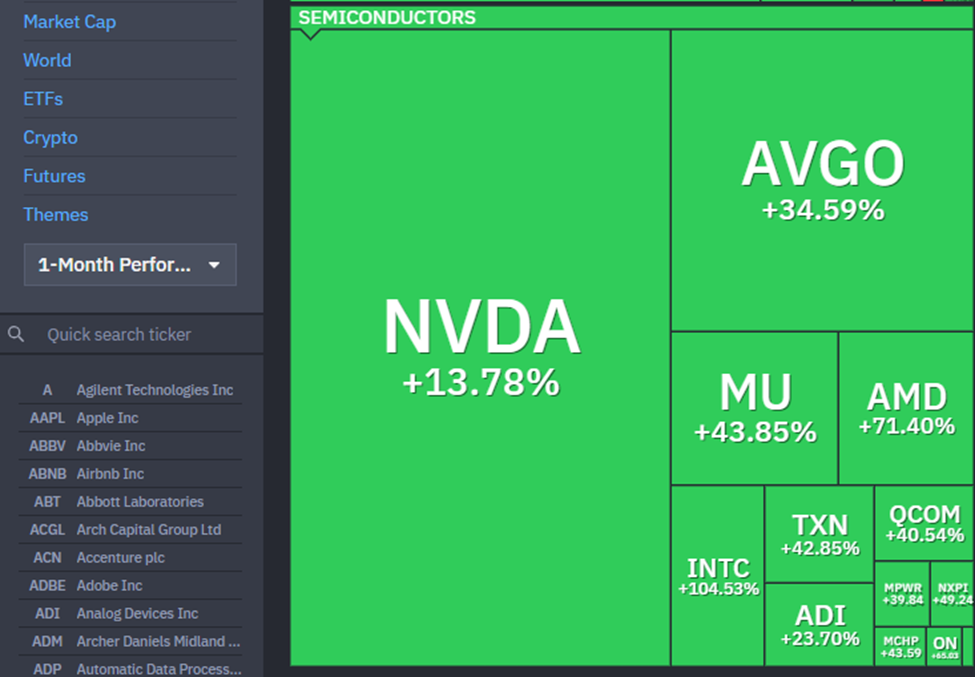
The S&P 500 has rallied roughly 14% off its late-March washout to a new high near 7,125. Look under the hood, and you find a market hollowed out. The equal-weight S&P 500 has declined about 1% over the same period. The Magnificent Seven is up roughly 10%. The semiconductor index is up 30%. Everything else is sitting on the curb.
That kind of dispersion has only happened a handful of times since 1980. Goldman Sachs' equity strategy team flagged it directly in a note this week, warning that this level of breadth has historically preceded larger-than-average drawdowns over the following six to twelve months. They're not the only ones flagging it. Hedge fund net tilt to momentum is sitting near a multi-year high, and gross leverage remains at the upper end of the five-year range. When everyone is positioned the same way and the leadership is two names deep, the unwind is never gentle.

While breadth is the headline. The supporting cast of technical signals is just as ugly.
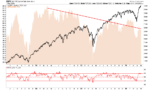
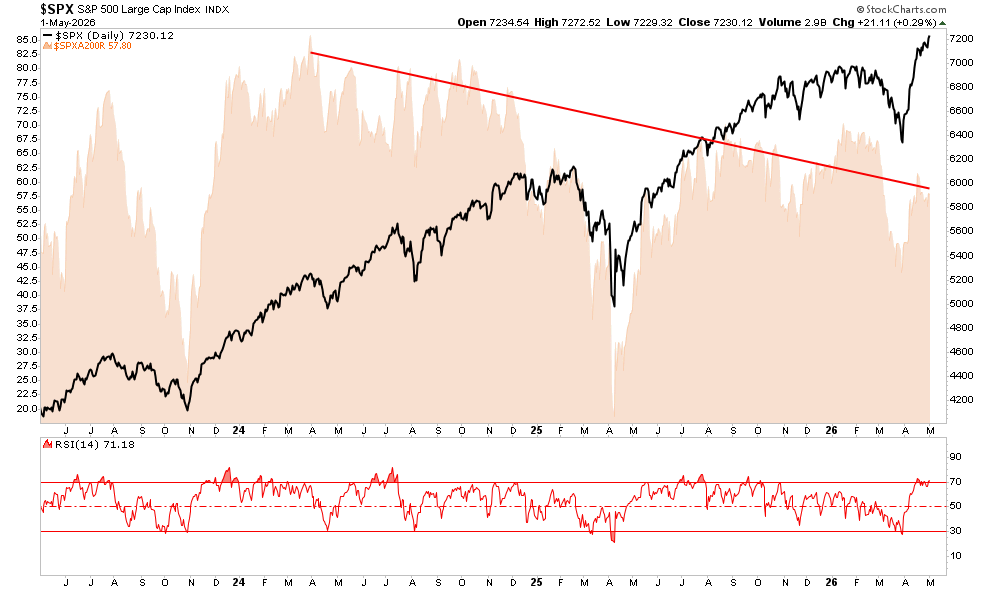
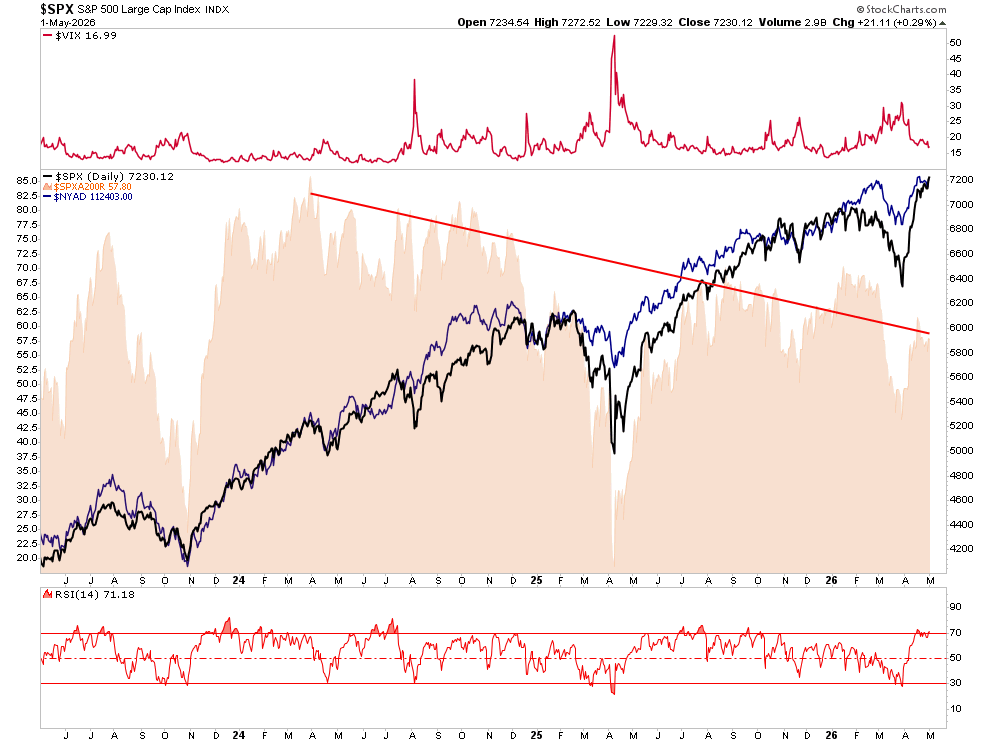
The 14-day relative strength index on the S&P 500 has spent most of the past three weeks above 70, the threshold that has historically marked overbought conditions. We've seen a textbook negative divergence: price made a new high last week while RSI made a lower high. That same pattern showed up at the January 2018 top, the February 2020 top, and the late 2021 peak. None of those were resolved kindly.

The advance-decline line for the broader NYSE has rolled over even as the index pushes higher. The percentage of S&P 500 stocks above their 200-day moving average has dropped to roughly 56%, while the index itself is printing new highs. We saw a similar decline in breadth as the market was advancing, just before the "Liberation Day" selloff in 2025.

The Volatility Index is sitting in the mid-teens, which sounds reassuring until you remember that the VIX was at 12 in January 2020 and 15 the week before the bottom dropped out. Low realized volatility breeds complacency, complacency breeds leverage, and leverage breeds unwinds. We have all three. None of these signals, individually, predicts market correction risk with precision. Together, they identify a market that has used up its margin of safety.
As we have noted before:
“Markets do not crash from euphoric tops. They crash from complacent ones, and right now we have a complacent market with collapsing breadth, deteriorating technicals, and the worst seasonal window of the year staring it in the face."

Summer Seasonality Is Real, And This Year Is Worse
The "sell in May and go away" cliche gets dismissed every spring by someone who hasn't bothered to look at the data. The data is unambiguous.
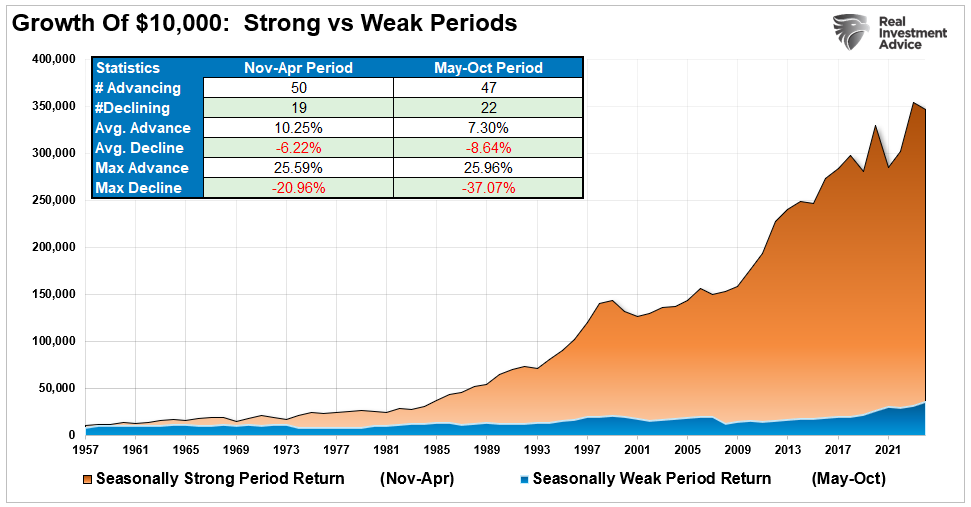
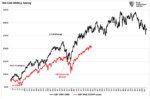
Going back to 1950, the May-through-October window has produced an average S&P 500 return of roughly 1.7%, while the November-through-April window has produced an average return of over 7%. The summer months, specifically June through September, account for the bulk of that weakness, and the historical pattern in years where the market entered May at or near all-time highs is materially worse than the long-run average.

Mathematical statistics support this: $10,000 invested in the market from November to April vastly outperformed the same amount invested from May through October. Interestingly, the max drawdowns are significantly larger during the “Sell In May” periods. Previous major market declines occurred in October 1929, 1987, and 2008.
However, not every summer works out poorly. Historically, there are many periods where “Sell In May” did not work and markets rose. 2020 and 2021 were examples of periods when massive Federal Reserve interventions pushed prices higher in April and the subsequent summer months. However, in April 2022, the decline in prices was sharp as the Fed began an aggressive campaign of interest rate hikes the previous month.
I want to be clear about something. Seasonality alone is not a reason to sell. It's a backdrop, not a trigger. But when you stack a weak seasonal window on top of collapsing breadth and stretched positioning, you've removed the natural support that usually shows up to absorb selling. Buyers thin out in the summer. Volume dries up. Volatility spikes on increasingly small catalysts. That's the setup we're walking straight into.
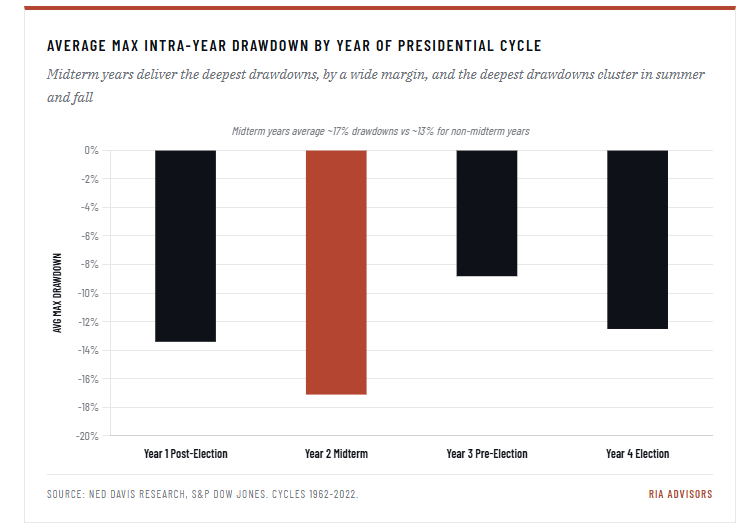
Midterm Election Years Are The Most Volatile Of The Cycle
Here's a fact that almost no one talks about until it's too late. Midterm election years are, on average, the worst of the four-year presidential cycle for equity returns and the most volatile by a wide margin. From May through October, the S&P 500 historically delivers its weakest returns of the four-year cycle, with deeper average drawdowns and more frequent corrections than non-election years.
Going back to 1962, the average maximum intra-year drawdown in a midterm election year has been around 17%, materially worse than the roughly 13% average for non-midterm years. The summer and fall of midterm years are particularly rough. The S&P 500 has averaged a peak-to-trough decline of nearly 19% between April and October of midterm election years. Then, almost without exception, the market bottomed in late October and rallied hard into year-end and through the following twelve months.
The pattern is not a coincidence. Policy uncertainty rises into November. Corporate guidance turns conservative, and fiscal posturing in Washington dominates the headlines. Capital markets dislike uncertainty, and there's no time on the four-year calendar with more of it than the summer leading into midterms. We are now six months from the November vote, and the polling, the policy backdrop, and the geopolitical overhang make this midterm cycle more contentious than most. The historical record is clear: market correction risk runs hottest during this specific window of the four-year cycle.
Iran, Oil, And The Inflation Pipeline
The market has been remarkably good at compartmentalizing the conflict in the Persian Gulf. That works until it doesn't.
Brent crude is sitting above $109 a barrel, roughlyl 40% above its level on the eve of the conflict. WTI has tracked closely behind and currently sits at ~$102 a barrel. The Strait of Hormuz remains a chokepoint for roughly 20% of global oil flows. Any escalation that genuinely threatens that transit lane is a step-function risk for energy prices. As discussed in "Hormuz," so far the market has been able to stave off the impacts of higher oil prices. However, there is a clock on that capability. The longer oil prices remain elevated, the greater the risk becomes for the market.
"The duration of the conflict, specifically when the Strait of Hormuz returns to normal shipping traffic, is the single most important variable for every downstream economic and market forecast. Here is how we frame the three scenarios:" - Bull Bear Report

The reason the math gets worse with time is that energy is the cleanest pass-through to inflation. Every $10 sustained increase in oil adds roughly 0.2 to 0.3 percentage points to headline CPI within three months. A similar amount flows into core inflation a quarter later as transportation costs feed through to goods. The Fed has been holding the line on rate cuts for exactly this reason. If the Iran situation worsens, oil pushes through $130 or $140. At that point, the case for any easing this year evaporates entirely, and the case for an actual rate hike re-enters the conversation.

That is not a market that has been priced in. Equity multiples right now are sustained on the assumption that disinflation continues and the Fed eases later this year. Take both of those legs out from under valuations, and the math gets ugly fast.

Managing Market Correction Risk
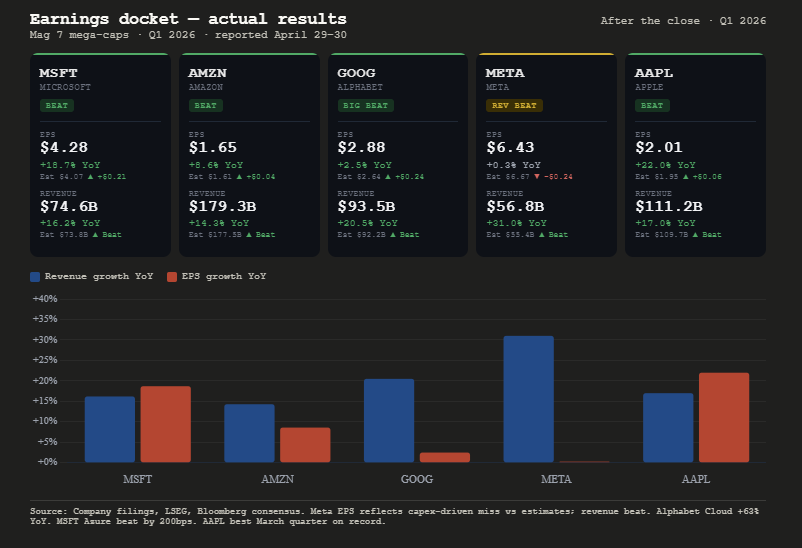
The honest counterargument is straightforward. AI capital expenditure is the single largest spending cycle the corporate sector has seen in a generation. The latest GDP for Q1 2026 showed that 75% of the growth came from capital expenditures which offset weakness in Personal Consumption which comprises 70% of the calculation.
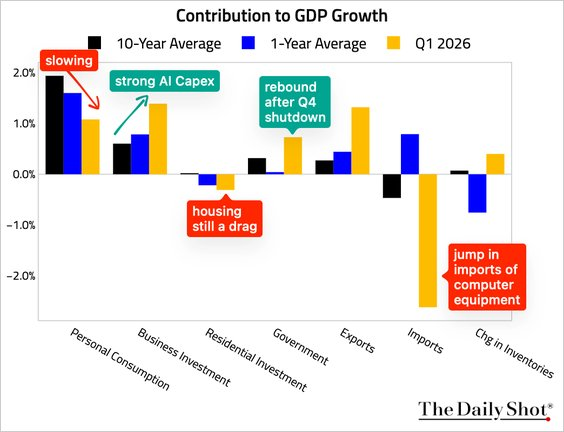
Furthermore, the hyperscaler earnings continue to come in ahead of expectations, and while the breadth problem is an issue, it can be resolved as easily through a "catch-up" of laggards as a "catch-down" of leaders. That's a real argument, and we should consider it seriously.
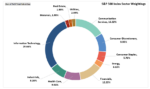
However, there's a problem with that last argument. A "catch-up" requires a catalyst, and the catalysts on the table right now are not friendly to the laggards. Consumer stocks are the largest weight outside of tech, and oil at these levels is a direct tax on consumer disposable income. Industrials and materials need an improving global growth picture, and the war is doing the opposite. Financials need a steepening yield curve and falling credit spreads, and we have neither. The path to a benign rotation runs through an improvement in the macro backdrop that I do not see arriving in the next sixty days.
The narrow leadership can extend. Goldman's own work shows the median narrow-breadth episode lasts about three months, with the late-1990s outlier stretching to over two years.
Let me be clear that I am not calling for an imminent crash. I am saying that the conditions for a sharp, violent drawdown are as fully assembled as I have seen them in a long time, and the seasonal calendar is the worst possible place to find out. As
The actionable takeaways are not exotic. They are the basics, applied with discipline.

None of these moves requires timing the top, and none of them requires a bearish call. They require recognizing that the risk-reward at this level is asymmetric in the wrong direction, and behaving accordingly.
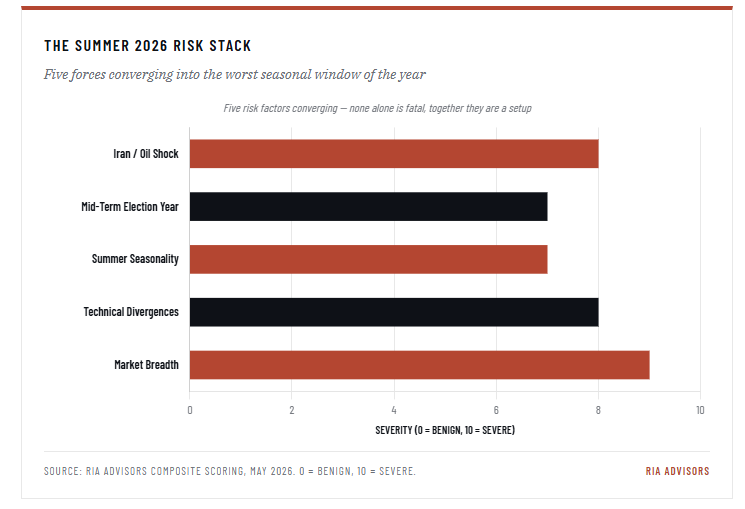
As noted above, it is crucial to remember that markets do not crash from euphoric tops, but rather from complacent ones. Currently, that complacency in the market is becoming more obvious, given collapsing breadth, deteriorating technicals, the worst seasonal and political cycles of the year, and an active geopolitical conflict driving energy prices to multi-year highs. Every one of those forces, taken alone, is something I'd flag for clients. Together, they make market correction risk between now and the November election the highest I have seen since early 2022.
I'm not telling you to get out of the market, but I am suggesting that you take some action today to mitigate the risk of tomorrow. Rebalance your portfolio, take profits, and raise cash levels while you can, on your terms.
Let me be clear about what I'm saying and what I'm not. The risks are elevated, but elevated risks are not certainty. Markets can, and often do, exactly the opposite of what every reasonable signal suggests they should, and nothing in this analysis guarantees a correction will arrive this summer. The narrow rally could extend. Iran could de-escalate overnight. The seasonal pattern could break. However, what is dangerous is doing nothing while the risk stack looks like this one.
If the market defies the odds and grinds higher into year-end, yes, you'll underperform for a stretch. That is a recoverable outcome. Underperformance can be made up through disciplined participation over the next 12 to 24 months. Lost capital cannot. A 30% drawdown requires a 43% rally just to break even, and the math gets uglier the deeper the hole. That is the asymmetry that should drive every decision right now. The investors who survive long market cycles are not the ones who catch every uptick. They are the ones who refuse to be wiped out when the setup turns against them.
The post Market Correction Risk: Why Summer 2026 Looks Risky appeared first on RIA.
Full story here Are you the author?You Might Also Like
2026-04-27
As of this writing, the Strait of Hormuz remains effectively closed since February 28. Roughly 20% of the world’s seaborne oil stopped moving through the chokepoint. The International Energy Agency described the event as “the largest supply disruption in the history of the global oil market.” Gulf producers shut in nearly 9 million barrels a day …
2026-04-20
The Iran shock erased 18% from valuations and fully recovered in two weeks. Investors who panicked missed it all. Here’s what the market lesson is about: risk management, behavior, and what to do with your portfolio right now. The stock market selloff between February 28 and April 14 produced one of the more instructive market …
 Stock Market Breadth: Warning Or Opportunity?
2026-03-30
The S&P 500 is down roughly 7% from its January 27 all-time high. Unsurprisingly, the media is full of “red” headlines discussing the seemingly “endless” correction we are in. Unsurprisingly, previously complacent investors are now anxious, as nothing seems to be working. But that index-level headline conceals something far more alarming: stock market breadth has …
2026-03-02
A specter is haunting Wall Street—the specter of the “SaaSpocalypse.” Since the iShares Expanded Tech-Software Sector ETF (IGV) peaked on September 19, 2025, it has fallen roughly 30%. For context, the broad technology indexes like XLK and QQQ are essentially flat over the same period, and the semiconductor ETF (SMH) is up 30%. Between mid-January …
2026-02-23
“China is dumping US Treasuries to get out of the dollar.” This claim has been circulating the mainstream feeds lately, with the narrative that the “end of the dollar is near,” or “the US will lose its funding base” and the “bond yields will surge.” But are those claims valid? Such is what we will …
 Market Sector Review: Extreme Market Bifurcation
2026-02-16
Since the beginning of the year, we have discussed the “reflation trade” and its impact on specific market sectors. This past weekend’s newsletter also showed some of these more extreme returns in various market sectors since the beginning of the year. To wit: “Despite what seemed like a rough week in the market, it really wasn’t as …
 The South Park Market Of 2026
2026-01-23
I have been a “South Park” fan for as long as I can remember, and while the show isn’t a market guidebook, its brutal satire cuts through nonsense better than many Wall Street commentaries. Just like on the show, characters make absurd decisions and face absurd consequences, which is familiar to investors today. For example, …
 Market Bubbles: A Rational Guide To An Irrational Market
2025-11-24
We’re hearing it everywhere: AI is in a bubble. The surge in capital, the parabolic stock charts, and the bold claims from CEOs all have a familiar rhythm. Nvidia’s valuation has soared, along with AI-related startups raising billions with little to no revenue. Investment in data centers, chips, and infrastructure is happening at a scale …
Tags: Bear Market,Featured,Investing,Lance Roberts,newsletter,recession,S&P 500,Technical Analysis