


Lance Roberts
My articles My offerMy siteAbout meMy videosMy books
Follow on:TwitterSeeking AlphaFacebookAmazon
🔎 At a Glance
- S&P Earnings Record May Be A Warning
- Market Brief & Technical Review
- From Lance's Desk: A Robot Economy: Who Gets Rich, Who Gets Left Behind - RIA
- Market stats, screens, and risk indicators
🏛️ Market Brief - Mag Earnings Accelerate Rally
The S&P 500 closed at a fresh all-time high Friday, capping a week in which the market did something remarkable: it largely stopped caring about Iran.
That wasn't recklessness. It was earnings. Five of the Magnificent Seven reported this week, and the results were, on balance, strong enough to shift the market's center of gravity from geopolitical fear to fundamental momentum. As we wrote in "Hormuz, Why The Markets Are Shrugging Off The Oil Shock," the market ultimately reprices around what matters most: earnings. We're seeing exactly that play out now.
Microsoft kicked off Wednesday's earnings barrage with EPS of $4.27, beating estimates by $0.21. The headline number was solid, but the real story was Azure. Alphabet was the star of the night. Google Cloud revenue surged 63% year-over-year against a 47% estimate, and the company's cloud backlog nearly doubled to $460 billion. Amazon delivered AWS growth of 28%, 200 basis points above consensus, though free cash flow collapsed from roughly $26 billion a year ago to just $1.2 billion as data center spending consumed capital at a historic pace. Meta beat on revenue but disappointed by raising its 2026 capex guidance to $125–$145 billion, up $10 billion at both ends, and by reporting a 20 million-user decline, partly attributed to internet disruptions in Iran. The stock fell on the news.
Then came Apple on Thursday. It was the company's best March quarter ever: EPS of $2.01 versus the $1.95 estimate, revenue of $111.18 billion against $109.66 billion expected, iPhone revenue up 22%, and Services hitting another all-time record. The stock rose, and Tim Cook confirmed he would step down as CEO on September 1, with hardware chief John Ternus succeeding him. That is a transition that, based on the market's reaction, investors appear to have accepted with confidence.
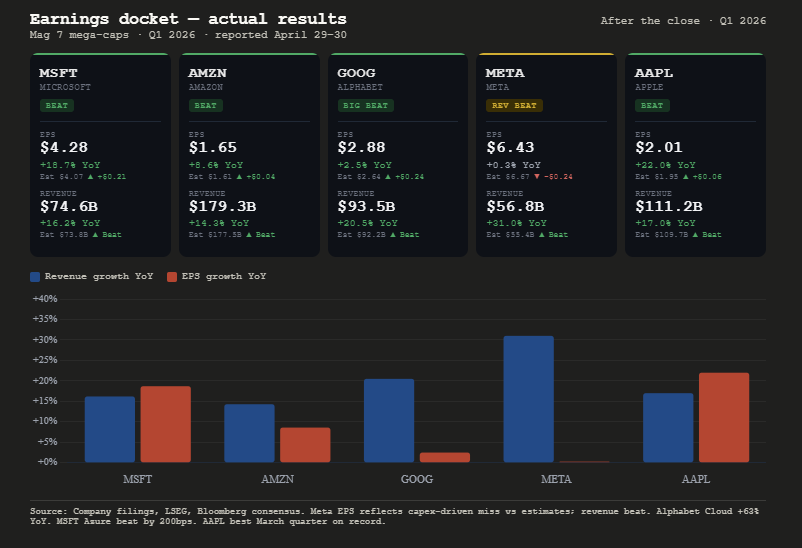
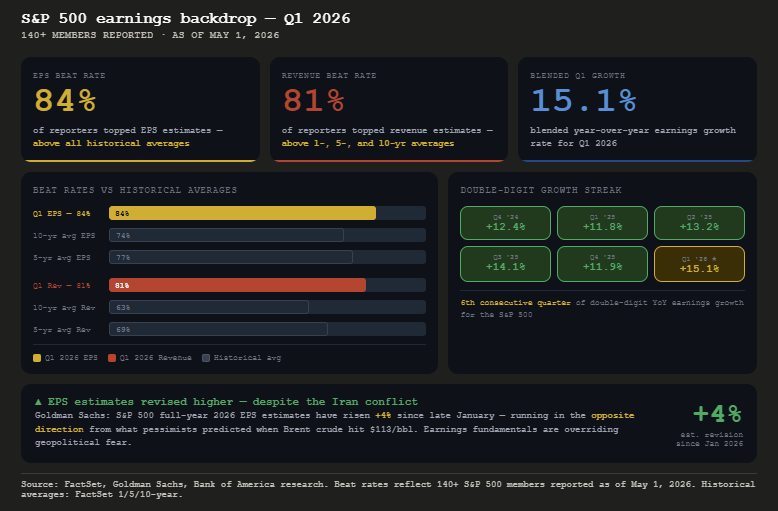
The broader earnings backdrop is even more constructive than the Mag 7 headlines. With 140-plus S&P 500 members now having reported, 84% have beaten EPS estimates, and 81% have beaten revenue estimates, both above the 1-, 5-, and 10-year averages. The blended Q1 earnings growth rate now stands at 15.1%, tracking toward the sixth consecutive quarter of double-digit growth. Goldman Sachs notes that S&P 500 EPS estimates for 2026 have risen 4% since late January despite the conflict, a revision cycle running in exactly the opposite direction from what pessimists predicted when Brent hit $113.
Which brings us back to the Iran question. The Strait of Hormuz remains technically closed. Brent crude still trades near $95–$100 a barrel. The ceasefire is fragile and unverified. And yet the S&P 500 hit all-time highs. Why? As BofA's research puts it: "Earnings estimates have continued to climb despite the conflict." The market is behaving precisely the way history says it should, discounting a geopolitical event that has not meaningfully impaired corporate earnings power. The AI capex cycle is accelerating, not slowing; combined hyperscaler spending now tracks toward $725 billion in 2026, a figure that was unthinkable twelve months ago. That capital expenditure is earnings for GE Vernova, Nvidia, Vertiv, TSMC, and the entire AI infrastructure chain, and those earnings are showing up in the actual results.
The risk is not that the market is wrong to look past Iran. The risk is that it's right until it suddenly isn't. Brent at $100 compresses margins in airlines, consumer staples, and industrials over time. A genuine diplomatic breakdown that sends oil back toward $110–$115 would test the market's new complacency. For now, though, the bull case has earned the benefit of the doubt. Corrections can come in the form of price declines or time consolidations. Currently, the market has broken out to new highs on improving fundamentals, which is not a sign of market distribution. Respect the trend, but don't abandon the risk management discipline that got you here.
📈Technical Backdrop - Pullback Likely
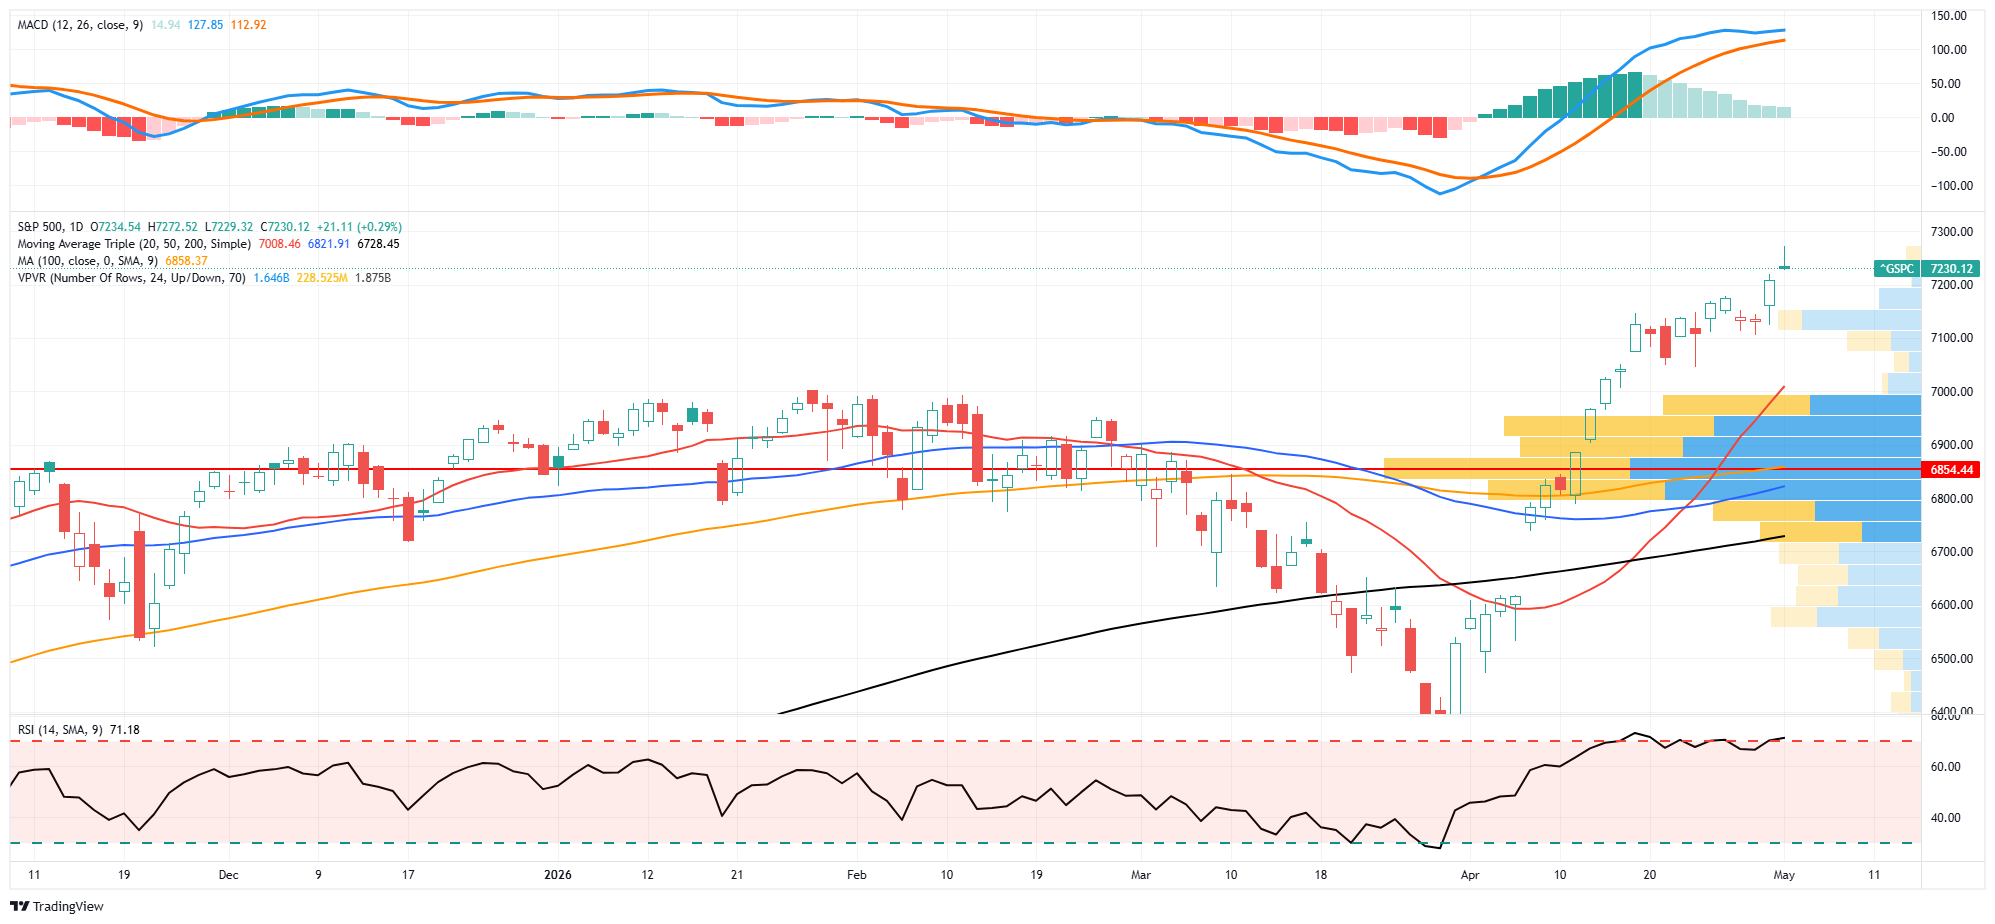
The S&P 500 closed Thursday at a new all-time high of 7,220 on Friday following Apple’s blowout earnings (+3%). From the March low of ~6,300, the index has rallied roughly 15% in five weeks, which blew through BofA’s 7,168–7,206 target we flagged as resistance just two weeks ago. Both the Nasdaq and S&P 500 posted consecutive record closes; breadth was solid in the equal-weight index; the Russell 2000 outperformed; and Q1 earnings are beating across the board.
The technical picture is unanimously bullish but increasingly stretched. According to Investing.com, 12 of 12 moving average signals are at a “Strong Buy.” The 14-day RSI sits at 71.18, touching the 70 overbought threshold, and momentum is extended and rising, but closing in on a "sell signal.". The 50-DMA has surged to ~6,821, while the 200-DMA stands at ~6,728, now 5.2% below the index. VIX is also at its lowest since January. The nuance, however, is that overbought does not mean overvalued. RSI can remain above 70 for weeks during a strong trend, and 12 of 12 buy signals means momentum is confirmed, not exhausted. But the higher it climbs, the sharper the eventual mean-reversion pullback.
The most striking feature is that the S&P 500 is hitting records while oil sits above $105, gasoline has surged 42–44% to $4.30 per gallon, and consumer sentiment hit its lowest on record. The Iran conflict remains unresolved, with Trump saying Friday that “no one knows the status of talks aside from himself.” PCE came in line, and Q1 GDP was resilient, but AI investment is carrying the load while private consumption slows. The market is pricing in a resolution: strong earnings growth, expanding multiples, and a ceasefire narrative gaining ground. But the consumer is flashing red, and the war premium hasn’t unwound. The longer oil stays above $100, the more the economic damage compounds beneath the surface. As we noted on Friday:
"The market is not pricing oil at $90 in 2027; it is pricing it at roughly $70. That is either a generational good hedging opportunity for any business that buys energy, or a generational mistake that gets corrected violently. Below is the updated three-scenario framework. The structure from March holds; the probability weights and price targets have shifted to reflect the new reality."

Time is the most important factor in the market. We are in the rare position of holding a technically perfect tape, new highs, broad breadth, all MAs flashing buy, VIX at 17, while the fundamental backdrop includes a war, $105 oil, record-low consumer sentiment, and a Fed on hold. The technicals say stay long. The fundamentals say this market is priced for perfection with zero margin for error. Both can be true. Trail stops, take partial profits, and use any pullback to the 50-DMA (~7,158) or the 7,000 level to add. The March lows at 6,300 feel like ancient history; they’re not. That was five weeks ago. Stay humble. Trade accordingly.
🔑 Key Catalysts Next Week
After last week's FOMC-GDP-Magnificent 7 earthquake, the aftershocks arrive. April Nonfarm Payrolls this coming Friday anchors the week, with ISM Services on Tuesday testing the 70% of the economy that hasn't contracted. There is also another wave of important earnings reports, led by Palantir, AMD, Disney, Arm, and CoreWeave. Those reports will either extend the post-earnings rally or expose it as a dead cat bounce. This is the week where last week's narratives get confirmed or rejected.
This weekend, Berkshire Hathaway's Saturday Q1 report and annual meeting will be watched. Buffett's macro commentary, particularly on the $373 billion cash pile, equity market valuations, and tariff/geopolitical risk, will set Monday's tone. Palantir, after the close on Monday, is the first test: the AI government-contract bellwether, with EPS expected to roughly double year-over-year and DOGE-related contract exposure under the microscope.
Tuesday is the economic pivot. ISM Services for April is the week's first high-impact data point. As noted, the services sector represents 70% of GDP and has never contracted. After ISM Manufacturing flirted with the 50 threshold for months, a services downturn would signal that the slowdown is broadening beyond factories into the consumer economy. The Prices Paid subindex is the inflation read. AMD and Arista, after the close on Tuesday, are the AI infrastructure second derivatives. AMD's MI400 chip roadmap versus Nvidia's dominance, and Arista's networking revenue will act as a validation signal for hyperscaler capex.
On Wednesday, Disney, Uber, and CVS provide the consumer sector trifecta: discretionary spending (parks, rides) versus defensive spending (pharmacy, healthcare). Arm Holdings and AppLovin, after the close, are two of the highest-momentum AI names in the market. ARM's chip licensing royalties from AI architecture and APP's ad-tech AI platform are pure plays on the AI monetization thesis.
Thursday's Q1 Productivity preliminary estimate is quietly critical. If output per hour is rising while unit labor costs fall, the Fed has its deflationary signal. If the reverse, weak productivity with rising labor costs, the stagflation case hardens and rate cuts stay off the table. CoreWeave will be the first pure-play AI infrastructure company to report after the close. GPU fleet utilization data will be scrutinized as a real-time indicator of the capex cycle.
Friday's April Nonfarm Payrolls is the week's anchor and the first clean post-FOMC labor read. March rebounded after the -92,000 shock in February. The question is whether April holds the recovery or reveals it as a one-month aberration. The unemployment rate, wage growth, and, critically, revisions to prior months will determine whether the Fed's "patient" stance is justified or whether the labor market is deteriorating faster than the committee acknowledged. UMich preliminary May sentiment rounds out the morning, with the inflation expectations signal the Fed obsesses over.

Need Help With Your Investing Strategy?
Are you looking for comprehensive financial, insurance, and estate planning services? Need a risk-managed portfolio management strategy to grow and protect your savings? Whatever your needs are, we are here to help.

💰 The Warning From S&P Earnings Blowout
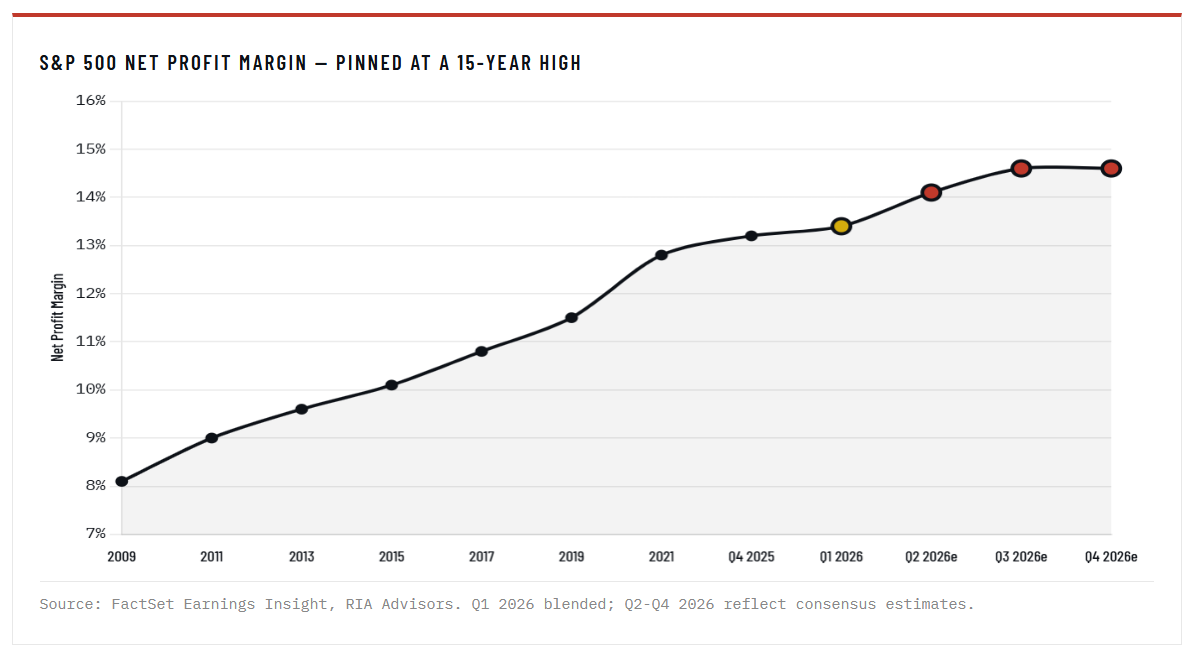
The numbers look fantastic. With more than 60% of the S&P 500 through Q1 results, blended S&P earnings growth is running at 15.1% year-over-year, on pace for the sixth straight quarter of double-digit gains. Net profit margins just hit 13.4%, the highest reading since FactSet started tracking the metric in 2009. Eighty-four percent of reporting companies have beaten EPS estimates, well above the five-year average of 78%. By the time the season closes, growth could push higher still.
Apple's Thursday print captured the dynamic perfectly: 17% revenue growth, record 49.3% gross margins, and June-quarter guidance of 14–17% against Street expectations near 9.5%. The largest stock in the index just handed analysts every reason to ratchet 2026 numbers higher, which is precisely the pattern of extrapolation this piece is about.
The problem I have is that this is exactly the kind of headline that makes me cautious.

Strong S&P earnings, in isolation, are not a buy signal. They're a description of what has already occurred, and markets discount what's coming next. History has a clear lesson about what tends to follow blowout earnings late in an economic cycle.
Going back to the 1920s, the periods of the fastest year-over-year earnings growth that preceded big stock gains were almost always recoveries from sharp recessions, when profits collapsed and then snapped back from a low base. Outside those specific setups, an inverse relationship emerges between trailing earnings growth and the next 12 months of equity returns.
The most rapid earnings growth outside recoveries clustered around July 1929. December 1973. March 2000. Late 2007. Every one of those moments felt like confirmation that the boom was real. Each one was followed by a meaningful drawdown. Now, this is not a forecast, but it is a pattern. With margins at 15-year highs and the index trading at a forward P/E above 21x, against a 10-year average of 19x, history may be starting to rhyme.
Estimates Have Run Too Hot, Too Fast
Here's where the rearview mirror becomes a forward problem. Analysts haven't just left their forecasts alone after a strong start. They've ratcheted them higher. Bottom-up consensus now calls for 2026 S&P Earnings growth of roughly 17%, with 2027 pinned in the mid-teens. For Q4 2026 specifically, the consensus is calling for 19.3% growth.
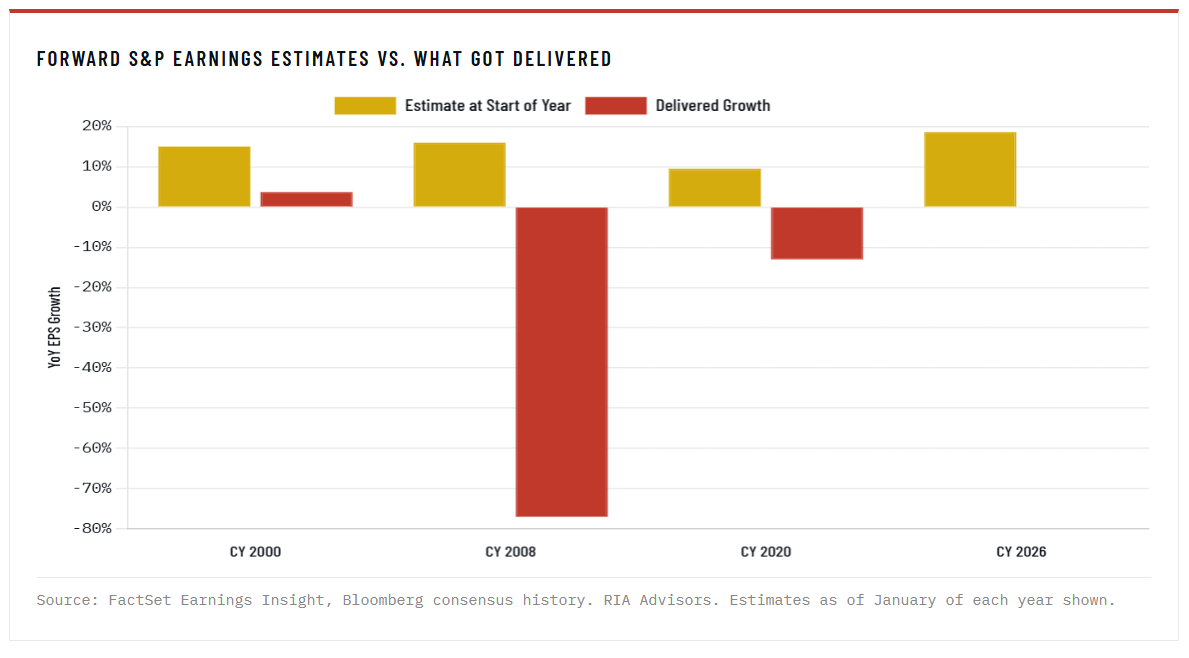
History says those forecasts almost never survive contact with reality. Going into 2000, the consensus forecast 15% S&P earnings growth, but the actual results came in below 4%. Going into 2008, the consensus was 16%. Earnings ultimately collapsed by more than 75% during the financial crisis. The crystal ball gets foggiest right when the consensus is most certain.

The bigger context becomes clear when you compare the current consensus path to the long-run norm. S&P 500 earnings have grown roughly 6.5% a year since 1950, almost exactly in line with nominal GDP, which is the only growth anchor that holds up in the long run. The 10-year trailing average sits around 8.4%. Today's 18.6% estimate for 2026 is more than double that long-run norm, and consensus expects the 2027 number to stay near 16%. The chart below frames the magnitude of what analysts are now asking the index to deliver.
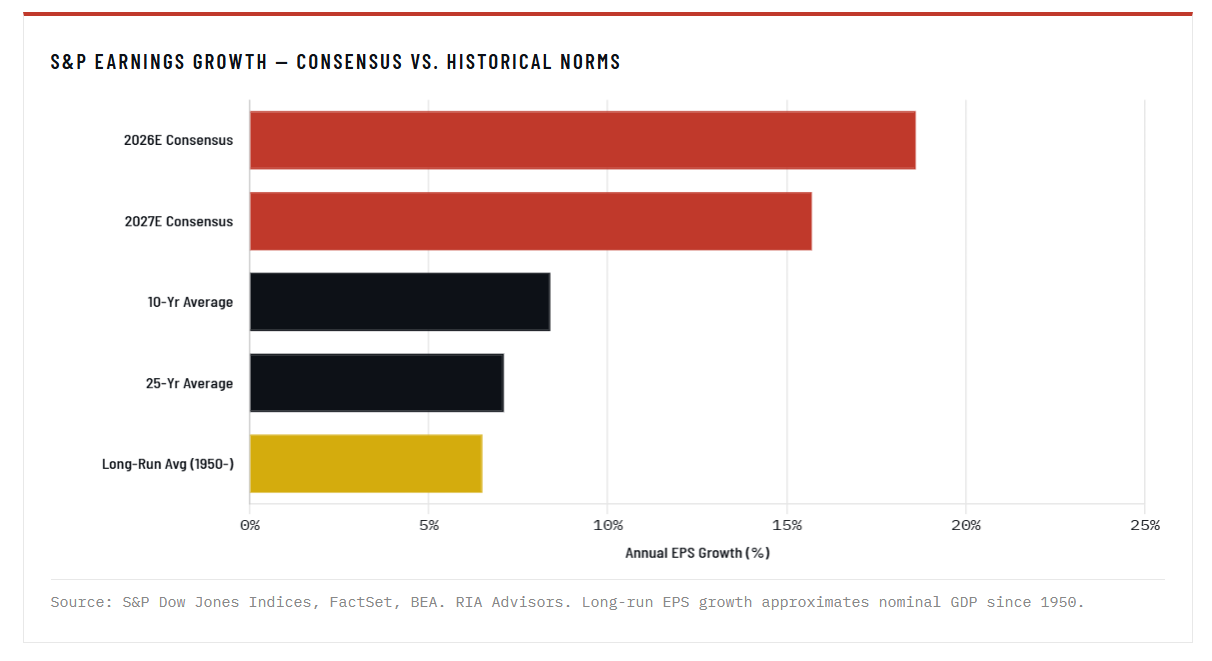
"Analysts extrapolate good times forward, then revise down when reality intrudes. With margins already at the highest level in the dataset, the bar to deliver upside is enormous."
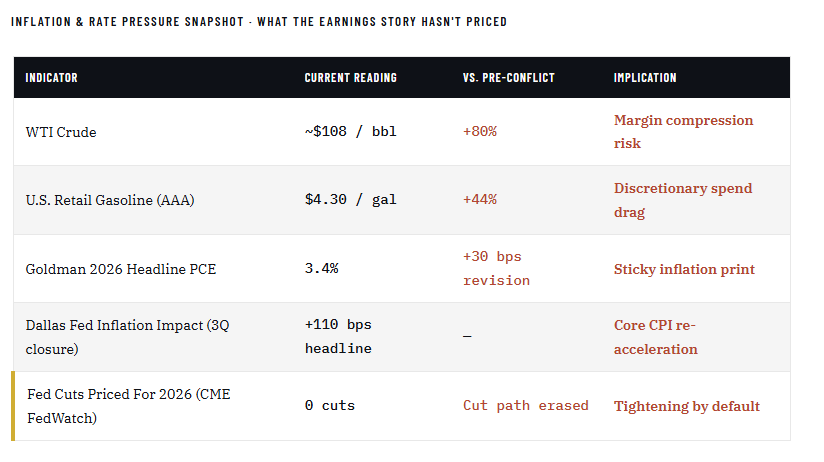
Oil, Inflation, And A Fed That Can't Cut
The bigger problem with the current S&P earnings outlook is what compresses those margins from here. The Strait of Hormuz disruption that began in late February remains effectively unresolved despite the April ceasefire, with tanker traffic still well below pre-war levels. Goldman Sachs just lifted its core PCE inflation forecast for year-end 2026 to 2.6% and headline PCE to 3.4%, adding roughly 35 basis points to core and 125 basis points to headline just from energy and Gulf-export passthrough. The Dallas Fed's framework goes further: a three-quarter closure of the Strait would add 110 basis points to Q4-over-Q4 headline inflation in 2026 and 30 basis points to core, with one-year inflation expectations rising 50 basis points into the third quarter.
That's the part the equity market hasn't priced. Fed funds futures already show zero cuts for the rest of 2026, with the target rate stuck at 3.50–3.75% and the first 25-basis-point cut not fully priced until December 2027. If oil stays elevated and inflation re-accelerates from here, the conversation pivots from "when do cuts resume" to "could the Fed actually have to hike again."
That brings us to the part of this story that almost nobody is talking about: the chairmanship transition itself.
Powell's term ends in May. That is not a future risk; that is happening this month. The market has been so focused on the cut-versus-hold debate that it has paid almost no attention to how Kevin Warsh will respond when the next inflation print lands. Unfortunately, Warsh inherits the most awkward set of conditions any Fed chair has faced in a generation: headline inflation potentially re-accelerating into the third quarter, equity markets at all-time highs with margins already at record levels, and a fiscal backdrop that gives the central bank zero room to accommodate a slowdown. There is no version of the next chair's first six months that goes quietly.
The deeper issue is the reaction function. Powell's framework is known. Traders have spent four years calibrating their models to how he weighs employment versus inflation, when he leans on financial conditions, and how he uses the dot plot. Warsh starts that calibration from zero. The first FOMC meeting under new leadership will be the highest-stakes communication event of the year, and the market historically struggles with reaction-function uncertainty.
The transition pattern itself is worth noting. Major leadership transitions at peak valuations have a checkered historical record. Welch to Immelt at GE. Gates to Ballmer at Microsoft. Greenspan to Bernanke in February 2006, just as the housing market was peaking. Apple's announcement Thursday of a Cook-to-Ternus CEO transition slots into the same pattern. Two of the most consequential leadership handovers in markets, at the largest stock in the index and the central bank that sets the global cost of capital, are happening within weeks of each other, with the index trading above 21x forward earnings on consensus estimates that history says are too high. That is not a forecast. It is a description of where we sit.
An index priced for 18% earnings growth, against a Fed reaction function nobody has calibrated yet, is a setup for disappointment from both directions. If Warsh signals continued restraint, equity multiples have to absorb a higher-for-longer message that is not in the price. If he signals premature accommodation, the inflation trade reignites, and the long end of the curve does the tightening for them. There is no clean path through the next six months.
What Could Break The S&P Earnings Story
Three things would do real damage to the consensus 2026 number.
- First, sustained oil prices above $90 starts pulling consumer discretionary spending into gasoline. That hits every margin assumption built into staples, retail, restaurants, and travel. The Energy sector benefits, which is why analysts now project 35%-plus growth in that bucket through Q1 2027, but Energy is roughly 4% of the index. Discretionary, Staples, and Industrials together are far larger.
- Second, if inflation re-accelerates, the Fed's hands stay tied through the back half of the year. Real rates remain restrictive longer than the curve assumes, and refinancing waves in commercial real estate and high-yield credit get harder, not easier. Earnings for financials and rate-sensitive segments come under pressure.
- Third, margins themselves don't have much room to expand. At 13.4%, the net profit margin is already the highest since FactSet started tracking in 2009. Analysts are calling for 14.6% in Q3 and Q4. Companies don't need a recession to miss those numbers. They just need wage growth to keep running ahead of pricing power, or input costs to rise faster than they can pass through. Both are now plausible.
Even with all of these factors, the markets remain near all-time highs, at least for now, as the bulls remain solidly in control. However, as is the nature of the market, reversals can come quickly, and control of the market can switch just as fast. Therefore, we need to be aware of the risks, think tactically, and take proactive steps in our portfolios as we head into summer.
Tactical Positioning Into A Mid-Term Election Summer
Mid-term election years carry a well-documented seasonal pattern. From May through October, the S&P 500 historically delivers its weakest returns of the four-year cycle, with deeper average drawdowns and more frequent corrections than non-election years.

Combine that pattern with stretched valuations, optimistic S&P earnings revisions, and an unresolved oil shock, and the asymmetry tilts hard toward defense. With that in mind, here are seven concrete actions to take heading into the seasonally weak window.

The headlines will keep cheering S&P earnings beats through May. However, after that, the focus returns to the economy, inflation, and Fed policy. By July, the question won't be whether earnings beat estimates. It'll be whether your portfolio survived the gap between consensus optimism and what the Fed actually has to do.
🖊️ From Lance’s Desk
This week's #MacroView blog examines the potential impact of robots in the economy, the policy measures to consider, and how to invest in it today.

Also Posted This Week:
- BDCs: Not All Yield Is Created Equal - RIA - by Michael Lebowitz
- Hormuz: Why Markets Are Shrugging Off The Oil Shock - RIA - by Lance Roberts
📹 Watch & Listen
In this week's video, we discuss the recent market consolidation and why a breakout is possible.
Subscribe To Our YouTube Channel To Get Notified Of All Our Videos
📊 Market Statistics & Analysis
Weekly technical overview across key sectors, risk indicators, and market internals

💸 Market & Sector X-Ray: Market Cracks Support
Last week, we noted that: "With the market now rebalanced, we should see markets return to a more normal trading environment. Markets are getting overbought, so rebalance risk as needed." That remains the case this week, as the distribution of the market continues, trimming overbought sectors and adding to oversold areas.
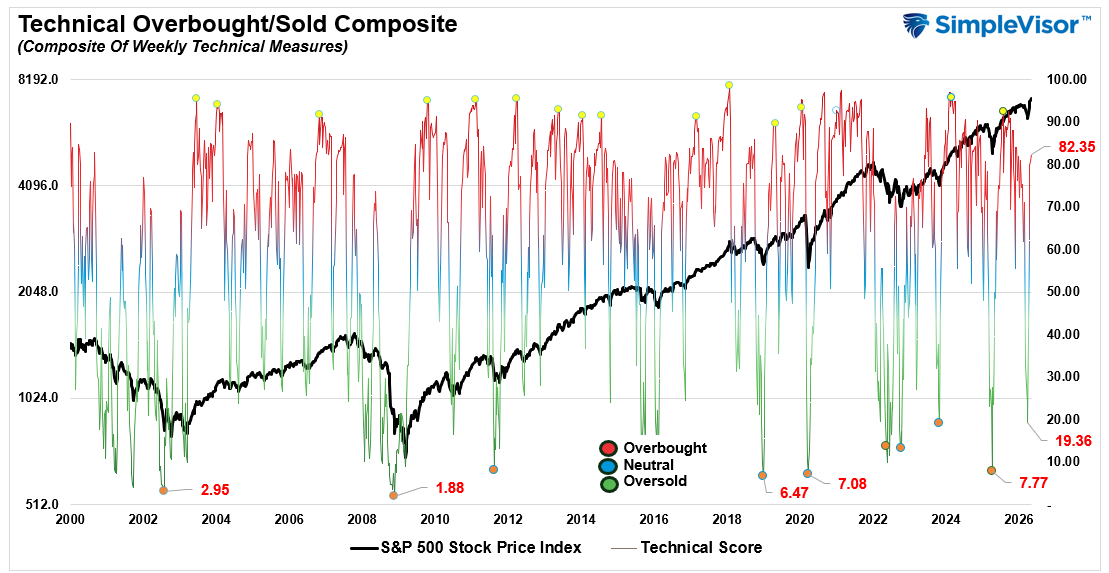
📐 Technical Composite: 82.35 - Market Surge Approaching Overbought
As noted previously, the reflexive rally came hard, with the market posting its best performance since March 2022. We are approaching overbought levels, but not there yet. Use this rally to rebalance risk and exposures as needed
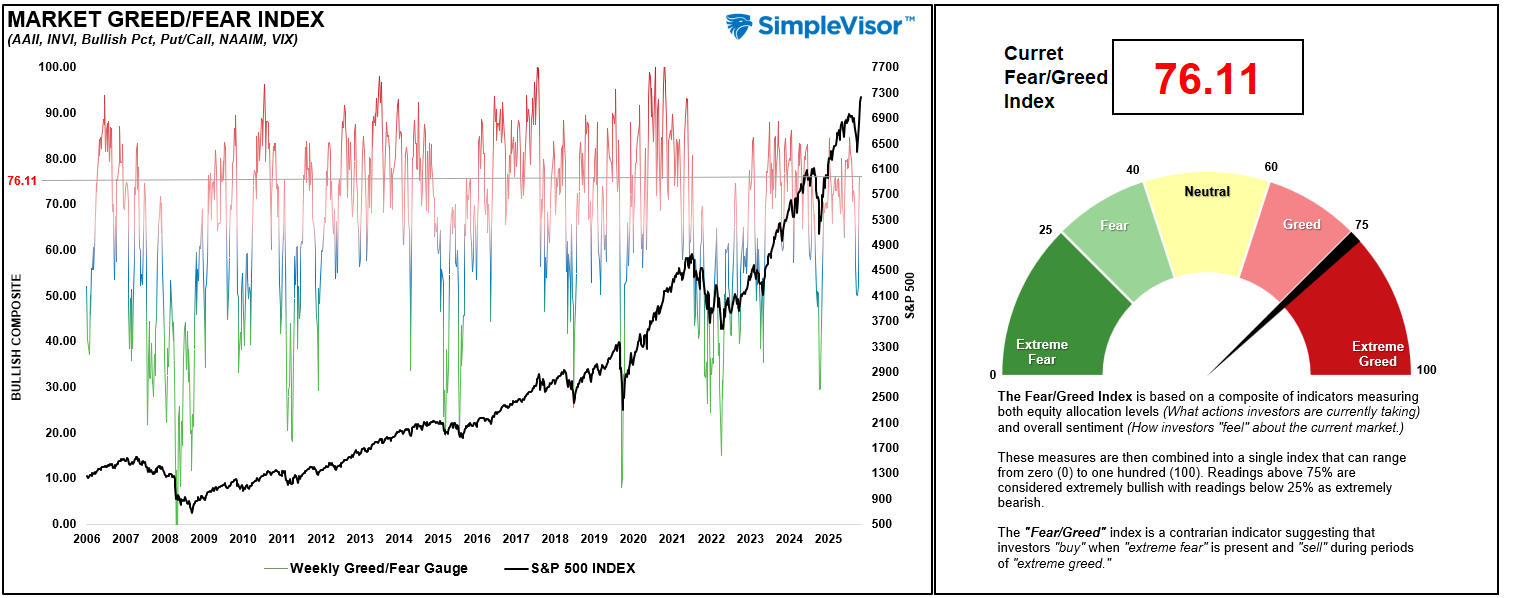
🤑 Fear/Greed Index: 76.11 – Pushing Extreme Greed
As we noted last week, the reflexive rally came with a vengeance, and investor sentiment and positioning went from"fear" to borderline "extreme greed" in a very short time frame. There is now decent momentum behind the market, but if you didn't like the recent selloff, this is a good time to rebalance risk and portfolio allocations.
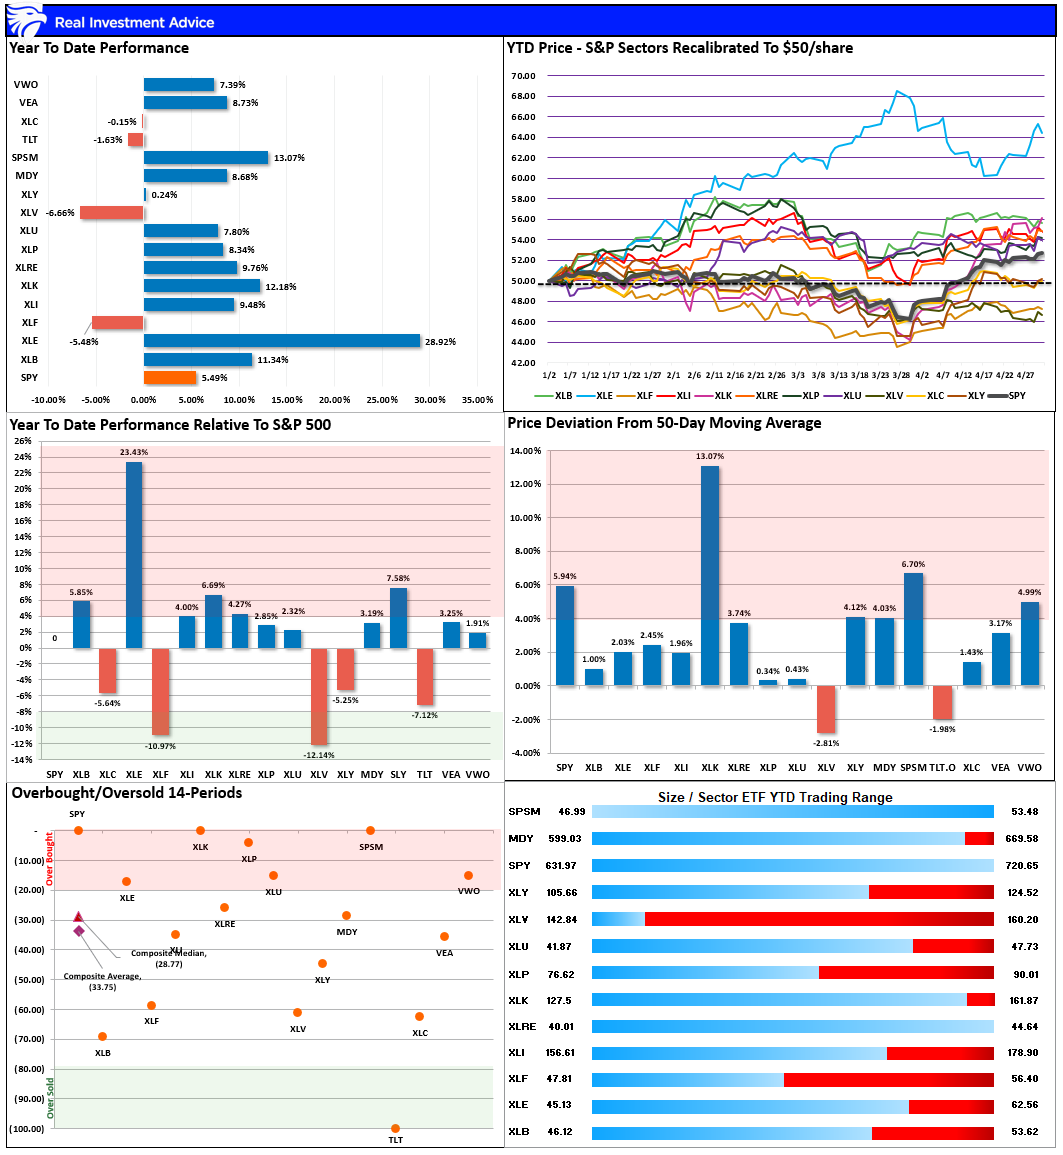
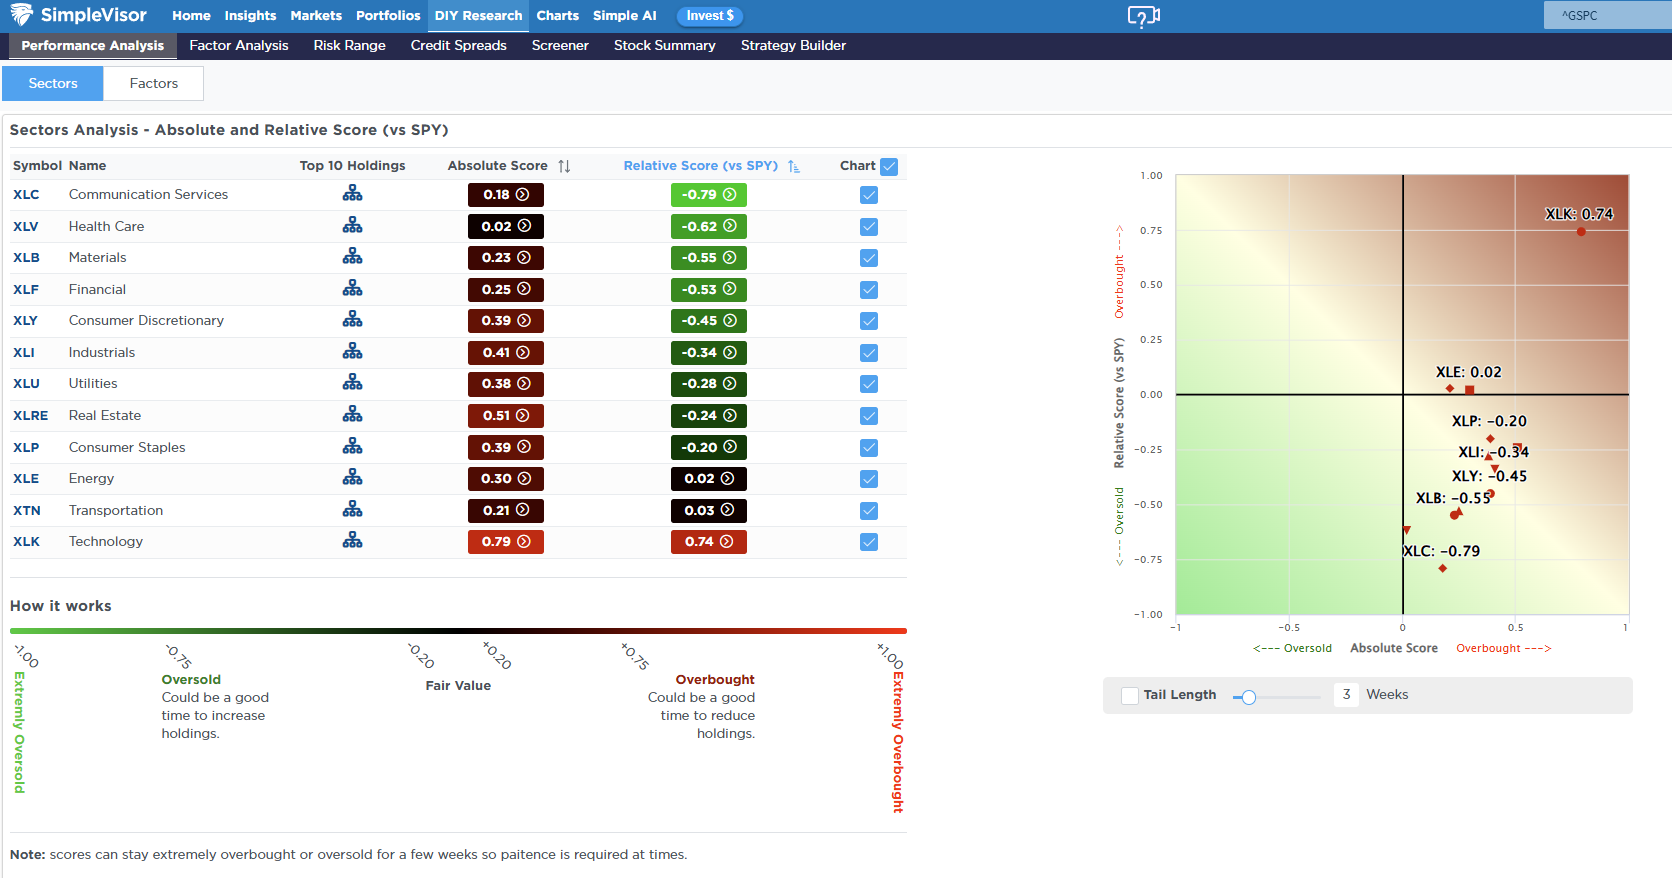
🔁 Relative Sector Performance
It didn't take long, but the previous most "out of favor" sector, Technology, has reverted to the most overbought, while Communications and Healthcare are now the most out of favor. Given the fundamentals of these two sectors, I would expect a short-term reversion from Technology to Financials, Communications, and Healthcare if the market takes corrective action.
📊 MFBR Index (Money Flow/Breadth Ratio Indicator): 45% = Neutral/Bullish
NEW! MFBR Index: The Money Flow Breadth Ratio (MFBR) model is a rules-based equity allocation framework that uses weekly S&P 500 money flow data to generate buy, sell, and neutral signals. It is designed to systematically adjust portfolio equity exposure in response to the direction and persistence of institutional capital flows, aiming to reduce drawdowns while capturing the majority of market upside.
"As of May 1, 2026, with the S&P 500 at 7,230.12, the Money Flow Breadth Ratio (MFBR) stands at 50% and rising. This places the indicator in the 50-60% range, triggering an OVERRIDE - Flow Surge signal. The prior week's reading was 45%, a 10% decline from the preceding 4-weeks. The model currently recommends increasing equity exposure aggressively, targeting an equity weight of 100%. This reflects a FLOW-OVERLAY OVERRIDE: the trailing 4-week net dollar flow has swung sharply positive (>$300B) after a deeply negative prior 4 weeks, a historically strong contrarian buy signal.
Flow-overlay override is ACTIVE and locks full equity exposure for up to 4 weeks. The model's 25-year backtest shows this signal captures major post-correction rallies that breadth-only readings miss. This override is rare and time-limited (4-week lock). Monitor for signs of follow-through confirmation."

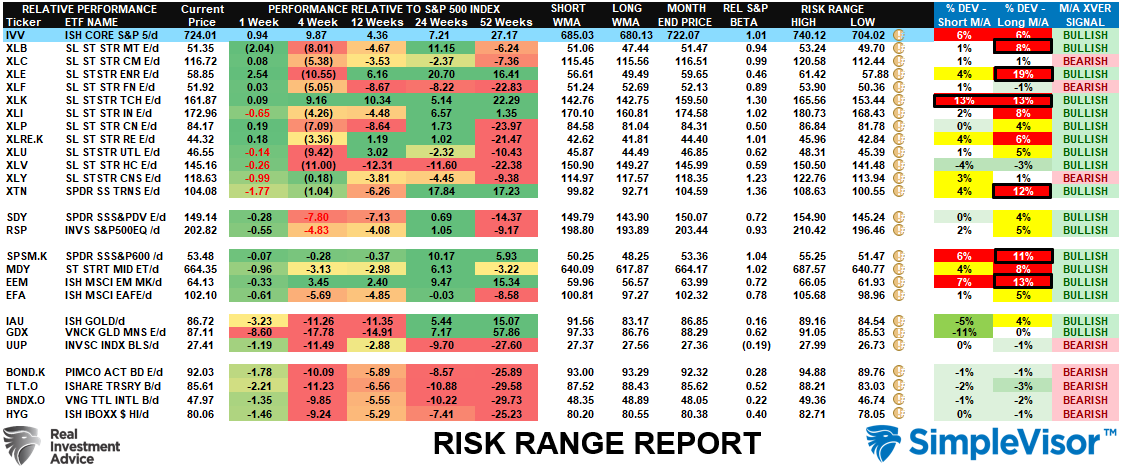
📊 Sector Model & Risk Ranges
As we noted last week, "The good news is that the market has recovered and the bulls are back in control. The bad news is that there are numerous extreme deviations from long-term weekly means. Basic Materials, Energy, Technology, Transportation, Small Caps, and Emerging Markets are all 10% or more above their long-term weekly means, which generally precede mean-reversions. Take profits and rebalance accordingly." That remains the case this week, as well.
Have a great week.
Lance Roberts, CIO, RIA Advisors
The post S&P Earnings Record May Be A Warning appeared first on RIA.
Full story here Are you the author?You Might Also Like
 Nicoletos: AI Makes A Case For Active Strategies
2026-05-06
Michael Nicoletos wrote a thoughtful paper titled “The Index Trap,” making a compelling case that active investing, i.e., picking individual stocks versus buying baskets of stocks (ETFs), will outperform in the future. If correct, that would reverse the trend over the last two decades, in which investors increasingly relied on passive investment strategies. The following …
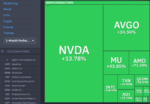 NVDA To CPU Rotation: Durable Thesis Or Crowded Trade?
2026-05-04
The semiconductor leaderboard has quietly flipped over the past month, and the NVDA to CPU rotation is worth pausing on. NVDA, the name that defined the AI trade for two-plus years, is up just 13.4% over the trailing month. The CPU cohort has run circles around it. AMD has ripped 70.4% higher, MU has added …
 Powells Coda: Dissension In The Ranks
2026-04-30
Presuming Kevin Warsh’s nomination as Fed Chair is approved by the Senate, as is widely expected, yesterday’s FOMC meeting was Jerome Powell’s last as its Chair. However, he will stay on as a voting Governor. As he explains: Things that happened in the last 3 months left me no choice but to see them through …
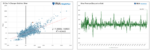 Silver Math: Gold Warns Of Silver Correction
2026-01-23
Over the last few months, we have questioned the dollar debasement narrative. However, in this commentary, we suspend our views and assume that debasement is real and, further, that it fully explains why gold and silver are rising rapidly. The goal of this exercise is to use gold returns and math to find a fair …
 What Does Kevin Warsh Bring To The Fed?
2026-01-21
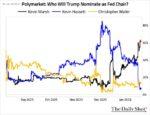
It appears that President Trump wants Kevin Hassett to remain in his role at the White House. With the supposed frontrunner to replace Powell out of the running, the nomination now seems open to Kevin Warsh. As the graph below shows, Polymarket bettors are assigning 60% odds that Kevin Warsh will be nominated.
Tags: Featured,newsletter


