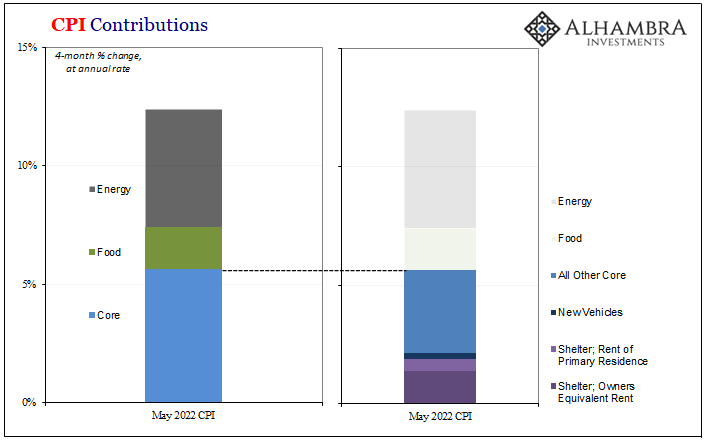
| While the world fixated on the US CPI, it was other “inflation” data from across the Pacific that is telling the real economic story. Having conflated the former with a red-hot economy, the fact American consumer prices aren’t tied to the actual economic situation has been lost in the shuffle of the FOMC’s hawkishness, with markets obliged to price wrong-way Jay.
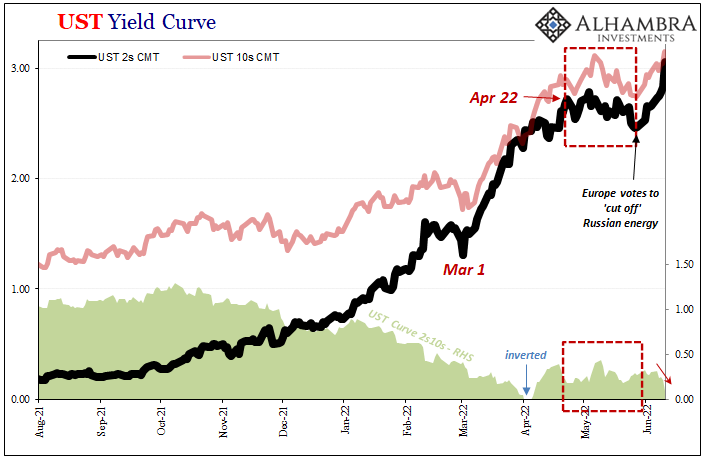
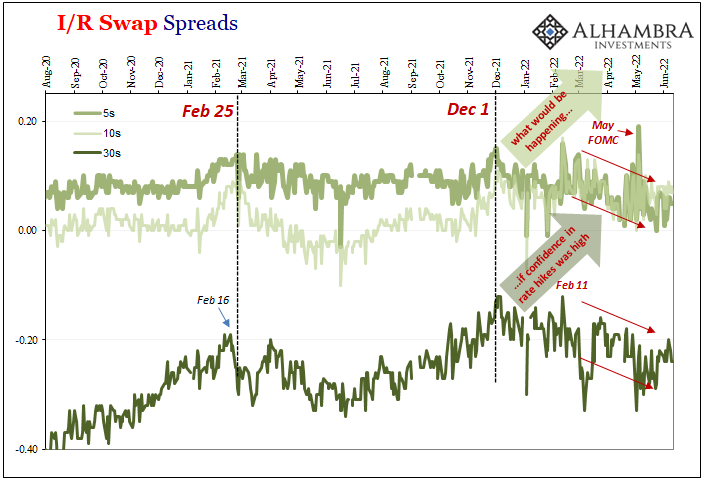
The short end of the yield curve (USTs and elsewhere) is plotting like FOMC dots, whenever oil and crude factors raising the ceiling maybe short-term duration of the Fed’s rate hikes. Since these are pure theater, the curve’s far end is looking elsewhere for what the economy is really about. |
|
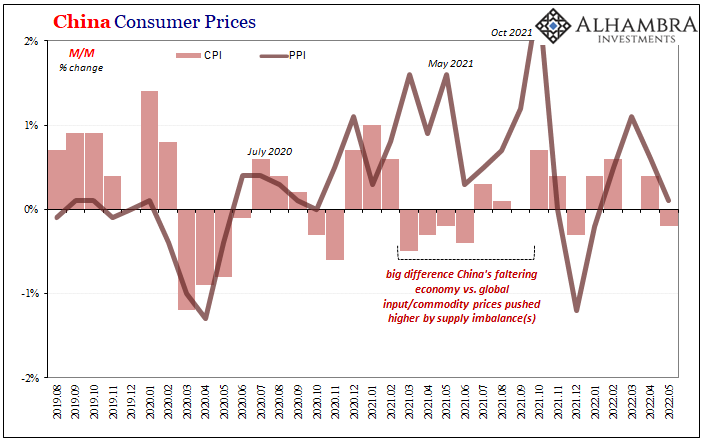
| Inversion is simply these two competing sets: Fed playing inflation-fighter for the cameras pushing up short-term bonds as the market attempts to gauge just how much onrushing weakness the FOMC will be able to ignore (by focus on the CPI) from the very real recession risks rising globally.What’s most compelling as to those recessions risks when it comes to the most recent May 2022 data from China is that it covers Shanghai (and other places) on its reopening. Yet, consumer prices over there fell last month when compared to April. According to the NBS last week, the Chinese CPI dropped 0.2% month-over-month.
Compared to May 2021, the index has increased just 2.1%, the same year-over-year rate as April. |
|
| Unlike what it looks from the perspective of US or European CPIs, there’s no mistaking the downturn across China all throughout last year. | |
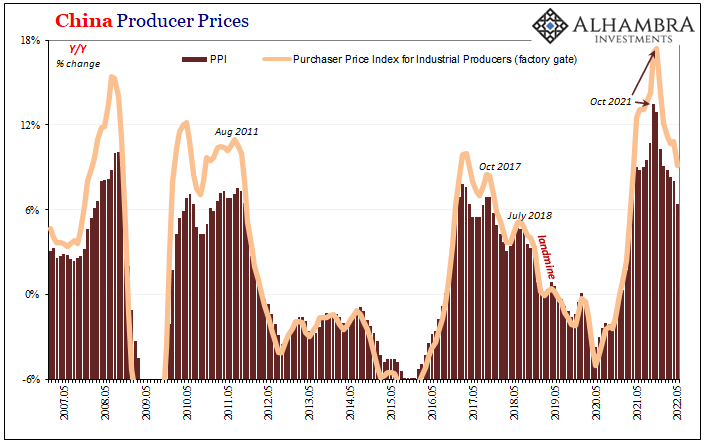
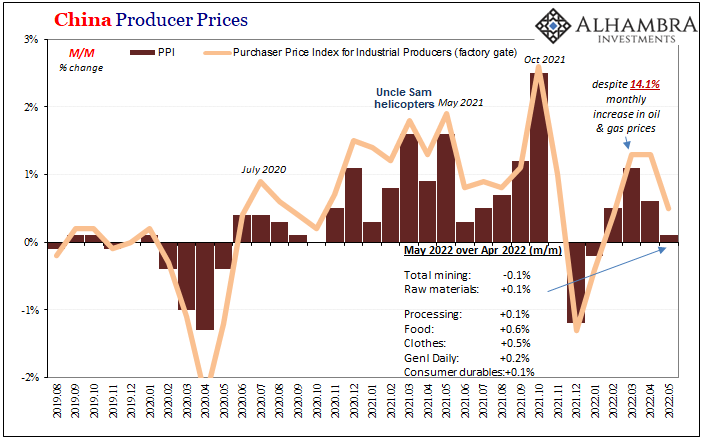
| And that had spilled over into China’s producer prices quite some time ago. The Chinese PPI, a very good proxy for the rest of the world, gained just 0.1% May over April, and was up just 6.4% year-over-year. That compares to a peak rate of 13.5% set last October – just like the yield curve – and is the slowest for producer prices dating back to March 2021 before this whole supply shock really got going.
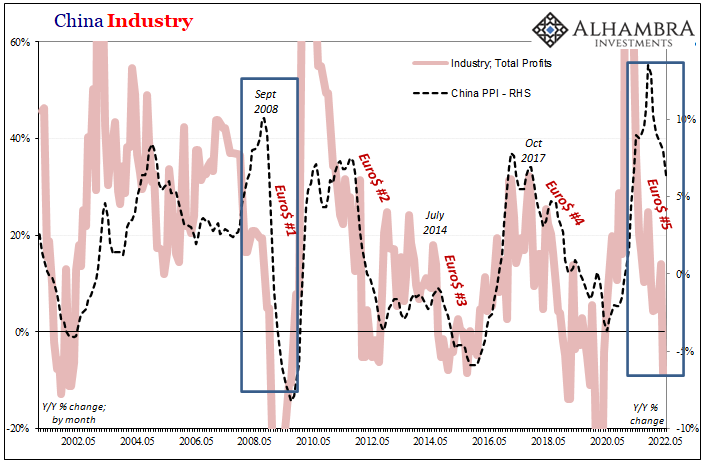
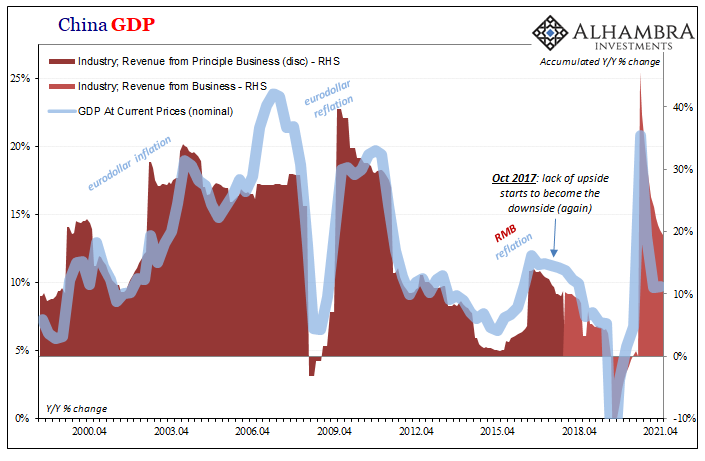
In terms of leading indicators, China’s PPI is way out in front of any other CPI. There has been a very solid relationship between Chinese producer prices (including factory gate prices), industrial profits (that are harmed when rising input and commodity costs aren’t passed to consumers, in China and elsewhere, restricting profit growth), nominal Chinese GDP therefore what the rest of the world can get from China that the rest of the world badly needs. And that means imports into China from everywhere else, which brings up shortfalls in external money (eurodollar) as well as domestic demand. |
|
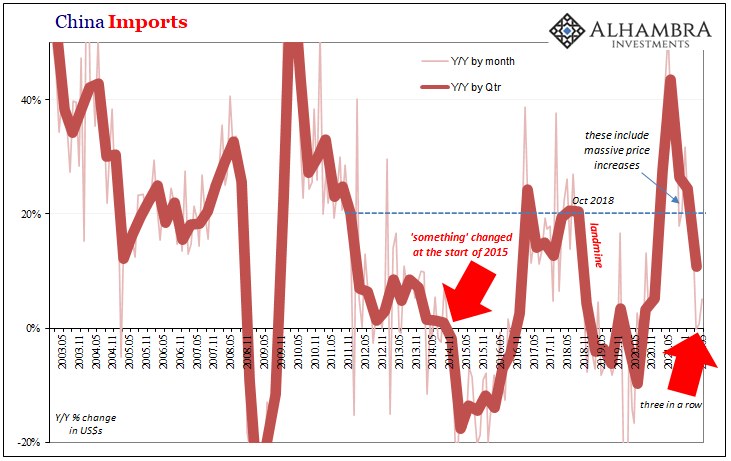
| According to the country’s General Administration of Customs also last week, while exports rebounded to 16.9% growth year-over-year in May (compared to 3.9% in April), imports didn’t improve really at all (4.1% compared to 0.01%). | |
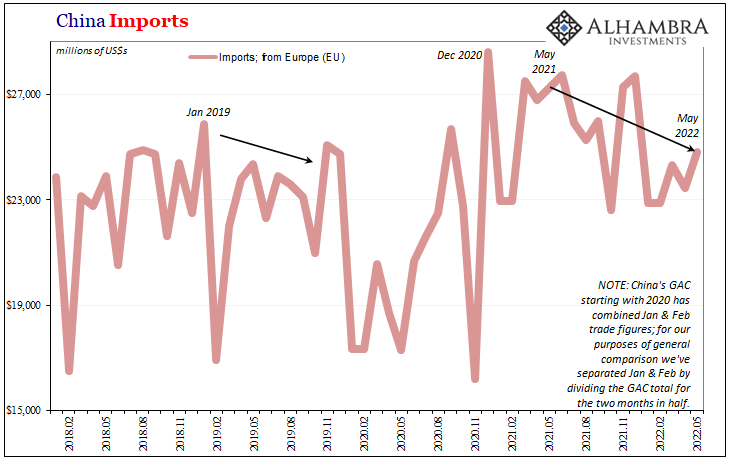
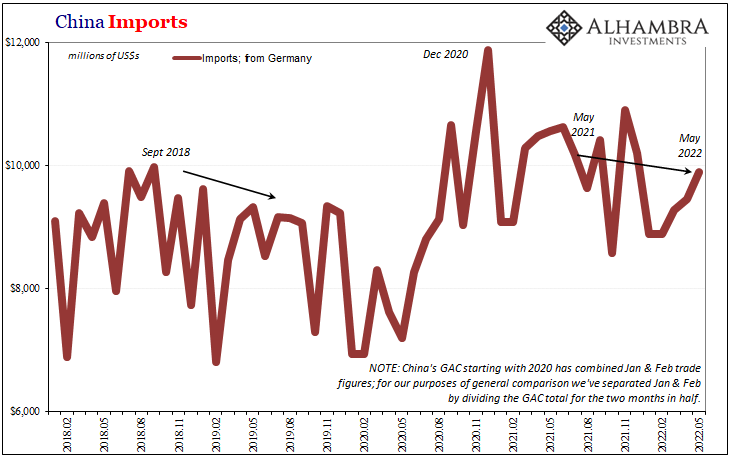
| Since these trade estimates are issued in nominal terms include price changes, export growth isn’t nearly as impressive at it seems (like Japan) while actual volumes from China have to be less that they had been a year ago. Goods coming in from Europe aren’t even increasing in nominal terms, thus weakness all across trade-oriented sectors in Germany and elsewhere.
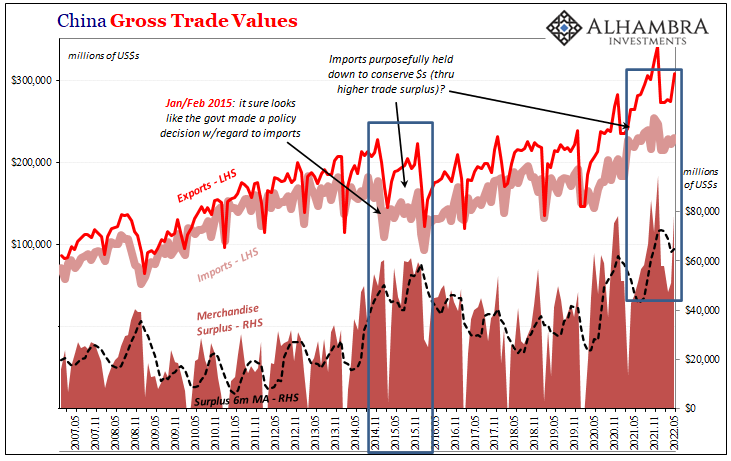
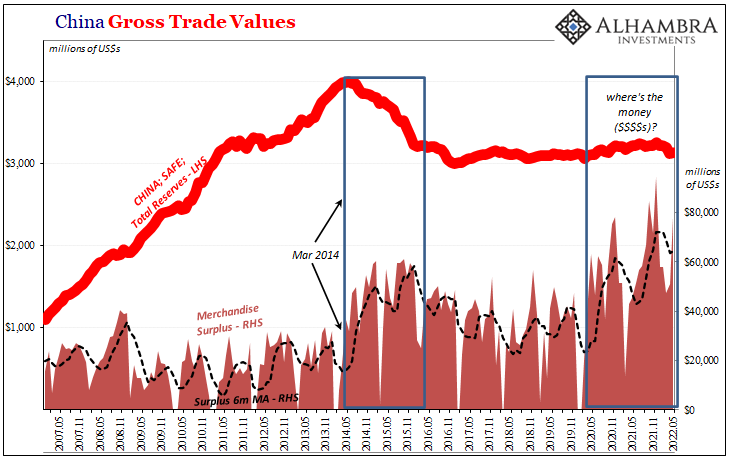
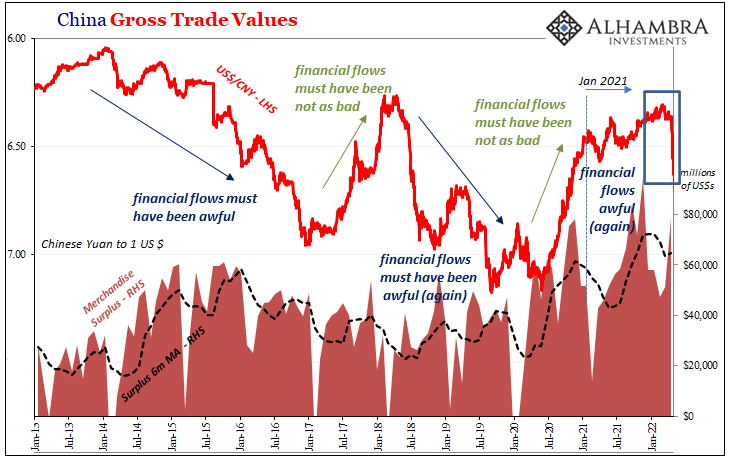
Since this is the third month in a row of basically zero nominal growth for Chinese imports, it’s more than reasonable to conclude the must-conserve-dollars policy is still being employed which conveys and spreads eurodollar financial shortfalls into rest-of-world real economy shortfalls. China’s merchandise surplus in May was nearly another record high, yet CNY is still close to 6.70 to the dollar and SAFE’s reported balance for total “reserves” only increased from by the smallest amount (from the worst three-month decline in years). |
Put everything together, it’s the opposite of what the US and European CPIs seem to propose. The global economy is rapidly slowing down (commodities, freight rates, etc.)
Decelerating producer prices in China coupled with especially falling (volume) imports are far more correlated with macro factors across the rest of the world, especially given these numbers in May when Shanghai and other cities/regions were allowed back to business. China is suffering from the global dollar shortage (Euro$ #5) and transmitting that weakness everywhere else around the world.
“There’s nothing to suggest a recession is in the works,” Ms. Yellen said.
Sure, to a former Fed-blind person, the ENTIRE bond market pricing for recession equals “nothing.”https://t.co/D9ts2sgLCR
— Jeffrey P. Snider (@JeffSnider_AIP) June 13, 2022
Therefore, global recession risks and the looming end to “inflation” are now being hedged harder into the UST curve’s (and Germany’s) back end. Because the front end is obliged to price instead the politics of Fed rate hikes based on the non-economic factors in gasoline and Russian oil, the US CPI, inversion is the inevitable result creating confusion as to what appears to be a puzzling conflict (at least in the US) between inflation vs. recession.
It’s only a conflict of interest rates, not actual economics (small “e”). The latter are increasingly clear, which is why even mainstream use of the R-word (and official denials) is (are) becoming more and more frequent.
Tags: Bonds,China,Consumer Prices,CPI,currencies,economy,exports,Featured,Federal Reserve/Monetary Policy,global trade,imports,inflation,Janet Yellen,Markets,newsletter,PPI,producer prices,recession


