Marc Chandler
My articles My offerMy siteAbout meMy videosMy books
Follow on:LinkedINTwitterSeeking AlphaAmazon
Swiss FrancThe Euro has risen by 0.18% to 1.0764 |
EUR/CHF and USD/CHF, August 11(see more posts on EUR/CHF, USD/CHF, ) Source: markets.ft.com - Click to enlarge |
FX RatesOverview: A rotation of sorts seems to be unfolding. The euro posted its second back-to-back loss in over a month. The Canadian dollar, which has been an under-performer among the major currencies for the past six weeks, gained, while most fell. The Dow Industrials and S&P 500 rose, the high flying NASDAQ fell for the second consecutive session for only the second time since May. However, today, the “rotation” seems to be only impacted gold, which is off for the third consecutive session, its longest decline in three months, helped by sales from the ETFs, which have been significant buyers. The yellow metal is off almost 2% to around $1983. The technical target we suggested was $1950 on a break of $2000. Equities are rallying. Japan returned from yesterday’s holiday and took the Topix up 2.5% (Nikkei 1.95%) and Hong Kong’s Hang Seng tacked on 2.1%, amid optimism Beijing is preparing new tourist visas to Macau. European shares are up for a third consecutive session, and the Dow Jones Stoxx 600 has advanced around 2.0% through the European morning. US shares are firmer with the S&P 500, about 0.65% better. Benchmark bond yields are a little firmer, though the European periphery bonds are more resilient (likely owing to the Eurosystem purchases). The US 10-year yield, which had flirted with 50 bp last week, is approached 60 bp now. September light sweet oil is confined to about a 50-cent range above $42. US inventories are expected to have fallen again. Key resistance is seen near the 200-day moving average (~$43.70). |
FX Performance, August 11 - Click to enlarge |
Asia PacificThe US is continuing to ratchet pressure higher on China. Following the latest sanctions and actions against two Chinese apps, the US has indicated that after late September, goods made in Hong Kong will be labeled “made in China” and subject to the same tariff schedule as the mainland. This measure, like sanctioning HK Chief Executive Lam, is about signaling, as there is little real substance in terms of inflicting pain or disruption. As we have noted before, most goods the US imports from Hong Kong have been re-exported from China, and the goods actually made in Hong Kong are less than 1.5% of US imports from it. |
China M2 Money Stock YoY, July 2020(see more posts on China M2 Money Stock, )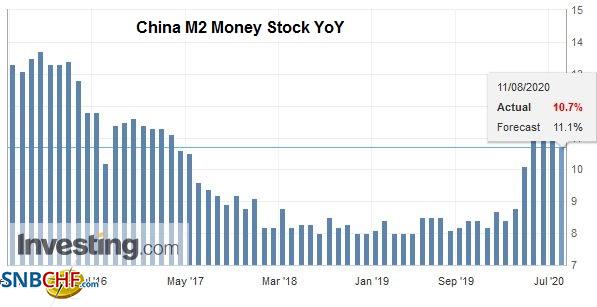 Source: investing.com - Click to enlarge |
| Meanwhile, China appears to be reining in the strong lending seen earlier this year. Indeed, the July lending figures were weaker than expected. New yuan loans, which is what the formal banking system generates, rose by CNY992.7 bln, and economists were looking for something closer to CNY1.2 trillion after CNY1.8 trillion in June. Aggregate financing, which includes non-bank financial institutions (shadow banking), rose by CNY1.69 trillion, less than half of the CNY3.43 trillion in June. |
China New Loans, July 2020(see more posts on China New Loans, )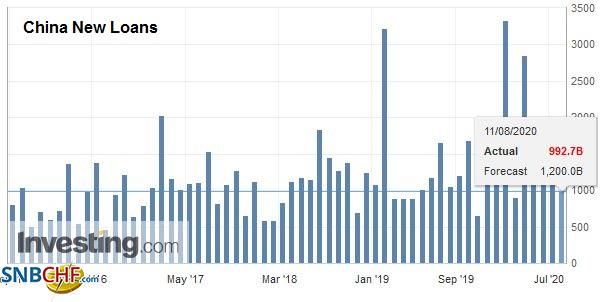 Source: investing.com - Click to enlarge |
| Japan reported June balance of payments and trade figures. Japan’s balance of payments in surplus (JPY167.5 bln) but considerably smaller than May’s JPY1.18 bln surplus. However, Japan continues to run a trade deficit (on BOP basis JPY77.3 bln in June after a JPY557 bln deficit in May. Japan’s broader surplus is a function of its capital account and income from dividends, royalties, licensing fees, profits, and earnings from operations abroad. In contrast, consider German trade numbers that were out last week. Its trade surplus drives its current account surplus (15.6 bln euro trade surplus in June and a 22.1 bln current account surplus. |
Japan Current Account n.s.a., June 2020(see more posts on Japan Current Account n.s.a., )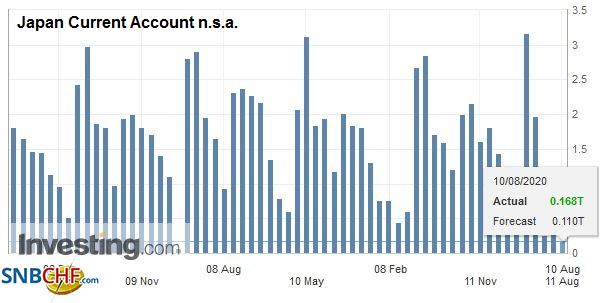 Source: investing.com - Click to enlarge |
The dollar traded at new six-day highs against the yen near JPY106.20. Last week’s high was a touch below JPY106.50, and trendline resistance is seen closer to JPY106.70. The option expiring today for about $765 mln at JPY106.00 may still cause some angst if the dollar pulls back in early North American trading. Initial support is pegged near JPY105.70. The Australian dollar is coming back bid after posting a small loss yesterday, its first back-to-back loss in a month. It has found support around $0.7140 and appears set to re-test the $0.7200-$0.7220 area. The dollar is about 0.2% weaker against the Chinese yuan (~CNY6.9475). The reference rate was set at CNY6.9711, compared with the median bank model collected by Bloomberg of CNY6.9693.
Europe
The German ZEW investor survey showed minor deterioration in the assessment of the current conditions, but optimism over the future continued to improve. The August survey showed the view of current conditions slipped to -81.3 from -80.9. Recall it bottomed at -93.5 in May. Expectations, on the other hand, rose to 71.5 from 59.3. This is a particularly strong reading and is the highest since 2003. Between loan guarantees and actual spending, Germany has been more aggressive than most other European countries in responding to the pandemic. We can’t help but wonder if this lays the foundation for new divergence in the coming years, even though the EU has a recovery fund and will issue a common bond.
| The UK’s employment data may spur pressure to increase the furlough program. In Q2, employment fell by 220k, and the claimant count rose 94.4k in July. July payrolls were about 770k lower than in March. Many people are discouraged from looking for work in current conditions, and this is helping keep the unemployment rate at 3.9% (three-months to June according to the ILO). It has been at 3.9% all year, except in February, when it briefly rose to 4.0%. |
U.K. Unemployment Rate, June 2020(see more posts on U.K. Unemployment Rate, )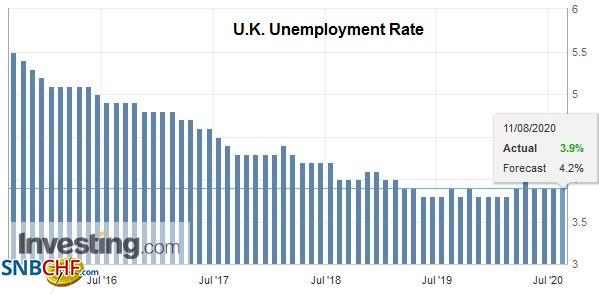 Source: investing.com - Click to enlarge |
| Separately, reports suggest that the UK’s try to get better terms than Japan gave to the EU is jeopardizing being able to conclude a trade agreement by the end of this month. The issue, which the UK appears to put pride and spin ahead of substance is over blue cheese. Note that the free-trade agreement with Japan, which phases out UK tariffs on autos and auto parts, is estimated to boost UK’s GDP by 0.7% over the long-term while leaving the EU costs an estimated 5% of GDP. |
U.K. Average Earnings ex Bonus, June 2020(see more posts on U.K. Average Earnings ex Bonus, )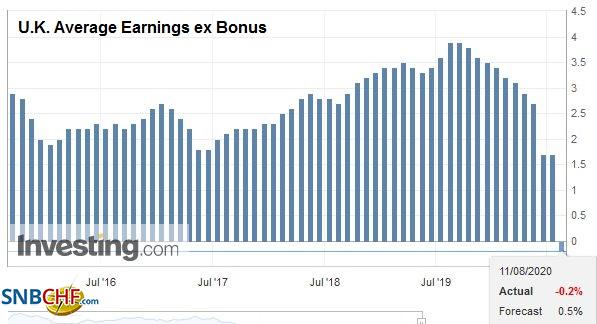 Source: investing.com - Click to enlarge |
The euro recorded a five-day low a little above $1.1720 before rebounding to $1.1785 in the European morning. Yesterday’s it briefly poked above $1.18, where there is an option for roughly 675 mln euros that will be cut today. An option for 2.1 bln euros that expires tomorrow is struck at $1.1875. The intraday technical readings are stretched, and this may encourage early North American dealers to sell into the euro’s upticks. After bottoming near $1.3055 in late Asian turnover, sterling is testing the $1.31 area, where it peaked yesterday. The intraday technical readings are not as stretched as the euro’s, but gains are likely to be capped in front of the $1.3140 area.
America
Ahead of the review of the Phase 1 trade agreement later this week, reports suggest China is stepping up its purchases for US soy. Six cargoes for November and December shipments apparently were bought yesterday. Reports suggest the new soy orders may be coming at the expense of Brazil.
President Trump opined that Q3 GDP could be 20%. While this could simply be a case of cheerleading and aspirational, it is notable that the Atlanta Fed’s GDP tracker currently puts it at 20.5%. The NY Fed’s model is at 14.6%. Trump has said he is considering a capital gains tax cut. While the executive branch does not have that authority, it could index capital gains to inflation, which has long been advocated by some Republicans.
The US reports July producer prices today. They are not typically a market-mover even in the best of times. The headline year-over-year rate will remain in deflationary territory, (-0.7% likely instead of -0.8%). Even when energy (and food) are dropped, the core PPI is expected to have remained near zero. Still, the week’s data highlights, which include CPI, retail sales, and industrial production, lie ahead. Canada reports July housing starts. They may ease after jumping by more than a quarter in the May-June period. Like the US, housing and autos, appear to be leading the Canadian recovery. Mexico is expected to announce that the four-month slide in industrial output came to an end with a bang in June. The median forecast in the Bloomberg survey projects a 17.1% increase in the month, as the manufacturing sector got some traction even though the pandemic continues to hit hard. The highlight for Mexico will likely be the rate cut later in the week (from 5.0% to 4.5%). Minutes from last week’s Brazil’s central bank meeting, where a 25 bp rate cut was delivered. These may prove more important than usual as investors try to work out how much easing is left and the chances that the central bank uses its recently granted powers to buy long-term assets (government and corporate bonds).
The US dollar has given back the gains against the Canadian dollar scored in the last two sessions. The greenback is pushing through CAD1.33, where a $712 mln option is set to expire today. Last week’s lows were set near CAD1.3235-CAD1.3245. That is the next target. That said, the intraday technicals are stretched. Resistance is seen in the CAD1.3340-CAD1.3360 area. The US dollar is at the lower end of the five-day range (MXN22.30-MXN22.32). While there is some scope for intraday penetration, the market does not appear to have much conviction. Here, too, the intraday technicals are a bit stretched, suggesting limited scope for follow-through dollar selling in the North American morning. The dollar settled yesterday at its best level against the Brazil real in over a month (~BRL5.48). Nearby resistance is seen in the BRL5.50-BRL5.53 area. Support is pegged around BRL5.34-BRL5.35.
Graphs and additional information on Swiss Franc by the snbchf team.
Full story here Are you the author?Tags: #USD,Brazil,China,Currency Movement,Featured,Hong Kong,newsletter,U.K.